图表作文句型
- 格式:doc
- 大小:24.00 KB
- 文档页数:6
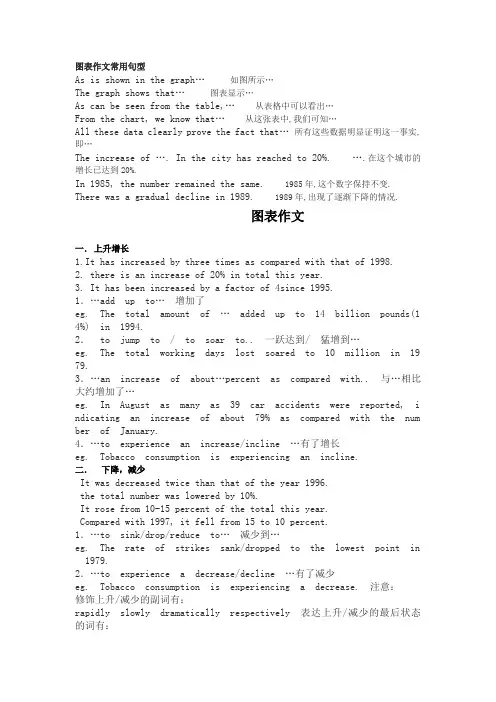
图表作文常用句型As is shown in the graph…如图所示…The graph shows that…图表显示…As can be seen from the table,…从表格中可以看出…From the chart, we know that…从这张表中,我们可知…All these data clearly prove the fact that…所有这些数据明显证明这一事实,即…The increase of …. In the city has reached to 20%. ….在这个城市的增长已达到20%.In 1985, the number remained the same. 1985年,这个数字保持不变. There was a gradual decline in 1989. 1989年,出现了逐渐下降的情况.图表作文一.上升增长1.It has increased by three times as compared with that of 1998.2. there is an increase of 20% in total this year.3. It has been increased by a factor of 4since 1995.1.…add up to…增加了eg. The total amount of … added up to 14 billion pounds(14%) in 1994 .2. to jump to / to soar to.. 一跃达到/ 猛增到…eg. The total working days lost soared to 10 million in 1979. 3.…an increase of about…percent as compared with.. 与…相比大约增加了…eg. In August as many as 39 car accidents were reported, indicating a n increase of about 79% as compared with the number of January. 4.…to experience an increase/incline …有了增长eg. Tobacco consumption is experiencing an incline.二.下降,减少It was decreased twice than that of the year 1996.the total number was lowered by 10%.It rose from 10-15 percent of the total this year.Compared with 1997, it fell from 15 to 10 percent.1.…to sink/drop/reduce to…减少到…eg. The rate of strikes sank/dropped to the lowest point in 1979. 2.…to experience a decrease/decline …有了减少eg. Tobacco consumption is experiencing a decrease. 注意:修饰上升/减少的副词有:rapidly slowly dramatically respectively 表达上升/减少的最后状态的词有:the highest peak the lowest point 10 million 10%三.起伏1.…to go up and down …起伏不定eg. The strike rate went up and down during the period from 1952 to 1 967.2.There be ups and downs …有起有伏eg. Between 1972 and 1979, there were several ups and downs in (某方面).四.稳定1.…to remain steady/level/unchanged …保持稳定,几乎不变eg. The rate of …remained steady (fairly level/almost unchanged) dur ing the four years from 1963 to 1967.2.…to level off (vi.)eg. After a steady decline for a whole decade, the …rate shows signs of leveling off.注意:修饰起伏或稳定状态的副词有:almost fairly 可以用于表达起伏,稳定状态的句子中的词组或句型:the general situation was not worseningshow indications of improvementit can be predicted that…eg. The rate of …remained steady during the four years from 1963 to 1967,and it can be predicted that the general situation was not worse ning.eg. The rate of …remained steady during the four years from 1963 to 1967,showing signs of improvement in …五.成正比,反比1.…be in direct /inverse ratio to/with 与…成正比/反比eg. Male illustrations are in direct ratio to /with the advancement o f grades, while female illustrations are in inverse ratio.六.占百分之几,几分之几1….to form/comprise/make up/constitute ….percent…占百分之…eg. Women comprise more than 50% of the US.population.eg. Females make up only 24% of the illustrations whereas males const itute 76%.2.…to form/comprise/constitute a half/third/fourth of……占…的1/2,1/3,1/4eg. Female illustrions form less than a fourth of the total. 3.…account for…percent占百分之几eg. ……, accounting for approximately 20 percent of…七.倍数1.A be …times as much/many as Beg. The annual rainfall of Hunan is 5 times as much as that of Sichua n.2.A doubles/is half/triples B A是B的两倍,一半,三倍eg. The annual rainfall of Jidda doubles that of Janta, but is only h alf the amount of rain Kuwait receives each year. It would be expectedto increase 5 times.the table shows a three times increase over that of last year.the number is 5 times as much as that of 1995.It has decreased almost two and half times, compared with…描写图表和数据的句型1) .. . rank first (both) in...2) .. .in proportion to...3) A is by far the largest...4) As many as....5) the number is ...times as much as that of ...6) the figure has nearly doubled/tripled, as against that of last year.7) It accounts for 35% of...8) By comparison with ..., it decreased/increased/fell from...to...9) ...rise rapidly(slowly)10) ...remain level...11) ...reach ...12)there is a slight/slow/steady/rapid rise/increase demand./income./population./prices./production./decrease/decline/redu ction/fall/drop in13) be on the increase/decrease/rise/decline (……在不断的增加,减少,上升,下降)●图表作文中的过渡、概括句型:1) As can be indicated in the table, ...4) As the survey results show,...5) This table provides several important points of comparison bet ween,...6) The two graphs depict the same thing in ...7) The key findings taken from the surveys are as follows:8) According to the figures given in the table, ...10) As is shown by the graph, ...11) It can be seen from the statistics that ...12) It is generally believed /accepted/thought/held ...。
图表类小作文必备句型
段落一,数据展示与对比。
看这儿,图表上明明白白地写着呢!去年第四季度销售额嗖嗖地涨了15%,这都是因为咱们推出了新产品,还调整了营销策略。
而那竞争对手,市场份额就像泄了气的皮球,咱们的市场地位就更加明显了。
段落二,趋势分析与预测。
瞅瞅过去五年的销售数据,咱们的产品在市场上稳扎稳打,就像爬山一样一步步往上走。
照这个势头下去,未来几年咱们市场份额肯定还能涨,盈利也能跟着水涨船高。
段落三,数据解读与结论。
图表上那些数字可是个好兆头!客户对咱们产品的满意度越来越高,这都得归功于产品质量和售后服务的提升。
这么一来,客户们更信任咱们了,公司的长期发展也更有保障了。
段落四,数据背后的故事。
这些数据可不是天上掉下来的,背后都是咱们团队的辛勤付出。
从市场调研到产品研发,再到市场推广,每个环节都少不了团队成
员的智慧和努力。
这些成绩,都是大家用汗水和智慧换来的。
段落五,数据的启发与启示。
看着这些数据,我心里就有数了。
想要在竞争激烈的市场中站
稳脚跟,就得不断创新,满足客户需求。
这些数据不仅仅是数字,
更是咱们未来发展的指南针。
(一)常用开头模板1.according to the chart, it is clear that._根据这个图表,可以很清晰地看出……2.the chart shows the turnover of...这个图表说明了……的逆转/3.many reasons contribute to the phenomenon.很多原因都能证明这个现象。
4.during the period from ...to..., 从……年……到……年,5.... decline/rose (quickly) from...to...……从……猛烈的/上涨下降到……6.seen from the chart, it can be included that...从图表中可以看出,它包括……i.among …,…account for… 在……中,……可以说明……8.it has increased by •••times as compared with that of... 它与……相比上涨了……9.there is an increase of in total this year.在全年有一个……的上涨。
10- it has been increased…已经上涨了……ii.it would be expected to increase times.预期上涨了……12.the table shows a ... increase over that of last year.这个表格显示出比去年上升了……13.it was decreased... than that of the year...与……年相比下降了……14.the total number was lowered by... 总数目下降了……15.it rose from .••percent of the total this year.全年上涨了……个百分点。
关于图表的作文常用句型1起伏不定go up and down/ wave/ fluctuate/ be unstable/ be in flexible2 The first point to note is the huge increase in the number of需要注意的第一点就是的急剧增长3 The statistics show that这些数据表明4占百分之几Form/comprise/make up/constitute/ account for .percent5 This cure graph describes the trend of该曲线图描述了的趋势6 The statistics lead us to the conclusion that由这些数据,我们可以做出如下结论7 As can be seen from the line graph,由线状图我们可以看出8增加:Increase / raise / rise / go up/ soar/ ascend/ mount/ climb 9减少:Decrease / grow down / drop / fall/ reduce/ descend/ shrinkto/decline10稳定:Remain stable / stabilize / level off/ remain unchanged11 It can be seen from the table that由表格我们可以看出12 The table shows the changes in the number of over the period fromto该表格展示了从到数据的变化13 The table provides some data of该表格提供了有关的数据。

图表作文首段:1. As illustrated by the figure/percentage in the table/ chart, XXX has been on the rise/decrease, dramatically rising/ decreasing from A% in 19XX to B% in xxxx. Judging from the sharp decline/ rise in the chart, we may conclude that …….2. From the above chart, we can see distinctly that A has witnessed an huge rise/decline as distinct from / in contrast to the drastic rise/decrease in B from 19XX to 20XX. In 19XX, the percentage/number of XX was…, However, by 20XX, the percentage/number of XX has wend down/soared up to X%.表示在过去十年间的表达:1.in a passage of a decade.2.over the past decade.3.in a matter of a decade.中间段:分析原因分析原因句型:1. Why are there such great changes during the past X years? In my opinion, three possible reasons contribute to it.2. Several factors can be identified to account for this problem/ phenomenon.图表作文结尾段:如果这篇文章讲的是一个令人担忧的问题,那么结尾段很可能是谈解决办法。
图表作文常用句型1. The table shows the changes in the number of … over the period from… to …该表格描述了在……年到……年间……数量的变化。
2. The graph provides some interesting data regarding ...该图为我们提供了有关……有趣数据。
3. This is a curve graph which describes the trend of ...这个曲线图描述了……的趋势。
4. The figures/statistics show that ... 数据表明……5. The data/statistics/figures lead us to the conclusion that ...这些数据资料令我们得出结论……6. As is shown/demonstrated/exhibited in the chart... 如图所示……7. Although the raw data does not provide an explanation for these trends…尽管原始数据没有为这些趋势提供解释8. When coupled with the graphic information, leads to some possible conclusions... 结合图表信息,就可能得到一些结论……9. As can be seen from the diagram, great changes have taken place in ...从图中可以看出……发生了巨大变化。
10. From the table/chart/diagram/figure, we can see clearly that ...从图表我们可以很清楚明显看到……11. This table shows the changing proportion of a and b from ... to ...该表格描述了……年到……年间a与b的比例关系。
图表类作文常用句型1.the table shows the changes in the number of...over the period from...to... 该表格描述了在...年之...年间...数量的变化。
2.the bar chart illustrates that...该柱状图展示了...3.the graph provides some interesting data regarding...该图为我们提供了有关...有趣数据。
4.the diagram shows (that)...该图向我们展示了...5.the pie graph depicts (that)....该圆形图揭示了...6.this is a cure graph which describes the trend of...这个曲线图描述了...的趋势。
7.the figures/statistics show (that)...数据(字)表明...8.the tree diagram reveals how...该树型图向我们揭示了如何...9.the data/statistics show (that)...该数据(字)可以这样理解...10.the data/statistics/figures lead us to the conclusion that...这些数据资料令我们得出结论...11.as is shown/demonstrated/exhibited in the diagram/graph/chart/table... 如图所示...12.according to the chart/figures...根据这些表(数字)...13.as is shown in the table...如表格所示...14.as can be seen from the diagram,great changes have taken place in...从图中可以看出,...发生了巨大变化。

图表作文一、常用句式与结构1、对图表的描述1)介绍图表showndescribed graph, …As is illustrated in the chart, …indicated table, …revealedtable, …As can be clearly seen from the chart, …graph, …According toAs can be seen from the table…It can be seen fromIt is self-evidentIt goes without saying that …There is no denying the fact2) 数据变化的表达方法suddenlyincrease rapidlyjump dramaticallyThe number / amount of …rise sharply/ steadily from….to….decrease graduallydropped slowlyfall slightlysuddenrapiddramatic increaseThere is a significant jump in the number ofsharp rise amount from… to…steady decreasegradual dropslow fallslight3) 统计数据的表达方法Twice as many asThree times muchOne fifthA quarter ofA thirdA half4) 开头和结尾的常用句型(1)The two graphs describe the same thing seen in two different ways.(2)The first diagram simply records…(3) The second graph throws a new light on…(4) The key findings taken from the surveys are follows:…(5) This table provides several important points of comparison between A andB.(6) It is obvious in the graphic/ table that the rate/number/amount of Y has undergone dramatic changes.(7) It has gone up/ grown/fallen/dropped considerably in recent years (as X varies). At the point of X1, Y reaches its peak value of …(8) What is the reason for this change? Mainly there are…reasons behind the situation reflected in the graphic/ table. First of all,…. More importantly,…Most important of all,…(9) From the above discussions, we have enough reason to predict what will happen in the near future.(10)The trend describe in the graphic/table will continue for quite a long time if necessary measure are not taken.2、对于线性图表的描述1)对于各种趋势的描述2)对于上升到某个位置的描述:(1) A 组中的动词+ to+具体数据(2) A 组中的动词+ to+the peak of +具体数据(3) A 组中的动词+ reaching the peak of +具体数据(4) A 组中的动词+ reaching+具体数据(5) to peak at +具体数据(6) to climb to +具体数据3)对于上升的程度的描述:(1) A 组中的动词+ by+具体数据(2) A 组中的动词+副词4)对于下降到某个位置的描述:(1) C组中的动词+ to+具体数据(2) C 组中的动词+ to the bottom of +具体数据(3) C 组中的动词+ reaching the bottom of +具体数据(4) C 组中的动词+ reaching+具体数据5)对于下降程度的描述:(1) C组中的动词+ by+具体数据(2) C组中的动词+副词6)对于上升和下降趋势的组合描述:(嵌入了时间和程度之后)3、对于柱状图形的描述(可见线性图形)4、对于饼状图形的描述二、常用词与短语图表类型:table, chart, diagram, graph, column chart, pie graph描述:show, describe, illustrate, can be seen from, clear, apparent, reveal, represent内容:figure, statistic, number, percentage, proportion(成比例)上升:increase, rise, ascend(上升) , surge, go up, climb, mount(增长), level up下降:decrease, fall, drop, descend, decline, reduce, lessen(减少), level down平稳:stable, steady, remain/maintain/keep/ be the same as/ similar to波动:fluctuate, fluctuation, rise and fall up and down占:occupy, take up, account for, gain而:while, however, whereas, on the other hand, actually/ in fact相比:by contract, on the contrary, likewise, compared with最高点:the highest, the top, the summit(定点), the peak, the most最低点:bottom, less, least, rock bottom平均:mean(平均数), average趋势:tendency, trend, inclination(倾斜)预见:prediction达到顶峰:mount to占比例:gain the percentage of有一个稳定的过程:a stable period can be seen。
第一类: 对比句1.In 2007, only 11% of Indian households had air-conditioning, compared with/to 86% in the US. ---大小数据对比2.Teachers’ salary was the largest cost of the school, while/whereas the amount of money spent on books was the smallest.—特点的对比3. The cost of food accounted for the largest proportion of the family expenses (40%), followed by the cost of gasoline (25%) and the money spent on education and training (15%).4. 标准比较句The proportion of people choosing rock music was considerably/slightly larger than that of people who were in favor of classical music, at respectively 60% and 17%.considerably---significantlyslightly---narrowly5. 总分关系Singapore has a population of about 4 million people, with Chinese accounting for 3 quarters. –其中---切入点关键句The total sales of Coke reached 17.1 billion dollars in 2000, with North America having the largest proportion which was 34%, compared with only 7% in Africa and Middle East.6. Similar的代替The difference between the spending on entertainment and sightseeing is barely noticeable. –差距非常小In Germany, the proportion of people buying pop and rock music varied slightly, constituting 20% and 27% respectively. –差别不大第二类:变化类基础变化1). 主语saw a形容词名词The proportion of elderly people saw a considerable increase during the 20-year period from 5% to 17%.Both the popularity of beef and lamb saw/showed an increasing trend.The UK saw a remarkable increase in terms of the number of tourists from overseas.2). 动词+副词The use of mobile phones increased dramatically, rising from 55% to 80%. Increased-rose-grewDecreased-fell-declinedDramatically-substantially-considerably-slightly-marginally-steadily3). There was a 形容词+名词in………There was a dramatic increase in the use of mobile phones.2. 特殊变化—可遇而不可求1). The proportion of elderly people aged over 65 almost doubled/tripled, rising from 9% in 2000 to 16% in 2005. –成倍增长2). The number of wild birds in the UK halved, declining from 5 million to 2.5 million. ---减少一半3). Between 1995 and 2000, the amount of goods transported by road remained relatively stable, at approximately 70 million tons.3. 复杂句1). 先…..再…..The cost of books had increased to 23% by 1991 before decreasing to only 9% by the end of the period.2). 总体来看……,尽管……In general, the share price saw a dramatic increase from 35 dollars in 1996 to 80 dollars in 1998, despite a noticeable decrease in 1997.3). 起伏波动The number of prisoners in the US fluctuated wildly, ranging between 80,000 in 1950 and 120,000 in 1980.4). 最明显变化This rise was particularly noticeable between 1999 and 2005, during which time the use of mobile phones almost tripled.。
图标作文句型第一段:简述图标信息1.As is shown in the graph / table, …根据图表所示2.From the graph, we know the statistic of … and it can be easily seen that …从图表中我们了解到有关…数据,显而易见的是…3.From the above chart, we can observe that…从以上的表格中,我们可观察到…第二段:分点阐述原因1.What are the reasons leading to the situation reflected in the graph? Firstly, … Secondly, …Thirdly, …是什么原因导致图表中反映的情况?首先,…;其次,…;再次,…。
2.There are many reasons responsible for this situation, and the followings are typical. For onething, …In addition, …The main reason is that …图表中反映出的情况是由多方面造成的,主要原因如下:首先, …; 其次,…; 更重要的是, …。
3.Several reasons, in my opinion, can be identified to account for this phenomenon. To beginwith, … Also, … Additionally, …就我而言,图表中反映的现象有几个原因。
首先,…; 其次, …; 再次, …。
第三段:我的建议或呼吁1.Let’s … and strive for …为了…让我们…。
2.Thus, we should … to ensure … Only in this way can we…因此,我们应该…以确保…;只有这样才能…。
图表作文图形(figure)>表格(table)>曲线图(graph)、柱状图(pie chart)和饼状图(pie chart)前半部分说明图标所表达的信息,后半部分进行议论,最常见的模式是:第一段:描述现状。
简要地描述图表,概括图表所表现的社会问题。
第二段:分析原因。
剖析图表所反映的深层次问题。
用图表来论证第一段提出的主题,或者分析各个数据产生的原因。
第三段:结论和启示。
从图表中所体现的现象获得结论或者启示,或者对图标所表现的趋势加以预测。
图表作文模式:①As is shown/depicted/described in the picture/chart,概括图表内容。
②For one thing,支持这一内容的一个方面。
③For another,支持这一内容的另外一个方面。
④It is obvious that图表所反映的内容。
⑤Many remarkable factors contribute to 主题。
⑥First of all,理由一。
⑦In addition,理由二。
©Thirdly,理由三。
⑨ Considering all these, I believe that 我的看法或偏好。
⑩ First of all,个人看法的依据一。
(ll)Furthermore,个人看法的依据二。
(12)Therefore,个人的结论或文章的结论。
Example:It is obvious in the graph/table that the rate/number/amount of Y has undergone dramatic changes. It has gone up/grown/follen/dropped considerably in recent years (as X varies). At the point of (接近)X1, Y reaches its peak value of ...(多少).What is the reason for this change? Mainly there are ...(多少)reasons behind the situation reflected in the graphic/table. First of all, ...(第一个原因).More importantly, ...(第二个原因).Most important of all, ...(第三个原因).From the above discussions, we have enough reason to predict what will happenin the near future. The trend described in the graph/table will continue for quite a long time (if necessary measures are not taken括号里的使用于那些不太好的变化趋势). 描写图表和数据的句型:1.篇首As we can see from the chart/ As is shown in the table/ According to the table,the price of oil increased dramatically.2.数据变化常用句型数据的增K:There was a rapid/sharp /dramatic/gradual/slow increase/rise in the number of students.The number of students is on the rise/on the increase.数据的降低The number of ... dropped steadily from / declined suddenly / fell/ tends to go down/ shows a tendency to decrease.…There is a sharp fall/ gradual decrease/ sudden reduction / slow decline / drop ..in the number of ..in 2006.数据的持平There was little change/hardly any change in the number of between ...and .../表示比较级、倍数、比例关系表示比较Compared A with BI prefer to read rather than watch TV.表示数量It has increased (decreased) from... to...The output of July in this factory increased by 15 % compared with that ofbe in direct ratio to/with J 我正比 be in inverse ratio to/with 成;反 比 have the largest percentage /proportion of 占最大比例the number of.. makes up /takes up / accounts for fifty percent of the total. 占总量的50%Compared with...,... has a higher / lower percentage 与。
图表作文:1.As we can see from the chart/table…2.The chart/graph/ table/ displays that…3.As can be shown in chart/graph/table/diagram…4.The figures/statistics in the chart reflect/show/reveal that…5.It is clear/apparent from the chart/graph/table/diagram that…表示“数据”的常用句型:1.… has the largest percentage/proportion of …2.….. account (s) for / take(s) up 10% .pared with A, B has a higher percentage.4.On the top of the list is …., which accounts for 60%.5. A is second to B.6. A is ranked/rated first, followed by B at 30% and C at 25%.表示数据变化的常用句型:A 表示增加、减少和波动的常用结构:1. The number of …… increased /rose suddenly/ rapidly/dramatically/ sharply from…. to….2. There was a sudden /rapid dramatic/substantial/considerable/ increase in the number of ….3. There was a slight/ slow/ increase in the number of ….4. The number of …increased slightly/slowly from…. to …5. There was a sudden/rapid dramatic sharp decrease/drop/reduction/decline in the number of ….from … to….表示变化不大或没有变化的常用结构1.The number of ….. remained steady/stable between …and …2.There was little /hardly any change in the number of …… between ….. and….表示最高点或最低点的常用结构:1.The situation/figures reached a peak at …% in…2.The situation/figures bottomed out at ….% in…表示倍数的常用结构:1. A is twice /three times /four times as much /many as … in…2.It was decreased twice than that of the year 1996.3.It has increased by three times as compared with that of 1998.。
图表作文句型和范文一、句型number of…/the proportion of…/information of…/the trend of…/the fluctuation of…/some interesting data regarding…/ the changes in the number of...over the period from...to../the changing proportion of a & b from...to....(a与b的比例关系)/that…This is a graph which illustrates/illustrating...The graph, presented in a pie chart, shows the general trend in....该图以圆形图形式描述了...总的趋势。
B.主体段句型描述信息出处(使文章更客观):According to/As (is) can be seen from theIt can be seen/We can see /It is clear (apparent) from the table/chart/diagram/graph/figures (that)…From the chart, we can see clearly that....增加、减少和波动(句型核心为动词+副词、形容词+名词):The number of N. increased/jumped/soared/went up/rose/decreased/dropped/shrank/fell/fluctuated suddenly/rapidly/dramatically/significantly/sharply/steeply/steadily/gradually/slowly/slightly from…to…between…and….....decreased year by year while...increased steadily. ...逐年减少,而...逐步上升。
图表作文常用句型●表示“说明”的常用句式在说明图表的时候,要使用下列表示“说明”的常用句式,它们可以帮助读者弄清楚所引信息的出处,有效地将你要说的话带出来。
1.As we can see from the chart/graph / table/diagram,…从图表中可以看出……2.The chart/graph / table/diagram shows/displays that,…如图所示……3.As can be shown in/According to the chart/graph / table/diagram,…如图所示……4.The figures/statistics in the chart reflect/show/reveal that…图表中的数据表明……5.The chart/graph/table/diagram illustrates/describes…图表描述了……6.It is clear/apparent from the chart/graph / table/diagram that…从图表我们可以清楚地看到……●表示“数据”的常用句式1.…had the largest percentage/proportion of… ……在……方面具有很大的百分比。
2.…account (s) for/take (s) up 10%.……占有10%。
3.Compared with A, B has a higher percentage.与A相比,B有更高的比例。
4.On the top of the list is…, which accounts for 60%.占比重最高的是……,占60%。
5.At the b ottom is…, which takes up 20%.占最低比重的是……,占20%。
6.A is second to B. A仅次于B。
图表作文写作常识(句型)1、图形种类及概述法:泛指一份数据图表:a data graph/chart/diagram/illustration/table 饼图:pie chart直方图或柱形图:bar chart / histogram趋势曲线图:line chart / curve diagram表格图:table流程图或过程图:flow chart / sequence diagram程序图:processing/procedures diagram2、常用的描述用法The table/chart diagram/graph shows (that)According to the table/chart diagram/graphAs (is)shown in the table/chart diagram/graphAs can be seen from the table/chart/diagram/graph/figures,figures/statistics shows (that)……It can be seen from the figures/statisticsWe can see from the figures/statisticsIt is clear from the figures/statisticsIt is apparent from the figures/statisticstable/chart/diagram/graph figures (that)……table/chart/diagram/graph shows/describes/il lustrates how……3、图表中的数据(Data)具体表达法数据(Data)在某一个时间段固定不变:fixed in time在一系列的时间段中转变:changes over time持续变化的data在不同情况下:增加:increase / raise / rise / go up ……减少:decrease / grow down / drop / fall ……波动:fluctuate / rebound / undulate / wave ……稳定:remain stable / stabilize / level off ……最常用的两种表达法:动词+副词形式(Verb+Adverb form)形容词+名词形式(Adjective+Noun form)二、相关常用词组1、主章开头图表类型:table、chart、diagram graph、column chart、pie graph描述:show、describe、illustrate、can be seen from、clear、apparent、reveal、represent内容:figure、statistic、number、percentage、proportion2、表示数据变化的单词或者词组rapid/rapidly迅速的,飞快的,险峻的dramatic/dramatically戏剧性的,生动的significant/significantly有意义的,重大的,重要的sharp/sharply锐利的,明显的,急剧的steep/steeply急剧升降的steady/steadily稳固的,坚定不移的gradual/gradually渐进的,逐渐的slow/slowly缓慢的,不活跃的slight/slightly轻微的、略微地stable/stably稳定的3、其它在描述中的常用到的词significant changes图中一些较大变化noticeable trend明显趋势during the same period在同一时期grow/grew增长distribute分布,区别unequally不相等地in the case of adv.在……的情况下in terms of / in respect of / regarding在……方面in contrast相反,大不相同government policy政府政策market forces市场规率measure n.尺寸,方法,措施v.估量,调节forecast n.先见,预见v.预测三、英语图表写作套句精选1.the table shows the changes in the n umber of……over the period from……to……该表格描述了在……年之……年间……数量的变化。
2.the bar chart illustrates that……该柱状图展示了……3.the graph provides some interesting data regarding……该图为我们提供了有关……有趣数据。
4.the diagram shows (that)……该图向我们展示了……5.the pie graph depicts (that)……该圆形图揭示了……6.this is a cure graph which describes the trend of……这个曲线图描述了……的趋势。
7.the figures/statistics show (that)……数据(字)表明……8.the tree diagram reveals how……该树型图向我们揭示了如何……9.the data/statistics show (that)……该数据(字)可以这样理解……10.the data/statistics/figur es lead us to the conclusion that……这些数据资料令我们得出结论……11.as is shown/demonstrated/exhibited in the diagram/graph/chart/table……如图所示……12.according to the chart/figures……根据这些表(数字)……13.as is shown in the table……如表格所示……14.as can be seen from the diagram,great changes have taken place in……从图中可以看出,……发生了巨大变化。
15.from the table/chart/diagram/figure,we can see clearly that……or it isclear/apparent from the chart that……从图表我们可以很清楚(明显)看到……16.this is a graph which illustrates……这个图表向我们展示了……17.this table shows the changing proportion of a & b from……to……该表格描述了……年到……年间a与b的比例关系。
18.the graph,presented in a pie chart,shows the general trend in……该图以圆形图形式描述了……总的趋势。
19.this is a column chart showing……这是个柱型图,描述了……20.as can be seen from the graph,the two curves show the flutuation of……如图所示,两条曲线描述了……的波动情况。
21.over the period from…to…the…remained level.在…至…期间,…基本不变。
22.in the year between……and……在……年到……期间……23.in the 3 years spanning from 2005 through 2008……2005年至2008三年里……24.from then on/fro m this time onwards……从那时起……25.the number of……remained steady/stable from (month/year)to (month/year)……月(年)至……月(年)……的数量基本不变。
26.the number sharply went up to……数字急剧上升至……27.the percentage of……stayed the same between……and…………至……期间……的比率维持不变。
28.the fig ures peaked at……in(month/year)……的数目在……月(年)达到顶点,为……29.the percentage remained steady at……比率维持在……30.the percentage of……is slightl y larger/smaller than that of…………的比例比……的比例略高(低)。
31.there is not a great deal of difference between……and…………与……的区别不大。
32.the graphs show a threefold increase in the number of……该图表表明……的数目增长了三倍。
33……decreased year by year while……increased steadily.……逐年减少,而……逐步上升。
34.the situation reached a peak(a high point at)of[%].……的情况(局势)到达顶(高)点,为……百分点。
35.the figures/situat ion bottomed out in……数字(情况)在……达到底部。
36.the figures reached the bottom/a low point/hit a trough.数字(情况)达到底部(低谷)。
37.a is ……times as much/many as b.a是b的……倍。
38.a increased by……a增长了……39.a increased to……a增长到……40.high/low/great/small/ percentage.比低高(低)41.there is an upward trend in the number of…………数字呈上升趋势。
42.a considerable increase/decrease occurred from……to…………到……发生急剧上升。
43.from……to……the rate of decrease slow down.从……到……,下降速率减慢。