高考英语图表作文详解+万能必背模板
- 格式:pdf
- 大小:950.84 KB
- 文档页数:33
高考英语指导写作专题:图表说明文一,图表说明1,分类:数字表、函数关系图、曲线图(graph);表格(table);几何图形(figure);图形表、饼状图(pie chart);条状图、柱状图(bar chart);平面图、示意图、外形图(diagram)。
2,一般可分三个层次来写:按照题目要求描述图表反映的总情况,即概括大意。
对数字进行仔细的比较,抓住特点进行分析、归纳并找出产生变化的原因。
读图表后的想法、结论、评论或针对反映出的问题采取的解决措施。
二.表达方式:1,常用的描述句型The table/chart/diagram/graph shows that ...According to the table/chart/diagram/graph...As is shown in the table/chart/diagram/graph...As can be seen from the table/chart/diagram/graph/figures...We can see from the figures/statistics...It is clear/ apparent from the figures/statistics...2.图表中数据(data)的具体表达法数据(data)在某一个时间段固定不变:fixed in time在一系列的时间段中转变:changes over time增加:increase/raise/rise/...减少:decrease/grow down/drop/fall/decline稳定:remain stable3.描写变化的形容词及副词rapid/rapidly,dramatic/dramatically,significant/significantly,sharp/sharplysteep/steeply,steady/steadily,gradual/gradually,slow/slowly,slight/slightly三、写作模板As (is) shown/indicated by the figure/in the table/graph/pie chart/chart,_____ has been increased/decreased significantly/steadily from _____ to_____. From the sharp decline/rise in the chart,it goes without saying that_____.There are at least two reasons accounting for / contributing to ____. On the one hand, _____ On the other hand, _____. _____is due to the fact that_____. In addition,_____is responsible for_____. Maybe there are other reasons to show. But it is generally believed that the above mentioned reasons are commonlyconvincing/persuasive.As far as I am concerned,I hold the view that_____. I am sure my opinion is both sound and well-grounded.四,作文范例1,最近你校对中学生的消费情况进行了调查。
高考英语作文万能模板徐磊高考英语作文万能模板。
一、图表作文。
Recently, there has been a heated discussion about the topic of (图表主题). From the bar chart/line graph/pie chart, we can see that (具体数据描述). It is obvious that the data is of great significance and deserves our attention.The reasons behind this phenomenon can be various. On the one hand, (原因一). On the other hand, (原因二). Moreover, (原因三). All these factors contribute to the trend shown in the chart.In my opinion, we should take effective measures to deal with this issue. For one thing, (解决方法一). For another, (解决方法二). Only in this way can we turn the situation around and bring about positive changes.To sum up, (总结观点). As long as we make concerted efforts, I am sure that we can overcome the difficulties and achieve our goals.二、观点对比类作文。
Nowadays, with the rapid development of society, the issue of (观点对比主题) has aroused wide public concern. People's opinions on this issue vary from person to person.Some people hold the view that (观点一). They believe that (理由一). Moreover, (理由二). Therefore, they are in favor of the idea that (观点一的结论).However, others have a different perspective. They argue that (观点二). According to their point of view, (理由一). In addition, (理由二). As a result, they advocate the idea that (观点二的结论).As far as I am concerned, I am inclined to side with the former/latter opinion. On the one hand, (支持的理由一). On the other hand, (支持的理由二). Therefore, I firmly believe that (我的观点).In conclusion, (总结观点). Only by taking a rational and objective attitude can we come up with the best solution to the issue of (观点对比主题).三、议论文。
英语图表作文万能模板Introduction:The given chart presents data on [topic]. It provides a clear overview of [specific information]. In this essay, I will analyze the chart and discuss the key trends and patterns revealed by the data.Overview of the Chart:The chart illustrates [specific information]. It is divided into [number] categories, namely [category 1], [category 2], and [category 3]. The data is presented in the form of [type of chart], which allows for easy comparison and analysis.Main Trends and Patterns:1. Category 1:The first category, [category 1], shows [specific information]. It is evident from the chart that [trend 1]. This indicates that [explanation of trend 1]. Additionally, [trend 2] can be observed, suggesting [explanation of trend 2]. Overall, [category 1] experienced [overall trend].2. Category 2:Moving on to the second category, [category 2], it is noticeable that [specific information]. The chart reveals that [trend 1]. This implies that [explanation of trend 1]. Furthermore, [trend 2] is evident, indicating [explanationof trend 2]. In conclusion, [category 2] witnessed [overall trend].3. Category 3:Lastly, the third category, [category 3], exhibits [specific information]. The data illustrates that [trend 1]. This suggests that [explanation of trend 1]. Moreover, [trend 2] can be observed, which implies [explanation of trend 2]. Overall, [category 3] experienced [overall trend].Comparison and Contrast:When comparing the three categories, it is evident that [category 1] has the highest/lowest [specific information]. This indicates that [explanation]. On the other hand, [category 2] has the highest/lowest [specific information], suggesting [explanation]. Additionally, [category 3] falls in between the other two categories, indicating [explanation].Conclusion:In conclusion, the chart provides valuable insightsinto [topic]. It highlights the key trends and patterns in [category 1], [category 2], and [category 3]. The data clearly shows [specific information] in each category, allowing for a comprehensive understanding of the subject matter. Overall, the chart serves as a useful tool for analyzing and interpreting [topic].。
新高考英语图表类作文素材一、常用素材Recently a survey has been done to find out ... In this survey, ...were interviewed. Most of the surveyed answered...为了找出/发现……,最近做了一项调查。
在这项调查中,……接受了采访。
大多数受访者回答说……The results are as follows.结果如下。
As is apparently shown in the table above, ...正如上表所突显的那样,……As is shown in the table(chart)/As can be indicated in the table(chart)/According to the figures given in thetable(chart), ...如表(图)所示,……It can be seen from the table that.../From the table we can see that...从表中可看出…/从表中我们可知……As is shown in the(pie/bar)chart/graph/diagram/table ...如图(饼图/条形图)图表/图形/表格所示……As we can see from the table that...正如我们从表中看到的那样……As can be seen from the diagram, great changes have taken place in ...从图表中可以看出,……发生了巨大的变化……As is shown by the graph, we can easily find out that...如图所示,我们可以很容易找到发现……It is expected to increase ... times.预计将/有望增加……倍。
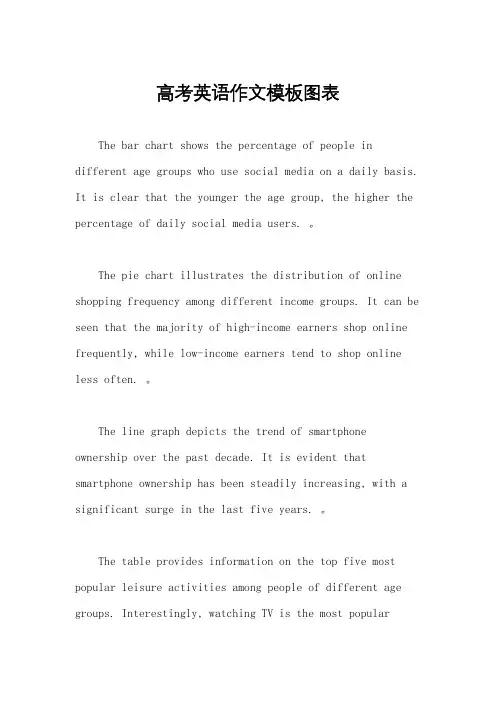
高考英语作文模板图表The bar chart shows the percentage of people in different age groups who use social media on a daily basis. It is clear that the younger the age group, the higher the percentage of daily social media users. 。
The pie chart illustrates the distribution of online shopping frequency among different income groups. It can be seen that the majority of high-income earners shop online frequently, while low-income earners tend to shop online less often. 。
The line graph depicts the trend of smartphone ownership over the past decade. It is evident that smartphone ownership has been steadily increasing, with a significant surge in the last five years. 。
The table provides information on the top five most popular leisure activities among people of different age groups. Interestingly, watching TV is the most popularleisure activity for all age groups, followed bysocializing with friends for the younger age groups, and reading for the older age groups.The chart presents the average daily time spent on various activities by people of different education levels. It is notable that higher education levels are associated with less time spent on activities such as watching TV and socializing, and more time spent on work and studying.In conclusion, the data presented in the charts and tables offer valuable insights into the behaviors and preferences of different demographic groups. It is clear that age, income, education, and technological advancements play significant roles in shaping people's habits and activities.。
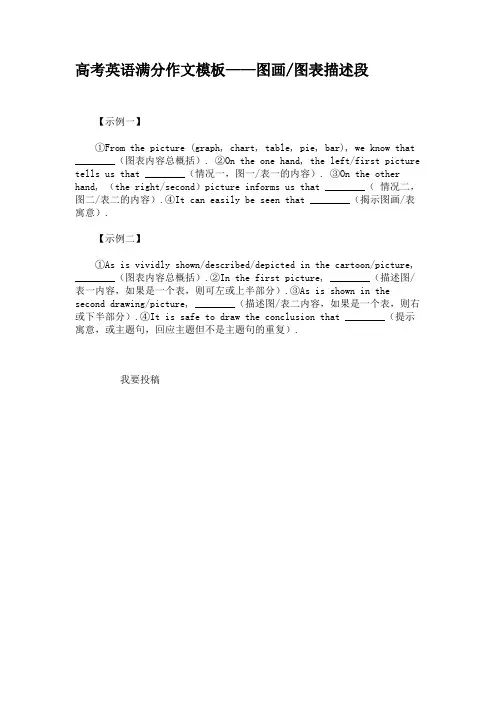
高考英语满分作文模板——图画/图表描述段
【示例一】
①From the picture (graph, chart, table, pie, bar), we know that ________(图表内容总概括). ②On the one hand, the left/first picture tells us that ________(情况一,图一/表一的内容). ③On the other hand, (the right/second)picture informs us that ________(情况二,图二/表二的内容).④It ca n easily be seen that ________(揭示图画/表寓意).
【示例二】
①As is vividly shown/described/depicted in the cartoon/picture, ________(图表内容总概括).②In the first picture, ________(描述图/表一内容,如果是一个表,则可左或上半部分).③As is shown in the second drawing/picture, ________(描述图/表二内容,如果是一个表,则右或下半部分).④It is safe to draw the conclusion that ________(提示寓意,或主题句,回应主题但不是主题句的重复).
我要投稿。
高考英语作文万能套用句子英语高考作文万能套用篇一1.图画作文模板As is vividly shown in the picture, .(描述图画内容)The picture/cartoon informs us of the phenomenon that .(图画反映的现象)These may/might be several factors contributing to/responsible for the phenomenon/problem. To start with, . Secondly, . What’s more, . Last but not least, .(说明原因) In my opinion, the government/the school/we should take measures to/something must be done to . Only in this way can the problem be really solved./ Only when everyone can do so will our world bee more and more beautiful.(解决问题的方法)2.图表作文模板As the bar chart shows, .(说明图表反映的问题)Several factors contribute to . And, . Furthermore, . All these result in .(分析问题产生的原因)However, is faced with some problems. With , the effect of is not only discouraging, but also challenging. So my principle is to pay your attention to , but not just to .(提出解决措施)3.利弊对比型议论文模板Nowadays, there is a widespread concern over .(引出话题或对象)In fact, there are both advantages and disadvantages in . Generally speaking, it is widely believed that there are several positive aspects as follows. Firstly, .(优点一)And secondly, .(优点二)Just as a popular saying goes, Every coin has two sides. is no exception, and in other words, it still has negative aspects. To begin with, .(缺点一)In addition, .(缺点二)To sum up, we should try to bring the advantages of into full play, and reduce the disadvantages to the minimum at the same time. In that case, we will definitely make a better use of .(总结)英语高考作文万能套用篇二高考英语作文常用句型一、Recently, the problem of … has aroused people#39;s concern.最近,……问题已引起人们的关注。
高考英语李华作文必背模板一、图表作文。
Recently, there has been a heated discussion about (话题). In this essay, I will analyze the (图表类型) and give my opinion on this issue.As is shown in the (图表), the (数据内容) has been on the rise/decline in recent years. For example, in 2015, the number of (数据) was (数字), while in 2020, it increased/decreased to (数字). This trend can also be seen in (其他相关数据).There are several reasons behind this trend. Firstly, (原因一). Secondly, (原因二). Finally, (原因三). All these factors have contributed to the change in (数据内容).In my opinion, this trend is both positive and negative. On the one hand, (观点一). On the other hand, (观点二). Therefore, it is important for us to (建议).In conclusion, the (图表类型) reflects the changes in (数据内容) over the years. It is essential for us to (解决建议) in order to (结局). Only in this way can we achieve (目标).二、观点对比型作文。
高考英语作文实用模板一.高考英语作文图表作文实用模板As is shown / indicated (显示)/ illustrated (阐述、展示)by the figure (数字)/percentage in the table (表格) / graph (图表)/picture /pie /chart (图表), 作文题目的议题__ has been on the rise ( 上升) / on the decrease (在下降)( has been going up / increasing / dropping /decreasing ) significantly (显著地) /steadily (稳定地)from 数据1 __ to数据2 . From the sharp / marked (显著的)decline (下降)/ rise in the chart, it goes without saying that 结论(作文论点).There are at least two good reasons accounting for(说明;解释)结论(作文论点. On the one hand, 原因之一. On the other hand,作文论点is due to the fact that 原因之二.In addition, 原因之三is responsible for 结论(作文论点). Maybe there are some other reasons .But it is generally believed that the above mentioned reasons are commonly convincing (令人信服的) .As far as I am concerned, I hold the point of view that 自己的观点和看法. I am sure my opinion is both sound and well-grounded (有充分根据的)二. 高考英语作文模板:现象说明文Recently ,what amazes (是惊讶) us most is________. There are many reasons explaining _____.The main reason is______. what is more, _________.thirdly_____.As a result_______. Considering all these,_____________.For one thing________,for anothe r____________.In Conclusion______.三. 高考英语话题作文模版:话题作文Nowadays, there are more and more (某种现象) in (某种场合). It is estimated(估计) that (相关数据). Why have there been so many (某种现象)? Maybe the reasons can be listed as follows. The first one is (原因一). Besides, (原因二). The third one is (原因三). To sum up, the main cause of (某种现象) is due to (最主要原因). It is high time that s omething were done upon it. For one thing, (解决办法一). besides, (解决办法二). All these measures will certainly reduce the number of (某种现象)热点话题作文范文A recent survey analyzed the change in number of film-goers and TV watchers in X city. As is shown by the graph, there has been a sharp decline in the number of film-goers during the period from 1992 to 2002, adding up to / amounting to (总计达到) 20,000 in 2002. On the other hand, the number of TV watchers has steadily increased in the last decade(十年), reaching 150,000 in 2002. Finally, it is interesting to note(注意)that there were as many film-goers as TV watchers in year 1998.In my opinion, there might be two reason accounting for (解释说明) the change. Firstly, Watching TV is not only a convenient but cheaper way of enter tainment. One needn’t pay forexpensive seats at the cinema. Secondly, TV makes it possible for people to keep track of (跟踪了解) current events (时世) and the latest developments in science and technology. As a consequence (因此) , most people prefer to stay at home, watching TV, rather than go out to the cinema, which is viewed as a waste of time and money.Personally, there are still a lot of people who enjoy watching films. They argue that the film is a fascinating(迷人的)form of art. Sitting comfortably in the cinema, one can appreciate the latest movies, which will usually be shown on TV far later on. Therefore, I believe that the number of film-goers will be on the rise (增长) in the future.其二:What is shown in the table above indicates (表明) that dramatic changes have taken place in the daily expenses in Xi’an from 1995 to 1999. The expenses on food have declined by 30% (下降) while those on clothing and recreation have increased respectively by 9% and 7%.(分别上升9%和7%)There are two factors(因数) accounting for(说明;解释) these changes. In the first place, the risen income resulting from (由于) economic growth plays a vital role in the less expense on food. In the second place, when food presents no worry to the average, people begin to focus more of their interest on handsome appearance and happy leisure(休闲) time. As a result of such a shift, spending on clothing and recreation increases year by year.From the analyses made above, with the further growth in economy and more changes in life style, the tendency (表明) indicated in the table will continue in the better direction. .创新预测:说明文/图画式/调查报告1. 根据所给表格,为某城市市报写一篇新闻报道,简要描述该市近年家用电脑用户增长情况,并分析其增长原因。
英语图表作文模板及范文(通用12篇)(经典版)编制人:__________________审核人:__________________审批人:__________________编制单位:__________________编制时间:____年____月____日序言下载提示:该文档是本店铺精心编制而成的,希望大家下载后,能够帮助大家解决实际问题。
文档下载后可定制修改,请根据实际需要进行调整和使用,谢谢!并且,本店铺为大家提供各种类型的经典范文,如工作总结、工作计划、合同协议、条据文书、策划方案、句子大全、作文大全、诗词歌赋、教案资料、其他范文等等,想了解不同范文格式和写法,敬请关注!Download tips: This document is carefully compiled by this editor. I hope that after you download it, it can help you solve practical problems. The document can be customized and modified after downloading, please adjust and use it according to actual needs, thank you!Moreover, our store provides various types of classic sample essays for everyone, such as work summaries, work plans, contract agreements, doctrinal documents, planning plans, complete sentences, complete compositions, poems, songs, teaching materials, and other sample essays. If you want to learn about different sample formats and writing methods, please stay tuned!英语图表作文模板及范文(通用12篇)英语图表作文模板及范文第1篇The table/chart diagram/graph shows (that)According to the table/chart diagram/graphAs (is)shown in the table/chart diagram/graphAs can be seen from the table/chart/diagram/graph/figures,figures/statistics shows (that)……It can be seen from the figures/statisticsWe can see from the figures/statisticsIt is clear from the figures/statisticsIt is apparent from the figures/statisticstable/chart/diagram/graph figures (that)……table/chart/diagram/graph shows/describes/illustrates图表类英语作文范文The past years have witnessed a mounting number of Chinese scholars returning from overseas.As is lively illustrated by the column chart, the number of returnees climbed from a mere thousand in 20XX to over thousand in 20XX, at an annual increase rate of around 50%.A multitude of factors may have led to the tendency revealed by the chart, but the following are the critical ones from my perspective.First and foremost, along with the development ofChinese economy and society, the number of Chinese studying abroad has been soaring in the past years, which has provided an eXpanding base for the number of returnees.In the second place, the government has enacted a series of preferential policies to attract overseas Chinese scholars back st but not least, the booming economy, science and technology in this country have generated more attative job opportunites for scholars returning from overseas.The waves of returnees will definitely contribute to this nation’s development, since they have brought back not only advanced science and technology but also pioneering concepts of education and management.With more scholars coming back from overseas, and with the concerted efforts of the whole nation,we have reasons to eXpect a faster rejuvenation of this country.更多培训课程:苏州个人提升英语更多学校信息:苏州虎丘区朗阁教育机构咨询电话:英语图表作文模板及范文第2篇Students tend to use computers more and more frequently nowadays.Reading this chart, we can find that the average number of hours a student spends on the computer per week has increased sharply.In 1990, it was less than 2 hours; and in 1995, it increased to almost 4 hours, and in 2000, the numbersoared to 20 hours.Obviously computers are becoming increasingly popular.There are several reasons for this change.First,computers facilitate us in more aspects of life.Also, the fast development of the Internet enlarges our demands for using computers.We can easily contact with friends in remote places through the Internet.Besides, the prices of computers are getting lower and lower,which enables more students to purchase them.However, there still eXist some problems, such as poor quality, out-of-date designs and so on.And how to balance the time between using computers and studying is also a serious problem.Anyhow, we will benefit a lot from computers as long as we use them properly.英语图表作文模板及范文第3篇As can be clearly seen from the graph/table/chart (As is shown in the table/figure), great changed have taken place in_______,The_________have/has skyrocketed/jumped from _____to _____.When it comes to the reasons for the changes,different people give different eXplanations.Here I shall just give a begin with, ______What’s more,___________, Last but not least, ________.While it is desirable that ___________,there are still some problems and difficulties for __________Firstly, __________,In addition, __________,In a word, __________.以上就是为大家整理的英语专四图表作文范文模板,希望能够对大家有所帮助。
高考英语作文万能卡模板一、图表作文。
As is shown in the chart/table, the percentage/proportion of A has decreased/ increased by X times compared with that in the previous year. Meanwhile, the figure for B has remained stable/gone up and down slightly. There are several possible reasons for this change. Firstly, the government has implemented a series of policies to promote A and restrain B. Secondly, people's awareness of A has been raised, leading to a growing interest in A. Thirdly, the economic recession has made a great impact on B, causing a decline in its proportion.In my opinion, this change is of great significance. On the one hand, it reflects the effectiveness of the government's policies. On the other hand, it indicates people's changing attitudes towards A and B. Therefore, we should take measures to consolidate this trend and make further progress.二、图画作文。
高中英语图表类作文万能模板英语能力是展现一个学生综合英语水平的重要方式,学生词汇量的多少、语法知识的掌握程度和运用水平、英语思维能力和文化积淀都能在写作中得以体现。
下面,是小编为你整理的高中英语图表类作文万能模板,希望对你有帮助!图表类作文万能模板1. As is shown by the graph,(in the table.)… (概述图表)正如曲线所示,最近54年来该国人口飞速增长。
As is shown by the graph,there has been a rapid increase in the population of the country in the past five years.2. It can be seen from the table that(shown graph/concluded figures/estimatedstatistics) … (得出结论)A. 从表中所给的统计数字可以看出,从1985年到1990年中国的人均收入迅速提高。
From the statistics given in the table it can be seen that the average personal income of the Chinese people increased (grew 、rose) rapidly from 1985 to 1990.B. 从曲线图可以得出结论,最近5年来中国人口的出生率已经大大下降。
It can be concluded from the graph that there has been a great decline in birth rates in China in the past five years.3. …amount to … (数量总计)(add up to/come to/sum up to)全部费用合计200美元。
高考英语作文万能模板(完整版)高考英语是一些考生最头痛的,尤其是作文部分。
不用担心,上学吧作文网小编为大家整理出来了高考英语作文万能模板。
对考生会有很大帮助。
赶紧一起来学习吧!一、图表作文As is shown by the figure/percentage in the table/picture,____ has been on rise/ decrease,significantly/dramatically rising/decreasing from ____ in _____ to _____ in _____. From the sharp rise/decline in the chart,it goes without saying that _____.There are at least two good reasons accounting for _____. In one hand,____.In the other hand,_____ is due to the fact that ______.In addition,______ is responsible for _____. Maybe there are some other reasons to show ______.But itis generally believed that the above mentioned reasons are commonly convincing.As far as I am concerned,I hold the point of view that _______. I am sure my opinion is both sound and well-grounded.二、书信作文模板Your addressMonth,Date,yearReceiver's addressDear …,I am extremely pleased to hear from you. And I would like to write a letter to tell you that_____.……I will greatly appreciate a response from you at your earliest convenience/I am looking f0rward to your replies at your earliest convenience.Best regards for your health and success.Sincerely yours,三、话题作文Nowadays,there are more and more __ _ in __ _. It is estimated that ___. Why have there been so many ____? Maybe the reasons can be listed as follows.The first one is ______. Besides,_____. The third one is _____. To sum up,the main cause of it is due to _____. It is high time that something weredone upon it. For one thing,_____. For another thing,_____. All these measures will certainly reduce the number of _____.四、对比观点作文(1) 要求论述两个对立的观点并给出自己的看法。
图表式作文It is obvious in the graphic/table that the rate/number/amount of Y has undergone dramatic changes. It has gone up/grown/fallen/dropped considerably in recent years (as X varies). At the point of X1, Y reaches its peak value of ...(多少).What is the reason for this change? Mainly there are ... (多少) reasons behind the situation reflected in the graphic/table. First of all, ...(第一个原因). More importantly, ...(第二个原因). Most important of all, ...(第三个原因).第一段:The table/graph/chart shows, as far as ______(is/are)concerned, _______________________.第二段:(第二段分为三种情况:1、一直上升;2、一直下降;3、一部分上升,一部分下降。
下面针对这三种情况进行结构模仿)。
1、(以1978年到1998年城镇乡村收入的稳步较长图为例)。
a.一直上升According to the figures show in the graph, we can see that________, had been increasing at a steady rate from the year of 1978 to 1998. In addition, during the period, ____________had raise from 349.9 Yuan to 5425 Yuan, morethan 5 times .Meanwhile, _______had also grown from 133.6 Yuan to 2100 Yuan.b. 一直下降According to the figures show in the graph, we can see that___________, had been decreasing at e steady rate from the year of 1978 to 1998. In addition, during the periond,____________had reduced from 349.9 Yuan to 5425 Yuan, more than 5 times .Meanwhile ,_______had also gone down 133.6 Yuan to 2100 Yuan.2、[以从1995年到1999年西安人的日常生活支出(食物、服装和娱乐)的变化为例]c. 一部分上升,一部分下降:According to the figures in the graph, we can see that__________had been increasing by 9% and 7%, respectively from the year of 1995 to1999. However,___________(the expenses on food)had been decline by30% ,during the same period. The statistics of rise and fall seem to exist in isolation but closely to one another. 第三段:There are several reasons for that phenomenon. On the hand, _____;On the other hand,_________,___________.注:横线部分为自己需填充的内容,这只是整篇文章的格式,红色横线部分视考题而定,可填充的内容经济类/发展类/旅游类/文化交流类:1. The policy of reformation and opening spreader widely in China should be taken into account firstly, when considering the reason for the steady increase of the citizen's income.2. The people of China has the spirit of working hard in order to improve their living.3. China's rapid economic development lays the base.4. In the past twenty five years, remarkable changes have taken place in China's tourism rank in the world.5. The economy of China has developed so fast in twenty years that China now becomes more and more important in the world.6. I'm confident that with the development of China the numbers of visitors and the foreign exchange earrings will certainly continues to increase in the future.7. With the rapid development of technology and the global economy ,the world is becoming international, cultural exchanges are becoming more and more frequent ,which is inevitably improving our mutual understanding and friendship with other countries.食品类:1、In order to live a healthy long life, we have to restrict our calorie intake eating the food with less fat.2、We should make our diet more nutritional and balance the calorie intake to enjoy a healthy life.3、To improve the bad situation, people should eat calcium-enriched food, such as fish,milk,beancurd and so on . 娱乐类/体育类:如看书/看电视1、We should make a balance between them to benefit themselves.2、The age in which we live now is an information one.3、People should go to the gym and take part in some sports, such as basketball, volleyball, swimming and so .All the exercise help people keep healthy.友谊类/文化交流类:1、People all over the world love and respect each other. The best way to show our love is to help others when they are in difficulties.2、Everyone should be encouraged required to try to be self-reliant.3、When one in trouble, others should help him.PS:经典句子:1、Scientists have warned that unless effective measures are taken, the problem of pollution will eventually get out of hand.2、For citizens ,they are supposed to conform to rules and regulations of the traffic.3、And the government should educate people in this respect ,which will draw people's attention of the serious problem.4、For drivers their speed should be restricted . Otherwise, they should be punished severely.5、It is time the anchorites concerned took proper steps the traffic problem.6、As long as each of us takes actions. I deeply believe the problem will be well resolved to an extend作文中可用的谚语或句子:As a saying goes:俗话说1、A good beginning is half done. 良好的开端是成功的一半。
高考英语作文万能模板:图表类作文下面是整理的“高考英语作文万能模板:图表类作文”,欢迎阅读参考,更多有关内容请继续关注本网站高考栏目。
高考英语作文万能模板:图表类作文图表作文写作模板:The chart gives us an overall picture of the 图表主题. The first thing we notice is that 图表最大特点 . This means that as (进一步说明).We can see from the statistics given that 图表细节一 . After 动词-ing 细节一中的第一个变化, the动词-ed+幅度+时间(紧跟着的变化) . The figures also tell us that图表细节二 . Inthe column, we can see that accounts for (进一步描述).Judging from these figures, we can draw the conclusion that (结论). The reason for this, as far as I am concerned is that (给出原因). / It is high time that we (发出倡议).图画类写作模板:1.开头Look at this picture./The picture shows that.../From this picture, we can see.../As is shown in the picture.../As is seen in the picture...2.衔接句As we all know, .../As is known to all,.../It is well known that.../In my opinion,.../As far as I am concerned,.../This sight reminds me of something in my daily life.3.结尾句In conclusion.../In brief.../On the whole.../In short.../In a word.../Generally speaking.../As has been stated...。
高中英语写作万能模板1、图表作文万能模板类型:柱状图、折线图、扇形图、表格考情分析:描述表格+分析原因(已知或未知),开头给定或者不给,若给定开头,则根据开头续写剩下的内容,若不给开头,利用本文总结的万能开头。
第一段:描述题目内容There is a pie chart/table/diagram/graph showing 题目描述的主题,as can be seen, during the whole period, all the 描述的对象displayed/showed some kinds of changes at different levels.第二段:描述图形的变化For 描述的图表in 图表所处的时间,compared with the others, 最大的项目showed significant advantage and owned 最大的数字,on the other extreme, 最小的项目only showed 最小的数字.As for the others, they distributed between these two poles.第三段:解释原因On the one hand/Above all/Initially/First of all/Beforehand, 某一个原因is a basic reason/root/ultimate cause/key part of 图表反映的现象,the cause/principle/explanation is that 解释现象的原因1;On the other hand/Besides/Adittionally/Furthermore, the appearance/emergence/occurence of 解释现象的原因 2 should be ascribed/attibutd to 图表反映的现象,for explainations/to understand why/behind it, a truth/reality should be noticed /recognized that 深入解释为什么原因2导致图表反映的现象第四段:(万能结尾)最大值无变化:In conclusion/All in all/Altogether, 最大值描述的对象has remained the obvious/advantaged position over the whole period.最大值有变化:In conclusion/All in all/Altogether, as shown in the graph, 终点最大值描述的对象has replaced起点最大值描述的对象and become 最占优势的项目during the whole period2、练一练例:根据所给表格,为某城市时报写一篇新闻报道,简要描述该市今年家用电脑用户增长情况,并分析其增长原因。