The SQL Trace (ST05)
- 格式:docx
- 大小:215.33 KB
- 文档页数:14

ABAP ST05用法1. 简介ABAP(Advanced Business Application Programming)是一种在SAP系统中开发企业应用程序的编程语言。
ST05是ABAP开发人员常用的性能分析工具之一,用于诊断和调优ABAP程序的性能问题。
本文将详细介绍ST05的使用方法和相关功能。
2. ST05概述ST05是一个SAP事务码,用于分析和调整ABAP程序的性能。
它提供了多种功能,包括SQL Trace、Buffer Trace、Enqueue Trace、Performance Trace等。
通过使用ST05,开发人员可以找出程序中存在的性能瓶颈,并进行相应的优化。
3. ST05使用步骤下面是使用ST05进行性能分析和调优的基本步骤:步骤1:启动ST05事务码在SAP Easy Access界面上输入ST05并按Enter键,即可启动ST05事务码。
步骤2:选择要分析的程序在ST05界面上,点击“Single Transaction”按钮,在弹出的对话框中输入要分析的程序名称,并点击“Execute”按钮。
步骤3:启动SQL Trace在ST05界面上,点击“SQL Trace”按钮,并选择合适的选项设置(如追踪模式、追踪级别等),然后点击“Activate”按钮。
步骤4:执行程序在ST05界面上,点击“Execute”按钮,执行程序并进行性能分析。
步骤5:停止SQL Trace在ST05界面上,点击“Deactivate”按钮,停止SQL Trace。
步骤6:分析性能结果在ST05界面上,点击“Analysis”按钮,查看性能结果。
可以通过查看SQL语句的执行时间、缓冲区的使用情况等来评估程序的性能状况。
步骤7:优化程序根据性能分析结果,对程序进行相应的优化。
可以尝试优化SQL语句、调整缓冲区设置等方式来提升程序的性能。
4. ST05功能详解SQL Trace(SQL追踪)SQL Trace是ST05最常用的功能之一,用于追踪和分析ABAP程序中执行的SQL语句。
一、表增强SAP 提供了两种方法为表和结构增加字段全部在se11中选择表•追加结构---追加结构只是向表内增加字段而不是修改结构,另外追加结构只能属于一个表。
•定制包含(CI 包含)在上面的“编辑”选择“包括”再选择“插入”组件•文本元素增强(CMOD-转到-全局增强-数据元素)使用追加结构时注意下面几点:✓不能为池表或簇表创建追加结构。
✓如果表包含长字段(例如数据类型LCHR 或LRAW),就不能为表扩展追加结构。
这是因为这种类型的长字段必须是相关表的最后字段。
从追加结构中的字段不能被添加到它们后面。
✓如果使用追加结构来扩展一个SAP 表,追加结构中的字段名必须在客户命名空间中,就是用YY 或ZZ 开头。
这可以避免SAP 将来插入新字段时发生命名冲突。
二、事务变式、屏幕变式使用事务码FB50选中‘项目的屏幕变式’,(在菜单栏“编辑”下面选择“屏幕变式”----再到“创建屏幕变式”)点击右键选择屏幕变式->创建屏幕变式(也可以直接使用t-code:SHD0(零)进入屏幕变式创建)在事务代码中输入需要定制屏幕变式的T-code:FB50Screen variant:属于以Z开头的自定义屏幕变式的名称(必须以Z开头)Program:输入要用到的程序SAPLFSKBScreen:输入要定义的屏幕编号100然后点击创建根据需要进行凭证字段的选择:只输出:表示只读不能修改不可见:表示隐藏强制:表示必须输入编写屏幕变式的文本说明:如图所示‘省公司的屏幕变式’选择完成后点击‘Exit and Save’点击,然后在小对话框中点击‘本地对象’,则屏蔽变式建立并保存成功回到FB50凭证输入的界面,选中‘项目的屏幕变式’,点击右键选择屏幕变式->添加屏幕变式输入刚才建立的变式名称,点击‘继续’。
刚才创建的屏蔽变式就会加入到变式的树形列表中,双击该变式就可使用删除屏幕变式:对于不使用的屏幕变式可以选中该变式后点击右键,选择屏幕变式->搬移屏幕变式三、程序增强(程序、屏幕)1、用户出口---user exit,通过修改助手修改标准程序,修改时必须有相应修改key,实际中使用不是太多修改助手(修正助手会自动生成注释行框架来描述操作。
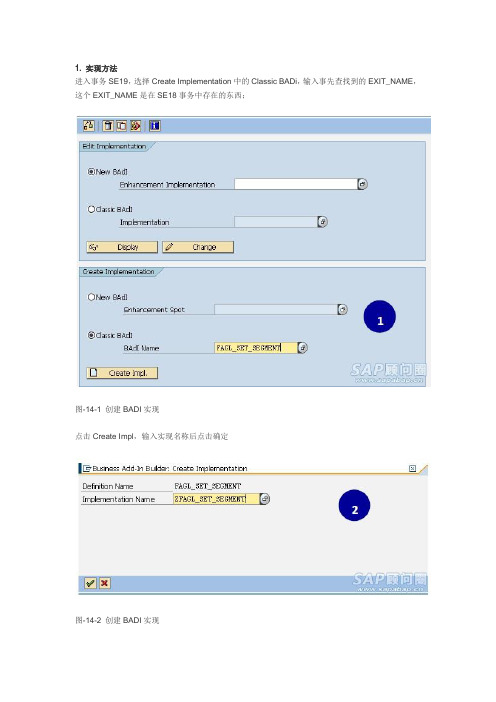
1. 实现方法进入事务SE19,选择Create Implementation中的Classic BADi,输入事先查找到的EXIT_NAME,这个EXIT_NAME是在SE18事务中存在的东西;图-14-1 创建BADI实现点击Create Impl,输入实现名称后点击确定图-14-2 创建BADI实现图-14-3 创建BADI实现点击保存,激活(如果是ECC6.0及以上版本,则还需要指定对应的Enhancement Spot,才可以完全创建成功,这个可能是为了保证NEW BADI的向上兼容而采用的一种方法)。
图-14-4 创建BADI实现双击进入方法CHANGE_SEGMENT_PSEGMENT,即可在里面实现功能;图-14-5 创建BADI实现下面再运行F-02,执行程序,即可进入此段代码。
图-14-6 创建BADI实现2. 查找方法. 方法一:用事务SE24打开类CL_EXITHANDLER,因为在ABAP中的BADI执行前都要执行此类的一个GET_INSTANCE方法来判断BADI定义是否已经实现,如果已实现并处于激活状态,则BADI实现中的客户代码将会被执行图-15-1 查找BADI双击GET_INSTANCE方法图-15-2 查找BADI在CASE SY-SUBRC处设置断点图-15-3 查找BADI运行业务事务,如ME21N,在断点处查看EXIT_NAME,就是你所要找的BADI定义。
然后在表SXC_EXIT中就可以查找该定义是否已实现,若已实现,可以看到实现名称。
图-15-4 查找BADI. 方法二:通过st05跟踪,badi对应的数据表为SXS_INTER, SXC_EXIT, SXC_CLASS 和SXC_ATTR,而这些表都是通过视图V_EXT_IMP 和V_EXT_ACT来查询的。
1、打开运行事务码: ST05 选择“table buffer trace”而不是常用的"SQL trace"2、activate trace(开始跟踪)3、运行事务码:me21n4、创建一个采购订单,保存5、deactivate trace(结束跟踪)6、点击display trace,在出来的选择条件中:objects中输入:V_EXT_IMP和V_EXT_ACT;在operations中输入“OPEN”图-16-1 ST05跟踪法查找BADI7、查询通过查询的结果可以看出,视图V_EXT_IMP的BADI的接口类名字都是以IF_EX_开头的,其中IF_EX_之后的就是对应BADI接口的定义。


SAP T-CODEAbap:se11:数据字典se16:查看数据库表内容se16n: 查看修改数据se18: 定义badise19: 实现badise37: 创建函数se38:创建程序,se80:不仅创建程序,还创建其它库对象。
se09: 释放请求se93: 创建Tcodese51: screen painter.se41: 制作工具按钮使用ABAP菜单编辑器. stms:传输程序sm04:user listsm19: 跟踪用户sm20: 查看用户的详细动作。
sm36: 定义后台作业sm37: 查看后台作业spro: 查看后台定制表ST05:SQL TRACE TOOL.al08: 当前的活动用户&sap_edit: 激活sap编辑功能。
1.AL11,服务器上的文件2.CG3Y 下载文件3.CG3Z 上传文件MM:MM01 :创建物料MM02 :修改物料MM03 :查看物料ME21N :创建采购订单ME22N :修改采购订单ME23N :查看采购订单ME51N :创建采购申请ME52N :修改采购申请ME53N :查看采购申请ME11: 创建采购信息记录ME12: 修改采购信息记录ME13: 显示采购信息记录VK01 :创建供货商VK02 :修改供货商VK03 :查看供货商SD:VA01 创建销售订单VA02 修改销售订单VA03 查看销售订单VF01 创建销售发票VF02 修改销售发票VF03 查看销售发票VL01N 创建交货单VL02N 修改交货单VL03N 查看交货单FI:FB03 显示财务凭证FD03:供应商主数据FI03:银行主数据FS10N 总账科目余额查询FB03 凭证查询凭证查询FBL3N 总账科目行项目总账科目明细项目查询FBL1N 供应商行项目供应商明细查询FS10N 总账科目余额查询总账科目余额查询FK10N 供应商余额查询供应商余额查询FD10N 客户余额查询客户余额查询Basis:权限管理:su01:用户权限管理pfcg:管理角色rsecadmin: 分配具体对象权限sm04:查看登录系统的用户及Tcodesu24: 维护事务权限对象的分配BW:rsa1: BW控制台rsa2: 查看数据源(提取方法,提取器,提取结构)rsa3: 查看提取数据的情况rsa5: 安装,激活数据源(RSA5只能看到D(Delivered)状态的DataSource)rsa6: 增强数据源,RSA6能看到A(Activated)状态的DataSource 以及自定义的数据源(以Y和Z开头)rsa7: 查看增量队列lbwq:查看抽取队列rspc:处理连rskc: 维护允许的特殊字符rsrt: query monitorst13DELTA:LBWQ: 查看抽取队列数据LBWE:后勤数据提取:定制主控室(LO Data Extraction: Customizing Cockpit)定制提取结构,做数据源的扩展。
查找BADI的方法收藏
SAP 三代增强badi的查找方法
对于根据事务代码查找对应的BADI,网上介绍的方法很多,但总结下来无非就两种方法,在此把它记录下来,方便以后自己查阅了。
(1)通过SE24,输入CL_EXITHANDLER,然后在方法GET_INSTANCE中设置断点,然后运行事务代码判断exit_name的值,操作过程如下:
输入se24,然后输入cl_exithandler
进去双击get_instance设置断点查看exit_name的值:
(2)通过st05跟踪,badi对应的数据表为SXS_INTER, SXC_EXIT, SXC_CLASS 和SXC_ATTR,而这些表都是通过视图V_EXT_IMP 和V_EXT_ACT来查询的。
1、打开运行事务码: ST05 选择“table buffer trace”而不是常用的"SQL trace"
2、activate trace(开始跟踪)
3、运行事务码:me21n
4、创建一个采购订单,保存
5、deactivate trace(结束跟踪)
6、点击display trace,在出来的选择条件中:objects中输入:V_EXT_IMP和V _EXT_ACT;在operations中输入“OPEN”
7、查询
通过查询的结果可以看出,视图V_EXT_IMP的BADI的接口类名字都是以IF_EX_开头的,其中IF_EX_之后的就是对应BADI接口的定义。
SAP T-CODEAbap:se11:数据字典se16:查看数据库表内容se16n: 查看修改数据se18: 定义badise19: 实现badise37: 创建函数se38:创建程序,se80:不仅创建程序,还创建其它库对象。
se09: 释放请求se93: 创建Tcodese51: screen painter.se41: 制作工具按钮使用ABAP菜单编辑器. stms:传输程序sm04:user listsm19: 跟踪用户sm20: 查看用户的详细动作。
sm36: 定义后台作业sm37: 查看后台作业spro: 查看后台定制表ST05:SQL TRACE TOOL.al08: 当前的活动用户&sap_edit: 激活sap编辑功能。
1.AL11,服务器上的文件2.CG3Y 下载文件3.CG3Z 上传文件MM:MM01 :创建物料MM02 :修改物料MM03 :查看物料ME21N :创建采购订单ME22N :修改采购订单ME23N :查看采购订单ME51N :创建采购申请ME52N :修改采购申请ME53N :查看采购申请ME11: 创建采购信息记录ME12: 修改采购信息记录ME13: 显示采购信息记录VK01 :创建供货商VK02 :修改供货商VK03 :查看供货商SD:VA01 创建销售订单VA02 修改销售订单VA03 查看销售订单VF01 创建销售发票VF02 修改销售发票VF03 查看销售发票VL01N 创建交货单VL02N 修改交货单VL03N 查看交货单FI:FB03 显示财务凭证FD03:供应商主数据FI03:银行主数据FS10N 总账科目余额查询FB03 凭证查询凭证查询FBL3N 总账科目行项目总账科目明细项目查询FBL1N 供应商行项目供应商明细查询FS10N 总账科目余额查询总账科目余额查询FK10N 供应商余额查询供应商余额查询FD10N 客户余额查询客户余额查询Basis:权限管理:su01:用户权限管理pfcg:管理角色rsecadmin: 分配具体对象权限sm04:查看登录系统的用户及Tcodesu24: 维护事务权限对象的分配BW:rsa1: BW控制台rsa2: 查看数据源(提取方法,提取器,提取结构)rsa3: 查看提取数据的情况rsa5: 安装,激活数据源(RSA5只能看到D(Delivered)状态的DataSource)rsa6: 增强数据源,RSA6能看到A(Activated)状态的DataSource 以及自定义的数据源(以Y和Z开头)rsa7: 查看增量队列lbwq:查看抽取队列rspc:处理连rskc: 维护允许的特殊字符rsrt: query monitorst13DELTA:LBWQ: 查看抽取队列数据LBWE:后勤数据提取:定制主控室(LO Data Extraction: Customizing Cockpit)定制提取结构,做数据源的扩展。
BADI查找⽅法⽅法⼀:1. Go to the TCode SE24 and enter CL_EXITHANDLER as object type.2. In 'Display' mode, go to 'Methods' tab.3. Double click the method 'Get Instance' to display it source code.4. Set a breakpoint on 'CALL METHOD cl_exithandler=>get_class_name_by_interface'.5. Then run your transaction.6. The screen will stop at this method.7. Check the value of parameter 'EXIT_NAME'. It will show you the BADI for that transaction.if found helpfull do reward.⽅法⼆:BADI作为的第三代⽤户出⼝,他的应⽤也越来越⼴泛,但如何找到合适的badi是许多的困惑。
我这⾥就介绍⼀下我个⼈的应⽤的经验,供⼤家参考。
1、badi对象的信息存储在SXS_INTER, SXC_EXIT, SXC_CLASS 和SXC_ATTR 这四个表中(参见SECE包);2、sap程序都会调⽤cl_exithandler=>get_instance来判断对象是否存在,并返回实例;其实get_instance就是对上述⼏个表和他们的视图(V_EXT_IMP 和 V_EXT_ACT)进⾏查询和搜索。
------个⼈感觉SAP操作BADI_SPOT的时候会有BADI出现3、基于这个机理,我查⽤ST05来监控⼀个TCODE来跟踪,然后选择查找有关上述⼏个表和视图的操作,就可获得相关BADI。
The SQL Trace (ST05) –Quick and Easy 分类:SAP 非开发2010-04-14 10:16 383人阅读评论(0) 收藏举报原文地址:/irj/scn/weblogs?blog=/pub/wlg/7205 The SQL Trace, which is part of the Performance Trace (transaction ST05), is the most important tool to test the performance of the database. Unfortunately, information on how to use the SQL Trace and especially how to interpret its results is not part of the standard ABAP courses. This weblog tries to give you a quick introduction to the SQL Trace. It shows you how to execute a trace, which is very straightforward. And it tells how you can get a very condensed overview of the results--the SQL statements summary--a feature that many are not so familiar with. The usefulness of this list becomes obvious when the results are interpreted. A short discussion of the ‘database explain’ concludes this introduction to the SQL Trace.1. Using the SQL TraceUsing the SQL trace is very straightforward:1. Call the SQL trace in a second mode2. Make sure that your test program was executed atleast once, or even better, a few times, to fill the buffers and caches. Only a repeated execution providesreproducible trace results. Initial costs are neglected in our examination3. Start the trace4. Execute your test program in the first mode5. Switch off the trace. Note, that only one SQL tracecan be active on an application server, so always switch your trace off immediately after your arefinished.6. Display the trace results7. Interpretation of the resultsNote, the trace can also be switched on for a different user.=> In this section we showed how the SQL trace is executed. The execution is very straightforward and can be performed without any prior knowledge. The interpretation of the results, however, requires some experience. More on the interpretation will come in the next section.2. Trace Results – The Extended Trace ListWhen the trace result is displayed the extended trace list comes up. This list shows all executed statements in the order of execution (as extended list it includes also the time stamp). One execution of a statement can result in several lines, one REOPEN and one or several FETCHES. Note that you also have PREPARE and OPEN lines, but you should not see them, because you only need to analyze traces of repeated executions. So, if you see a PREPARE line, then it is better to repeat the measurement, because an initial execution has also other effects, which make an analysis difficult.If you want to take the quick and easy approach, the extended trace list is much too detailed. To get a good overview you want to see all executions of the same statement aggregated into one line. Such a list is available, and can be called b y the menu ‘Trace List -> Summary by SQL Statements’.=> The extended trace list is the default result of the SQL Trace. It shows a lot of and very detailed information. For an overview it is much more convenient to view an aggregated list of the trace results. This is the Summarized SQL Statements explained in the next section.3. Trace Results - Summarized SQL StatementsThis list contains all the information we need for most performance tuning tasks.The keys of the list are ‘Obj Name’ (col. 12), i.e. table name, and ‘SQL Statement’ (col. 13). When using the summarized list, keep the following points in mind:∙Several coding positions can relate to the samestatement:∙The statement shown can differ from its Open SQL formulation in ABAP.∙The displayed length of the field ‘Statement’ isrestricted, but sometimes the displayed text isidentical.∙In this case, the statements differ in part that is not displayed.The important measured values are ‘Executions’ (col. 1), ‘Duration’ (col. 3) an d ‘Records’ (col. 4). They tell you how often a statement was executed, how much time it needed in total and how many records were selected or changed. For these three columns also the totals are interesting; they are displayed in the last line. The other totals are actually averages, which make them not that interesting.Three columns are direct problem indicators. These are ‘Identical’ (col. 2), ‘BfTp’ (col. 10), i.e. buffer type, and ‘MinTime/R.’ (col. 8), the minimal time record.Additional, but less important information is given in the columns, ‘Time/exec’ (col. 5), ‘Rec/exec’ (col. 6), ‘AvgTime/R.’ (col. 7),‘Length’ (col. 9) and ‘TabType’ (col. 11).For each line four functions are possible:∙The magnifying glass shows the statement details;these are the actual values that were used in theexecution. In the summary the values of the lastexecution are displayed as an example.∙The ‘DDIC information’ provides some usefulinformation about the table and has links to furthertable details and technical settings.∙The ‘Explain’ shows how the statement was processed by the database, particularly which index was used.More information about ‘Explain’ can be found in thelast section.∙The link to the source code shows where the statement comes from and how it looks in OPEN SQL.=> The Statement summary, which was introduced here, will turn out to be a powerful tool for the performance analysis. It contains all information we need in a very condensedform. The next section explains what checks should be done.4. Checks on the SQL StatementsFor each line the following 5 columns should be checked, as tuning potential can be deduced from the information they contain. Select statements and changing database statements, i.e. inserts, deletes and updates, can behave differently, therefore also the conclusions are different.For select statements please check the following:∙Entry in ‘BfTy’ = Why is the buffer not used?The tables which are buffered, i.e. with entries ‘ful’’ forfully buffered, ‘gen’ for buffered by generic region and‘sgl’ for sing le record buffer, should not appear in theSQL Trace, because they should use the table buffer.Therefore, you must check why the buffer was notused. Reasons are that the statement bypasses thebuffer or that the table was in the buffer during theexecution of the program. For the tables that are notbuffered, but could be buffered, i.e. with entries startingwith ‘de’ for deactivated (‘deful’, ‘degen’, ‘desgl’or ;deact’) or the entry ‘cust’ for customizing table,check whether the buffering could not be switched on.∙Entry in ‘Identical’ = Superfluous identicalexecutionsThe column shows the identical overhead as apercentage. Identical means that not only thestatement, but also the values are identical. Overhead expresses that from 2 identical executions one isnecessary, and the other is superfluous and could be saved.∙Entry in ‘MinTime/R’ larger than 10.000 = Slow processing of statementAn index-supported read from the database shouldneed around 1.000 micro-seconds or even less perrecord. A value of 10.000 micro-seconds or even more is a good indication that there is problem with theexecution of that statement. Such statements should be analyzed in detail using the database explain, which is explained in the last section.∙Entry in ‘Records’ equal zero = No record found Although this problem is usually completely ignored, ‘no record found’ should be examined. First, checkwhether the table should actually contain the recordand whether the customizing and set-up of the system is not correct. Sometimes ‘No record found’ isexpected and used to determine program logic or tocheck whether keys are still available, etc. In thesecases only a few calls should be necessary, andidentical executions should absolutely not appear.∙High entries in ‘Executions’ or ‘Records’ = Really necessary?High numbers should be checked. Especially in thecase of records, a high number here can mean that toomany records are read.For changing statements, errors are fortunately much rarer. However, if they occur then they are often more serious:∙Entry in ‘BfTy’ = Why is a buffered table changed?If a changing statement is executed on a bufferedstatement, then it is questionable whether this table isreally suitable for buffering. In the case of bufferedtables, i.e entries ‘ful’, ‘gen’ or ’sgl’’, it might be better toswitch off the buffering. In the case of bufferable tables,the deactivation seems to be correct.∙Entry in ‘Identical’ = Identical changes must beavoi dedIdentical executions of changing statements shoulddefinitely be avoided.∙Entry in ‘MinTime/R’ larger than 20.000 = Changes can take longerSame argument as above just the limit is higher forchanging statements.∙Entry in ‘Records’ equal zero = A change with no effectChanges should also have an effect on the database,so this is usually a real error which should be checked.However, the ABAP modify statement is realized onthe database as an update followed by an insert if therecord was not found. In this case one statement out ofthe group should have an effect.∙High entries in ‘Executions’ and ‘Records’ = Really necessary?Same problems as discussed above, but in this caseeven more serious.=> In this section we explained detailed checks on the statements of the SQL Statement Summary. The checks are slightly different for selecting and changing statements. They address questions such as why a statement does not use the table buffer, why statements are executed identically, whether the processing is slow, why a statement was executed but norecord was selected or changed, and whether a statement is executed too often or selects too many records.5. Understanding the Database ExplainThe ‘database explain’ should show the SQL statement as it goes to the database, and the execution plan on the database. This view has a different layout for the different database platforms supported by SAP, and it can become quite complicated if the statement is complicated.In this section we show as an example the ‘Explain’ for a rather simple index-supported table access, which is one of the most common table accesses:1. The database starts with step 1, index unique scanDD02L~0, where the three fields of thewhere-condition are used to find a record on the indexDD02L~0 (‘~0’ denotes always the primary key).2. In step 2, table access by index rowed DD02L, therowid is taken from the index to access the record inthe table directly.Some databases display the execution plan in a graphical layout, where a double-click on the table gives additional information, as shown on the right side. There the date of the last statistics update and the number of records in the table are displayed. Also all indexes are listed with their fields and the number of distinct values for each field, with this information it is possible to calculate the selectivity of an index.From this example you should understand the principle of the‘Explain’, so that you can also understand more complicated execution plans. Some database platforms do not use graphical layouts and are a bit harder to read, but still show all the relevant information.=> In this last section we showed an example of a database explain, which is the only way to find out whether a statementuses an index, and if so, which index. Especially in the case of a join, it is the proper index support that determines whether a statement needs fractions of seconds or even minutes to be finished.Please try the SQL Trace by yourself. If there are any questions or problems, your feedback is always welcome!。