中国移动客户服务中心全台kpi分析(呼叫中心)
- 格式:ppt
- 大小:812.50 KB
- 文档页数:7

呼叫中心各项指标(KPI)目前呼叫中心越来越趋向精细化、数字化管理,KPI管理成为一种有效的管理手段。
通常,呼叫中心的运营管理者们通过分解运营目标制订各种KPI指标,通过KPI指标来引导座席代表行为,从而达到完成项目运营目标。
大部分呼叫中心采用呼叫中心集成系统和座席操作系统,另外还有强大的运营管理系统进行数据支持,所以为实行数字化管理奠定了良好的基础。
KPI 的英文名字是Key Performance Indications,即指关键绩效指标,是通过对组织内部某一流程的输入端、输出端的关键参数进行设置、取样、计算、分析,衡量流程绩效的一种目标式量化管理指标,是把企业的战略目标分解为可运作的远景目标的工具,是企业绩效管理系统的基础。
KPI符合一个重要的管理原理--"二八原则"。
在一个企业的价值创造过程中,存在着"20/80"的规律,即20%的骨干人员创造企业80%的价值;而且在每一位员工身上"二八原理"同样适用,即80%的工作任务是由20%的关键行为完成的。
因此,必须抓住20%的关键行为,对之进行分析和衡量,这样就能抓住业绩评价的重心。
每个呼叫中心都有自己的KPI指标,指标的数量各不相同,有的多到一百多个,有的少到只有三五个。
这里介绍常用的20个KPI指标。
这些KPI指标源于美国普度大学消费品质量监测中心琼·安顿教授提出了23个与客户服务中心运营相关的数字化规范指标,根据目前行业软硬件的发展及所在公司的经验,进行重新的修改。
其中数据标准部分,一部分来源于行业标准,一部门来源于某些呼叫中心的历史数据。
但是,无论怎样制定这些标准,KPI值应有挑战性,即应略高于现有水平或至少不低于现有水平,要对完成上一级目标有所贡献并成为完成上一级目标的主要推动力。
一、接通率定义:对于具有IVR和ACD的呼入式呼叫中心,接通率是指IVR终级服务单元的接通量与人工座席的接通量之和与进入呼叫中心的呼叫总量之比。

呼叫中心的人员绩效考核指标有哪些呼叫中心作为企业与客户沟通的重要桥梁,其人员的工作表现直接影响着客户满意度和企业形象。
因此,建立科学合理的绩效考核指标体系对于提升呼叫中心的服务质量和运营效率至关重要。
下面我们来详细探讨一下呼叫中心的人员绩效考核指标都有哪些。
一、服务质量指标1、客户满意度这是衡量呼叫中心服务质量的关键指标。
通过客户在通话结束后的满意度调查,了解客户对服务的评价。
包括对客服人员的态度、解决问题的能力、沟通效果等方面的满意度。
2、一次解决率指客户的问题在首次呼叫中得到完全解决的比例。
较高的一次解决率能够减少客户的重复来电,提高客户体验,同时也降低了运营成本。
3、服务水平通常以在规定时间内(如 20 秒内)接听的电话数量占总来电数量的百分比来衡量。
例如,服务水平目标为 80/20,即 80%的来电在 20秒内被接听。
4、平均通话时长包括平均处理时长和平均通话时长。
平均处理时长是指从接听电话到问题解决的总时间;平均通话时长则是指单纯与客户交流的时间。
过长或过短的通话时长都可能反映出服务质量的问题。
5、投诉率计算一定时期内客户投诉的数量占总来电数量的比例。
投诉率越低,表明服务质量越高。
二、工作效率指标1、接通率即成功接听的电话数量与总来电数量的比率。
接通率高说明呼叫中心能够及时响应客户的来电,避免客户长时间等待。
2、工时利用率衡量员工有效工作时间的比例。
通过计算员工实际处理业务的时间与总工作时间的比值,来评估员工的工作效率。
3、排班遵守率考察员工是否按照排班计划进行工作。
遵守率高有助于保证呼叫中心的运营稳定和服务质量的一致性。
4、日处理量指员工在一天内处理的电话数量或业务量。
但需要注意的是,不能单纯追求数量而忽视服务质量。
三、业务能力指标1、业务知识掌握程度通过定期的业务知识测试、实际操作考核等方式,评估员工对产品知识、服务流程、相关政策法规等的了解和掌握程度。
2、问题解决能力观察员工在处理复杂问题时的分析能力、判断能力和解决方案的有效性。
How Does YOUR Call Center Stack Up?Call Center KPI’sThe Five Most Important Performance Indicatorsfor Customer Service Call Centers(Part 2 of a 6-part Series on Call Center Benchmarking)By Jeff Rumburg and Eric ZbikowskiManaging Partners at:IntroductionToday’s call center technologies and reporting packages make it easy to capture copious amounts of performance data. Most call center managers can tell you everything from last month’s average speed of answer to yesterday’s average handle time. But what does it all mean? If my abandonment rate goes up, but my cost per call goes down, is that good or bad? Is my call center performing better this month than it was last month? Despite all the data that call center managers have at their fingertips, most cannot answer a very basic question: How is my call center performing? Perhaps worse, many call center managers are unaware of the critical role – beyond mere measurement – that Key Performance Indicators (KPI’s) can and should play in the call center. This includes the ability to track and trend performance, identify, diagnose, and correct performance problems, and to establish performance goals and assign accountability for achieving the goals.An increasing number of progressive call centers recognize that when it comes to performance metrics, less really is more! They have discovered the 80/20 rule as it applies to call center performance measurement. These world-class call centers have learned that the effective application of just five KPI’s is all that is required for measuring, managing, and continuously improving their call center performance.In this article, MetricNet (), a leading source of online benchmarks and a pioneer in call center benchmarking, identifies and defines the five most important performance metrics for customer support call centers. They provide benchmark ranges for these metrics, and offer a creative approach for combining these metrics into a single, all-inclusive measure of call center performance.The Mighty Power of MetricsMany of us have heard the sage advice “You can’t manage what you don’t measure.” This is particularly true in the call center, where effective performance measurement is not just a necessity, but a prerequisite for effective decision-making. Despite the widespread belief in this statement, few call centers use KPI’s to their full potential. In fact MetricNet’s research, gathered from literally thousands of call center benchmarks, suggests that the vast majority of call centers use metrics to track and trend their performance – but nothing more! Unfortunately, in this mode, a call center misses the real value of performance measurement by failing to exploit the diagnostic capabilities of KPI’s.The true potential of KPI’s can only be unlocked when they are used holistically, not just to measure performance, but also to:Track and trend performance over timeBenchmark performance vs. industry peersIdentify strengths and weaknesses in the call centerDiagnose and understand the underlying drivers of performance gapsPrescribe actions to improve performanceEstablish performance goals for both individuals and the call center overallIn short, performance measurement and management is a critical discipline that must be mastered for any call center that aspires to world-class performance.A simple example will serve to illustrate how this discipline is applied. MetricNet recently worked with a 500+ seat bank call center that was struggling with low levels of customer satisfaction. A quick benchmark of the KPI’s showed that the bank’s First Contact Resolution (FCR) – the number of contacts resolved on initial contact with the customer – was low, at only 71%. Given the strong correlation between FCR and Customer Satisfaction (Figure 1 below), the bank initiated a number of initiatives designed to increase the FCR. These included more agent training hours, and the implementation of performance goals for FCR. As a result, over a period of eight months the bank realized a substantial increase in FCR, and hence customer satisfaction (Figure 2 below).The Five Most Important Call Center MetricsThe average customer service call center tracks more than 25 metrics. A list of the most common metrics is shown below (Figure 3). This is a classic example of quantity over quality, where call centers falsely assume that they are doing something productive and good by tracking all of these metrics. The vast majority of these metrics, however, are only marginally relevant – at best! The five that really matter are as follows: Cost per callCustomer SatisfactionFirst Contact Resolution RateAgent UtilizationAggregate Call Center PerformanceThese five metrics represent the 80/20 rule when it comes to call center performance: 80% of the value you receive from performance measurement and management in your call center can be derived from these five simple metrics!How do we know these are the most important metrics? Is it a hunch? Suspicion? An academic exercise? No, it’s none of the above. We know that these are the five metrics that matter most because the empirical evidence from more than a thousand call center benchmarks supports this conclusion. But let us explain why these metrics are socritically important.One goal of every business is to achieve the highest possible quality at the lowest possible cost. It stands to reason, therefore, that cost and quality should be measured on an ongoing basis. In fact, many would argue that cost and quality are the only two things that really matter. In a call center, the most effective cost metric is cost per contact, and the best indicator of quality is customer satisfaction. With this premise in mind, it’s relatively easy to come up with the next two metrics on our list: First Contact Resolution (FCR), and Agent Utilization.Earlier in this article, we talked about the importance of using metrics as a diagnostic tool to improve performance. So we have to ask ourselves, if customer satisfaction is one of the “foundation metrics” in the call center, how can we affect it? How can we improve it? Put another way, if customer satisfaction is suffering, what is the diagnosis?Well, it turns out that customer satisfaction is affected by a whole range of other performance variables, including Average Speed of Answer (ASA), Call Quality, and Handle Time, to name just a few. But the single biggest driver of customer satisfaction – by far – is FCR! The strong correlation between these two metrics was illustrated earlier in Figure 1. Nine times out of ten when customer satisfaction needs to improve, this can be achieved by increasing the FCR. This is why world-class call centers pay so much attention to this metric. They engage in a variety of tactics to continuously improve FCR, including agent training, investments in knowledge bases, and agent incentives tied toimprovements in FCR.But what about Cost per Call, the other foundation metric in the call center? It is common knowledge that labor, i.e. personnel, is the single biggest expense in the call center. In fact, for the average call center, 67% of all costs are labor related: salaries, benefits, incentive pay, and contractors. By definition, then, labor costs are the greatest lever we have to reduce the cost per call.The best measure of labor efficiency is agent utilization. Because labor costs represent the overwhelming majority of call center expenses, if agent utilization is high, the cost per call will inevitably be low. Conversely, when agent utilization is low, labor costs, and hence cost per call, will be high. This is illustrated in Figure 4 below.Just as world-class call centers are obsessive about maintaining a high FCR, they are equally committed to keeping their agent utilization rates high. This, in turn, has the effect of minimizing cost per call as illustrated above. That said, high utilization rates taken to the extreme, can actually increase your costs by driving agent turnover rates higher. Whenever utilization numbers approach 80% - 90%, that call center will see relatively high agent turnover rates because they are pushing the agents too hard. Extremely high utilization leads to burnout, and that, in turn, leads to turnover. Turnover is one of the most costly things that a call center can experience. In order to proactively manage agent turnover, best-in-class contact centers focus on “career pathing,” training, and time off phones to work on projects. The more time spent off the phones, the more training agents receive, and the more career coaching they have, thelower the turnover will be. This has to be leavened, of course, with the need to keep agents productive on the phones.The formula for determining agent utilization is somewhat complicated. It factors in the length of the work day, break times, vacation and sick time, training time and a number of other factors. But there is an easy way to approximate agent utilization without going to all this trouble:Let’s say, for example that the agents in a particular call center handle an average of1,250 calls per month at an average handle time of 5 minutes. Additionally, these agents work an average of 21 days per month, and their work day is 7.5 hours after subtracting lunch and break times. The simplified utilization formula above would work out to the following:Once again, this is not a perfect measure of agent utilization, but it is quick and easy, and gets you within 5% of the true agent utilization figure.We have now discussed four of the five metrics that are most important for managing a call center. What about the fifth metric? What is aggregate call center performance, and how do we measure it? Can a single measure really tell us the overall performance of our call center? The answer is yes, but as the name suggests, it involves aggregating a number of measures to come up with a combined score for call center performance. MetricNet’s research shows that establishing a single, overall score for your call center is critical. We call this measure the Balanced Score because it truly does communicate a balanced picture of call center performance. This is a mechanism that utilizes the key measures tracked in a call center, including such things as cost per call, ASA and call abandonment rate, and rolls them into a single, aggregate measure of call center performance.The value of this metric, when tracked over time, is that it enables call centers to determine whether overall performance is improving or declining. Oftentimes, when a call center attempts to communicate its performance to other stakeholders in the business, particularly to lay people who do not understand call center operations, they quickly become overwhelmed by the minutia of such measures as speed-of-answer and abandonment rate, and they are confused as to how to interpret the results. They are likely to focus in on one, easily-understood measure like abandonment rate or first-call resolution rate, and draw conclusions about overall call center performance from these two (relatively unimportant) measures. This is a classic case of “missing the forest for the trees”. It is therefore absolutely critical to communicate the overall performance of the call center, and the Balanced Score does that for you. It allows the aggregation of a whole series of measures, the normalization of those measures, and the creation a singleall-encompassing indicator of call center performance on a monthly basis. In this way, the call center can track its overall performance, and, in any given month, may see costs go up or customer satisfaction go down or speed of answer increase, but these individual measures take on a secondary level of importance because the Balanced Score provides a more complete and accurate portrait of call center performance.Figure 5 below illustrates how the Balanced Score is determined.Figure 6 below illustrates the Balanced Score for one call center over a twelve month period. Notice how you can see at a glance which months had improving performance (the balanced score goes up), and which months had declining performance (the balanced score goes down). The good news for this call center is that the overall trend is in a positive direction.Metrics that Don’t Matter (as much)Some of the most commonly tracked metrics in the call center, including ASA and Call Abandonment Rate, did not make the cut of the top five. Why is this? Have we missed something? Why are ASA and Call Abandonment Rate, which are so widely followed in this industry, not included in the top five? The answer is simple…they just don’t matter! That’s right; these metrics which are the foundation of so many service level agreements have almost no impact on customer satisfaction. Worse yet, as these metrics are pushed lower (i.e., lower ASA and lower Call Abandonment Rates) the cost per call increases geometrically! These facts fly in the face of almost all call center wisdom, which holds that ASA and Call Abandonment Rate should be driven as low as possible.If nothing else, in this paper we hope to shatter the myth that ASA and Call Abandonment Rate are important metrics. The reality is that these measures can yield unintended results if pushed too low. They will increase your costs without any corresponding increase in customer satisfaction. In the next section of this article, we will provide some guidelines for appropriate ASA and Call Abandonment Rate targets. And, as you probably suspect, they are higher than you might think.As we stated earlier in this article, these conclusions are based on empirical evidence. Figures 7, 8, 9, and 10 below show how little these two metrics affect customersatisfaction, yet how much they can increase your costs if driven too low.Please keep in mind that ASA and Call Abandonment Rate are not the only “low value” metrics tracked by many call centers. Figure 3 above shows 25+ of the most common metrics tracked by call centers, and the vast majority of these metrics fall into the same category as ASA and Call Abandonment: they add little if any value. Again, if you keep in mind the 80/20 rule of call center performance measurement, and focus on the five metrics identified in the previous section, you can operate your call center very efficiently and effectively.Benchmark Performance RangesAs a company that provides online benchmarks to companies worldwide, and across all major industries, MetricNet relies extensively on benchmarking to establish performance goals and targets for its call center clients. For the five most important call center metrics, Figure 11 below provides a number of valuable benchmarks that may be useful in establishing performance targets for your call center.ConclusionMost call centers commit two major mistakes when it comes to performance measurement: 1) they track too many metrics, and 2) they do not exploit the full potential of their performance metrics as a diagnostic tool.In this article we have shown that you can effectively track and trend your call center performance using just five KPI’s. The two “foundation metrics” that every call center should track on an ongoing basis are Cost per Call and Customer Satisfaction. The nexttwo metrics in the top five are the ones that have the greatest influence on cost and customer satisfaction: Agent Utilization and First Contact Resolution. And the final metric, what we call an aggregate metric because it provides an overall measure of call center performance, is the Balanced Score.These five metrics not only allow you to effectively measure your call center performance, but they enable you to:Track and trend performance over timeBenchmark performance vs. industry peersIdentify strengths and weaknesses in the call centerDiagnose and understand the underlying drivers of performance gapsPrescribe actions to improve performanceEstablish performance goals for both individuals, and the call center overall When it comes to call center measurement and management, less really is more! By tracking just five KPI’s, and using these KPI’s diagnostically to affect positive change in the call center, the job of guiding your call center towards world-class performance can be greatly simplified.Due to space limitations, this article barely begins to scratch the surface on the topic of call center performance metrics. In subsequent articles, MetricNet will continue its series on Successful Benchmarking for the Call Center, with articles on:Benchmarking Peer Group Selection: How to Ensure a Fair, Apples-to-Apples Comparison in Your Call Center BenchmarkThe Benchmarking Performance Gap: Diagnosing the Causal Factors Behind Your Call Center’s Performance GapsThe Cost vs. Quality Tradeoff: How Benchmarking Can Help You Achieve the Right Balance Between Cost and Quality in Your Call CenterThe Benchmarking Payoff: How to Build a Hard-Hitting Action Plan From Your Call Center BenchmarkStay tuned for next month’s article!About the AuthorsThe authors of this article, Jeff Rumburg and Eric Zbikowski, are both Managing Partners at MetricNet, the premier provider of performance metrics, benchmarks, performance reports, and scorecards for corporations worldwide.Jeff Rumburg is a co-founder and Managing Partner at MetricNet, LLC. Jeff is responsible for global strategy, product development, and financial operations for the company. As a leading expert in benchmarking and re-engineering, Mr. Rumburg authored a best selling book on benchmarking, and has been retained as a benchmarking expert by such well-known companies as IBM, Bank of America, and General Motors. Prior to co-founding MetricNet, Mr. Rumburg was president and founder of The Verity Group, an international management consulting firm specializing in IT benchmarking. While at Verity, Mr. Rumburg launched a number of syndicated benchmarking services that provided low cost benchmarks to more than 1,000 corporations worldwide. Mr. Rumburg has also held a number of positions of increasing responsibility at META Group, and Gartner, Inc. As a vice president at Gartner, Mr. Rumburg led a project team that reengineered Gartner's global benchmarking product suite. And as vice president at META Group, Mr. Rumburg's career was focused on business and product development for IT benchmarking. Mr. Rumburg's education includes an M.B.A. from the Harvard Business School, an M.S. magna cum laude in Operations Research from Stanford University, and a B.S. magna cum laude in Mechanical Engineering. He is author of A Hands-On Guide to Competitive Benchmarking: The Path to Continuous Quality and Productivity Improvement, and has taught graduate-level engineering and business courses.Eric Zbikowski is a co-founder and Managing Partner at MetricNet, LLC. Eric oversees all of worldwide sales, marketing and operations, and assists in the direction of MetricNet's global enterprise. Mr. Zbikowski is a knowledgeable leader with nearly 15 years experience in operational management, customer service and performance benchmarking. Previously, he was The Director of Operations, Worldwide Sales and Services at MicroStrategy - a leading enterprise software company. There, he ran worldwide sales operations and assisted in the execution of an overall sales strategy. Prior to that, he was Director of Sales and Marketing at The Corporate Executive Board - a global research firm focusing on corporate strategy for senior executives. Previously, he was a Vice President of Consulting at META Group - a leading information technology research and advisory services firm, where he helped create and launch META Group's Call Center Benchmark for Energy Utilities and fulfilled numerous help desk, call center and customer satisfaction engagements for Fortune 2000 companies. Prior to joining META Group, Mr. Zbikowski worked at The Bentley Group, A TSC Company, where he managed and directed the Information Services Division, focusing primarily on customer satisfaction, competitive analysis and performance benchmarking. Mr. Zbikowski also spent 3 1/2 years at Gartner Group, where he was well-published in performance benchmarking. There, he served as a regular speaker at conference seminars and co-created/launched a quality-management, customer-satisfaction benchmarking service used by CIOs of Fortune 500 companies. Mr. Zbikowski is also extensively involved in the community and is Co-Founder and Vice Chairman of The Board and Chairman of The Development Committee at The Computer Corner, a nonprofit community technology center in Washington DC. The Computer Corner continues to be rated "one of the finest small charities Greater Washington has to offer" by The Catalogue for Philanthropy. Mr. Zbikowski graduated cum laude in Economics from The Wharton School at the University of Pennsylvania, with a dual concentration in entrepreneurialmanagement and marketing.For More InformationFor more information on MetricNet, go to , e-mail us at info@, or call us at 703-992-7559.。

呼叫中心KPI指标常见的19条指标每个呼叫中心都有自己的KPI指标,指标的数量各不相同,有的多到一百多个,有的少到只有三五个。
这里介绍常用的19个KPI指标。
KPI值应有挑战性,即应略高于现有水平或至少不低于现有水平,要对完成上一级目标有所贡献并成为完成上一级目标的主要推动力。
一、接通率:接通率是指IVR终级服务单元的接通量与人工座席的接通量之和与进入呼叫中心的呼叫总量之比。
对于呼出式业务来说,接通率是指座席呼出电话后接通量与呼出电话总量二、呼入项目占有率:一般是指某段统计时间内,座席员处理多通电话的总时长与实际登录系统时长的比率。
对于没有座席操作系统的来说,占有率统计就比较困难,但是也可以通过对通话时长、在线等待时长、后处理时长、等待来话时长来进行粗略统计三、呼出项目工作效率:一般指某段统计时间内,总处理时长与登录系统时长的比率。
对于没有座席操作系统的呼叫中心可以将分母换成计划工作时长。
四、服务水平:是指对于呼入项目来说,某个统计时间段内X秒内应答电话数量与呼叫中心接入电话的百分比。
五、顾客满意度:顾客满意度是指顾客对于呼叫中心提供的服务的满意程度。
六、客户满意度:客户对于呼叫中心来说是那些委托呼叫中心代表本企业为最终消费进行服务的那些族群。
客户满意度是指客户对呼叫中心提供的服务满意程度,一般客户关注的合同的完成质量和最终顾客的满意程度。
七、平均处理时间:座席在后处理时间里主要处理与通话有关的事务,呼叫中心应该致力于减少后处理时长,以控制呼叫成本。
减少后处理时长的主要措施有:加快座席的录入速度、优化座席操作系统使界面具有亲和力、操作简单,减少不必要工作流程等。
八、平均振铃次数:是某段统计时间内,呼叫者听到IVR或是人工座席接起电话之前的电话振铃次数之和与呼叫次数之比。
九、平均排队时间:是指在某段统计时间内,呼叫者ACD列入名单后等待人工座席回答的等待的平均等待时长。
十、平均排队时间:是指在某段统计时间内,呼叫者ACD列入名单后等待人工座席回答的等待的平均等待时长。

呼叫中心绩效考核明细随着现代业务理念的不断深入,呼叫中心作为企业与客户之间的重要桥梁,其绩效考核成为了衡量企业运营效果的重要指标之一。
本文将详细阐述呼叫中心绩效考核的明细内容,以及如何合理制定考核指标,确保呼叫中心的高效运营。
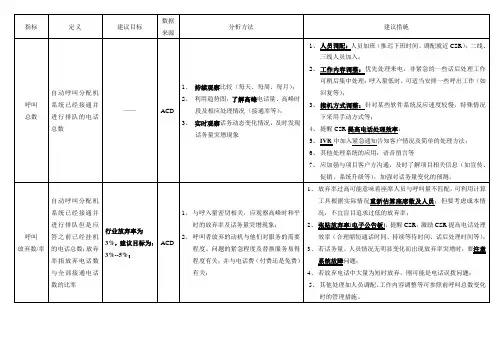
一、呼叫接通率呼叫中心作为与客户沟通的重要途径之一,其首要任务是及时接通客户来电。
呼叫接通率指的是在单位时间内成功接通客户来电的比例。
合理设置呼叫接通率的目标,可以提高客户满意度,增加业务转化率。
该指标可通过实时监控系统进行测量,确保呼叫接通率处于良好状态。
二、服务质量服务质量是呼叫中心绩效考核的核心指标之一。
通过客户满意度调查、服务级别协议等方式来评估服务质量。
其中,以下几方面是需要特别关注的内容:1.接听速度:呼叫中心应设定合理的等待时间目标,以提高客户满意度。
2.问题解决率:呼叫中心员工应具备较高的问题解决能力,及时解决客户问题。
3.服务态度:呼叫中心员工应热情友好地接待客户,提供专业的服务。
4.投诉处理:呼叫中心应及时处理客户投诉,并确保问题妥善解决,以避免不良评价影响企业形象。
三、呼叫处理时间呼叫处理时间指的是客户来电后,员工处理客户问题所花费的时间。
合理的呼叫处理时间可以提高客户满意度和呼叫中心效率。
但是,处理时间过长也可能导致客户不满,因此需要根据不同业务特点进行调整。
同时,呼叫处理时间还与员工培训、系统使用熟练程度等因素相关。
四、员工绩效评估员工绩效是呼叫中心绩效考核的重要环节。
除了服务质量之外,还需要关注以下几个指标:1.工作效率:员工需要按照规定时间内完成一定的任务量,确保工作高效进行。
2.工作准确率:员工在处理客户问题时,要保证工作的准确性,减少错误率。
3.适应能力:员工需要具备良好的学习能力和快速适应能力,以适应不同情况下的工作需求。
五、其他指标除了上述明细指标外,呼叫中心还可以根据业务特点和运营需求,制定一些其他的绩效考核指标。
比如客户转化率、业务处理量、员工流失率等等。

客户服务KPI考核指标
顾客满意率
平均处理时间(AHT)
首次接触解决率
响应时间
座席的全职员工(FTE)占呼叫中心全职员工总数的百分比
接听百分比(接听的销售电话数/提供的销售电话总数)平均通话后工作时间
每个处理程序的平均呼叫/服务请求数
来电的平均排队时间
每分钟处理时间成本
呼叫中心/服务台的运营成本
电子邮件积压工作
现场服务技术人员利用率
命中率(销售的产品与接到的销售电话总数的比较)
入站放弃率
入站代理拨打的呼叫
入库可用性
入站平均通话时间
入库平均包装时间
已创建呼入呼叫中心潜在客户
创建呼入呼叫中心机会
已处理的呼入电话
每座席小时处理的呼入电话
入站服务级别
投诉数量
在给定时间范围内回答的客户服务请求的百分比转接呼叫的百分比
每天/每周/每月的总通话时间。
呼叫中心各项指标(KPI)目前呼叫中心越来越趋向精细化、数字化管理,KPI管理成为一种有效的管理手段。
通常,呼叫中心的运营管理者们通过分解运营目标制订各种KPI指标,通过KPI指标来引导座席代表行为,从而达到完成项目运营目标。
大部分呼叫中心采用呼叫中心集成系统和座席操作系统,另外还有强大的运营管理系统进行数据支持,所以为实行数字化管理奠定了良好的基础。
KPI 的英文名字是Key Performance Indications,即指关键绩效指标,是通过对组织内部某一流程的输入端、输出端的关键参数进行设置、取样、计算、分析,衡量流程绩效的一种目标式量化管理指标,是把企业的战略目标分解为可运作的远景目标的工具,是企业绩效管理系统的基础。
KPI符合一个重要的管理原理--"二八原则"。
在一个企业的价值创造过程中,存在着"20/80"的规律,即20%的骨干人员创造企业80%的价值;而且在每一位员工身上"二八原理"同样适用,即80%的工作任务是由20%的关键行为完成的。
因此,必须抓住20%的关键行为,对之进行分析和衡量,这样就能抓住业绩评价的重心。
每个呼叫中心都有自己的KPI指标,指标的数量各不相同,有的多到一百多个,有的少到只有三五个。
这里介绍常用的20个KPI指标。
这些KPI 指标源于美国普度大学消费品质量监测中心琼?安顿教授提出了23个与客户服务中心运营相关的数字化规范指标,根据目前行业软硬件的发展及所在公司的经验,进行重新的修改。
其中数据标准部分,一部分来源于行业标准,一部门来源于某些呼叫中心的历史数据。
但是,无论怎样制定这些标准,KPI值应有挑战性,即应略高于现有水平或至少不低于现有水平,要对完成上一级目标有所贡献并成为完成上一级目标的主要推动力。
一、接通率定义:对于具有IVR和ACD的呼入式呼叫中心,接通率是指IVR终级服务单元的接通量与人工座席的接通量之和与进入呼叫中心的呼叫总量之比。

中国移动客户服务KPI考核机制及效果.(精选合集)第一篇:中国移动客户服务KPI考核机制及效果.中国移动客户服务KPI考核机制及效果导读:“这个月又完蛋了”,A市移动公司客户响应中心的小王看到省公司转发下来的第三方客户满意度调查数据,正在发愁怎么向领导汇报,连续三月客户满意度关键指标都在下滑,似乎也做了很多努力,但就是没有收到成效,客户满意度在几个关键短板上始终提不“这个月又完蛋了”,A市移动公司客户响应中心的小王看到省公司转发下来的第三方客户满意度调查数据,正在发愁怎么向领导汇报,连续三月客户满意度关键都在下滑,似乎也做了很多努力,但就是没有收到成效,客户满意度在几个关键短板上始终提不上去。
类似小王的烦恼,同样存在于全国各省、各地市、各区县的所有移动分公司的客户满意度负责人身上。
这套KPI考核的设定,关系到个人工作业绩,更直接决定上级移动公司对本级移动公司下一年度的财务划款和资源配置。
中国移动通信集团自2000年成立起,就向着国际标准迈进,引入国际通行的第三方公司背靠背客户满意度调查作为企业客户服务质量的评价依据,从而实现了客户服务质量的飞跃,有力支撑了市场跨越式发展,直至今日成为全球市值最大的通信公司,实现了“服务与业务双领先”的战略目标。
而客户服务纳入到企业KPI体系,发轫于2001年,成熟的全国性操作和考核则是2003年。
一、中国移动客户服务KPI考核历史沿革2001年,中国移动全面部署开展“创新服务”时,把客户满意度列为经营考核的重要,初步建立起了服务监督和考核机制,加强了对客户服务相关的考核权重,制定实施了具体考核实施方案。
2002年的考核采用“目标管理”模式,根据压力传递机制,将“经营”分解成基本目标和挑战目标,下达给各分公司,进行层层考核。
并增加了竞争对手的领先程度考核。
2004年,逐步实现从内部管理考核向外部客户感知评价转变,逐步从内部管理导向转变为以市场为导向、以客户为导向。

呼叫中心20个常用关键绩效指标(KPI)介绍(一)每个呼叫中心都有自己的KPI指标,指标的数量各不相同,有的多到一百多个,有的少到只有三五个。
这里介绍常用的20个KPI指标。
对于具有IVR和ACD的呼入式呼叫中心,接通率是指IVR终级服务单元的接通量与人工座席的接通量之和与进入呼叫中心的呼叫总量之比。
对于呼出式业务来说,接通率是指座席呼出电话后接通量与呼出电话总量之比。
呼入式业务是影响顾客满意度的一个重要的指标,与接通率相对应的是呼叫中心的顾客丢失率,如果接通率过低,说明有很多顾客无法接入呼叫中心,这会造成顾客的抱怨。
此时,管理者和质量管理者应该立即寻找接通率过低的原因,并采取改进措施。
接通率过低一般由两种原因造成:一是呼叫中心的通信系统出现问题,导致系统丢失顾客数据而使顾客无法接入到IVR或是人工座席。
另一个是相对呼入量来说呼叫中心的座席资源过少造成的。
呼叫中心为了尽可能的节省人工成本,会牺牲一部分顾客,允许有一定时长的顾客等待或丢失。
但是管理者应该随时关注接通率状况,通过灵活调配座席资源使其保持在规定的KPI值之内。
而对于呼出式业务来说,接通率是数据质量的一个重要的体现,如果接通率过低的话,说明数据中有大部分数据的电话是错误的。
接通率过低会浪费呼叫中心的时间资源从而会浪费呼叫中心的人力资源。
当呼叫中心的呼出接通率过低的时间,管理者应该立即分析接通率低的原因,如果可以排除呼叫中心技术系统的问题,管理者就需要关注数据质量,分析数据质量,安排对数据库进行更新和维护,尽可能的保证数据的正确性,从而节省呼叫中心的外呼成本。
数据更新的工作可以跟随每个项目的呼出任务同时进行,也可以安排呼叫中心的剩余人员进行数据核实,以保证数据质量。
二、呼入项目占有率占有率是一个衡量呼入式业务座席工作负荷的指标,一般是指某段统计时间内,座席员处理多通电话的总时长与实际登录系统时长的比率。
对于没有座席操作系统的来说,占有率统计就比较困难,但是也可以通过对通话时长、在线等待时长、后处理时长、等待来话时长来进行粗略统计。
呼叫中心各项指标KPI随着现代企业的快速发展和商业竞争的加剧,呼叫中心已经成为企业管理中极其重要的一环。
呼叫中心是现代企业与客户之间沟通的重要渠道,它的服务质量直接关系到客户信任和企业形象的建立。
为了达到高效运营的目的,而保证及时解决客户的问题,呼叫中心必须采用合理的管理方法,以此来优化资源的使用,提高整体效率。
呼叫中心各项指标KPI(Key Performance Indicator)是评估呼叫中心运营效率和绩效的重要依据,每个呼叫中心都需要注意各项指标的优化,来保持企业竞争力。
1、呼入量呼入量是评估呼叫中心的重要指标之一。
它反映了客户对企业的关注和信任,也反映了企业宣传和广告效果的好坏。
呼入量的统计可以帮助企业制定不同的服务策略,有针对性地投入资源,协调人力和技术,以最佳的解决客户问题,提升客户满意度。
2、呼入处理率呼入处理率指呼叫中心收到的电话中,能够在保持率内接听并处理的比例。
呼入处理率越高,表示呼叫中心的服务水平越高,能够更快速的响应客户的需求,提升员工服务意识和效率,也能保证企业的服务质量和形象。
3、接通率接通率是衡量呼叫中心通话效率和员工工作效率的重要指标。
接通率太低,容易导致客户失去耐心和信任,催生恶性循环,降低呼叫中心的声誉。
提高接通率,除了优化技术设备和服务策略,还需要提高员工服务意识和综合素质,提高呼入处理速度、语音及沟通技巧等。
4、转化率转化率是衡量呼叫中心销售和营销的重要指标。
通过对转化率的分析,呼叫中心可以了解企业的销售策略是否有效,市场组合是否合理。
出现转化率过低的情况,呼叫中心可以进行调整,筛选营销话术、对销售员工进行指导和培训,帮助其提升销售技能和识别客户需求的能力。
5、满意度满意度是衡量客户对呼叫中心的服务质量的重要指标。
关注客户的满意度,可以帮助企业保持良好的声誉和形象,同时优化服务内容和提高服务质量。
提高客户满意度需要呼叫中心引入客户反馈机制,定期调查客户对服务的满意度,垂直细分和优化服务策略,不断改善服务流程和提升服务员工的服务质量和技能。
呼叫中心的基本KPI指标最初发表在《呼叫中心杂志》(2007年4月刊)这是呼叫中心标准评价系列的第二篇文章。
今天的呼叫中心技术和报表系统可以很容易地得到大量的绩效数据。
大部分呼叫中心管理者会告诉你各类数据,从上个月的ASA到昨天的AHT。
但是,这些说明了什么呢?如果放弃率提高了,而单个电话成本下降了,是好是坏呢?本月呼叫中心的绩效比上个月更好了吗?尽管呼叫中心管理者掌握这些数据,但是绝大多数仍然不能回答一个基本的问题:呼叫中心怎样提升绩效?更糟糕的是,许多呼叫中心管理者还没有意识到在呼叫中心KP扮演角色的关键性——不单是度量。
它包括了追踪并趋近绩效,识别,诊断,并解决绩效问题,以及建立绩效目标和为达成目标而分配责任。
越来越多的呼叫中心意识到,绩效指标越少越好。
他们发现,80/20法则适用于呼叫中心的绩效度量。
那些世界级呼叫中心已经学会了5种KPIs的有效应用,从而度量,管理,并持续改善其呼叫中心绩效。
本文将识别和定义5种对客户服务型呼叫中心最重要的绩效指标。
强效指标我们都听过这样的哲理,“你不能去管理你无法度量的东西。
”呼叫中心正是这样。
有效的绩效测量不仅是必要的,而且是做有效决策的前提。
尽管普遍都认识到这一点,很少有呼叫中心在KPIs上投入精力。
实际上,通过确实收集上千家呼叫中心的基准评价,MetricNet的研究报告表明,绝大多数呼叫中心使用指标去追踪并趋近绩效——没有其他的做法。
不幸的是,在这种模式下,由于没有利用KPIs的诊断能力,呼叫中心也失去了绩效度量的真正价值。
只有当整体性使用时,才能发挥KPIs的潜能。
不仅去度量绩效,而且是:与同行对比绩效的基准评价;识别呼叫中心的优劣势;诊断并了解绩效差异的根本原因;制订改善绩效的行动方案;建立呼叫中心整体和每个员工的绩效目标。
总之,绩效度量和管理是所有渴求最佳绩效的呼叫中心必须要掌握的一门关键学科。
一个简单的例子可以说明如何使用该学科。
最近MetricNet为500坐席的银行呼叫中心工作,该中心被低水平的客户满意度所困扰。
呼叫中心绩效指标与评分标准、计算方法一、考核项目及所占比例座席代表的考核项目分为工作数量、工作质量、工作状态三部分。
同时座席代表所在班组的指标也纳入到座席代表的考核项目中。
各部分考核项目及所占比例如下所示:指标层级工作数量工作质量工作状态总计考核项目比例考核项目比例考核项目比例班组指标成功呼叫数量5%客户投诉量5%20%工时利用率5%话务抽查合格率5%个人指标成功呼叫数量15%客户投诉量10%出勤率5%80%工时利用率15%话务抽查合格率8%违反规章次数10%业务成功率10%客户挂机满意度7%总计50%35%15%100%上述比例仅供参考,各中心可以根据实际情况调整班组和个人指标所占的比例,同时相应地调整各个分项的比例。
二、具体考核内容及评分标准班组指标(20%)成功呼叫数量:每月每个班组的总呼叫数量,扣除没有成功实现业务需求的呼叫数量(包括无效呼叫)。
数据来源于话务系统的统计。
根据不同的班组(普通组、复合组、专家组)分别制订指标,分为3个档次的指标:普通组复合组专家组合格(60分)成功呼叫数量达到a1条成功呼叫数量达到a2条成功呼叫数量达到a3条良好(80分)成功呼叫数量达到b1条成功呼叫数量达到b2条成功呼叫数量达到b3条优秀(100分)成功呼叫数量达到c1条成功呼叫数量达到c2条成功呼叫数量达到c3条工时利用率:班组所有座席代表正常工作的时长占规定工作时长的比例。
工作时间包括处理电话时间、事后整理时间、开会(班前班会后)、培训时间,但不包括休息时间。
数据来源于话务系统的统计。
分为3个档次的指标:o合格(60分),工时利用率大于a%o良好(80分),工时利用率大于b%o优秀(100分),工时利用率大于c%客户投诉量:每月班组因座席代表的服务态度、业务办理错误而引发的客户投诉数量。
数据来源于投诉工单汇总统计。
分为3个档次的指标:o合格(60分),客户投诉量小于a件o良好(80分),客户投诉量小于b件o优秀(100分),客户投诉率小于c件话务抽查合格率:在为客户提供人工服务时合格话务的比例,计算公式为(质检的总数量-质检发现的出现错误的话务数量)/质检的总数量×100%。
呼叫中心运营管理的15个KPI要素1.首先为呼叫中心设立适当的服务水平目标服务水平指标常常被看作是呼叫中心的一项重要绩效指标或者追求目标之一。
它确实是衡量呼叫中心整体服务效率和客户服务体验的一个重要指针,但是它的作用及重要意义要远远超出这个范畴。
一个呼叫中心的话务服务水平目标为呼叫中心其它相关重要活动的进行奠定了基础。
呼叫中心所选择的服务水平目标将直接影响到人员的招聘、班次的安排以及特殊应急方案的制订和启动。
2、绩效数据的真实可靠和正确理解呼叫中心的报表系统为呼叫中心的高效管理提供了必要的数据支持。
但是,在很多时候,这些数据会被错误解读,并导致错误的行动。
要确保任何一个接收和阅读报表的人正确理解每项指标的定义和计算。
不同的呼叫中心系统往往为同一项指标冠以不同的名称或者为不同的指标冠以相同的名称。
因此,呼叫中心相关管理人员要与系统维护人员或者设备厂商详细确认每一项指标的定义和算法,不要自主推断和猜测。
3、考核员工的通话质量和排班遵守率(守时率)只有两件事情是在呼叫中心一线员工的控制范围之内的:通话质量和排班遵守。
除此之外的任何衡量员工生产力的指标(如:单位时间接话量、占用率等)都有可能引起员工不恰当的行为,对呼叫中心的整体运营绩效产生负面的影响。
为了衡量员工的排班遵守率,呼叫中心要有相应的流程和工具,能够确保排班表的实时动态更新和统计分析。
尽管这项工作有些复杂,但是就其产生的效果来看,还是值得去付出努力的。
4、改进运营流程和体系,涵盖多种联络渠道大多数传统呼入电话服务的运营流程也可以适用于其它多媒体沟通联络渠道,因为它们都以设定和达成服务水平目标或者响应周期目标为核心要素。
但是,尽管它们的规划和运营流程类似,为了充分利用多媒体沟通渠道所带来的运营效率和客户体验效果的提升,呼叫中心必须进一步更新和完善这些流程。
呼叫中心应该针对每一种沟通联络渠道进行业务流程的梳理,充分利用该渠道的特色和优势,对业务流程进行优化和提升。