mschart使用说明1
- 格式:docx
- 大小:14.73 KB
- 文档页数:4

一.数据源说到绘制图表,可能很多人的第一反应除了是图表呈现的方式外,更关心的便是数据如何添加,记得在很多年前,哪时要绘制一个数据曲线图,一直找不到好的呈现方式,后来使用了SVG的绘图模式,不过在添加数据的时候可谓吃尽了苦头,毕竟,SVG只是一种描述语言,要动态的实现一个图表的绘制,是非常困难的.对于微软的图表控件,数据添加是一件很简单的方式,它支持多种数据添加方式,如:·可以在图表的设计界面,在属性设置窗口中的Series属性下的Points中添加需要的数据.·可以在图表的设计界面中,在属性中绑定一个数据源.·可以在后台代码中,动态添加数据.·可以在后台代码中设置一个或多个数据源,直接绑定到图表中.在此处,我只着重讲解一下第3,4两点.对于第3点,相对来说比较简单,在后台代码中,找到要添加代码的Series,通过它下面Points的Add、AddXY、AddY等方法,即可以实现数据的添加.例如:1. double t;2. for(t = 0; t <= (2.5 * Math.PI); t += Math.PI/6)3. {4. double ch1 = Math.Sin(t);5. double ch2 = Math.Sin(t-Math.PI/2);6. Chart1.Series["Channel 1"].Points.AddXY(t, ch1);7. Chart1.Series["Channel 2"].Points.AddXY(t, ch2);8. }复制代码注:代码摘自微软的例子,上例中,Chart1为图表的名字,Channel 1、Channel 2分别表示两个Series数据序列)二.绑定数据先来看看图表控件都支持什么类型的数据绑定,根据官方文档的说法,只要是实现了IEnumerable接口的数据类型,都可以绑定到图表控件中,例如:DataView, DataReader, DataSet, DataRow, DataColumn, Array, List, SqlCommand, OleDbCommand, SqlDataAdapter, 及OleDbDataAdapter对象。

MSChart使用导航之开发介绍过基础的MSchart知识后,大家应该容易上手写代码了,最起码搞几个饼图柱状图什么的不在话下了。
下面我们看看如何在实际项目中写代码。
1.柱状图1: string strSQL;2: DataSet ds = new DataSet();3: Chart1.ChartAreas[0].Name = "chartArea1";4: Chart1.Titles.Add("chartArea1");5: Chart1.Titles[0].Font = new Font("????", 14, FontStyle.Bold);6: strSQL = "select col1,col2 from Report";7: ds.Tables.Add(DBSQL.Query(strSQL, 300).Tables[0].Copy());8: ds.Tables[0].TableName = "chartArea1";9: if(ds.Tables[0].Rows.Count > 0)10: {11: Chart1.Series[0].Name = "chartArea1";12: Series ser_qqgzjz = Chart1.Series[0];13: ser_qqgzjz.ChartArea = "chartArea1";14: ser_qqgzjz.Points.DataBind(ds.Tables["qqgzjz"].Rows,"col2", "col1", "");15: ser_qqgzjz.IsValueShownAsLabel = true;16: Chart1.ChartAreas["chartArea1"].AxisY.Title = "Person";17:Chart1.ChartAreas["chartArea1"].AxisX.MinorGrid.LineWidth = 0;18: Chart1.ChartAreas["chartArea1"]belStyle.Angle = -45;19:Chart1.ChartAreas["chartArea1"].AxisX.MajorGrid.LineDashStyle =ChartDashStyle.NotSet;20:Chart1.ChartAreas["chartArea1"].AxisY.MajorGrid.LineDashStyle =ChartDashStyle.Dash;21: }2.双纵坐标(含百分比)1: // chart is your mschart control,srcSeriesName is the name of source series name,destSeriesName2: // is the name of series you want to add,which is percentseries,totalCount is the number3: // which to caculator the percent4: protected void TowGrid(Chart chart, string srcSeriesName, string destSeriesName, double totalCount)5: {6: string strChartArea =chart.Series[srcSeriesName].ChartArea;7: chart.Series[srcSeriesName].ChartType = SeriesChartType.Column;8: double total = totalCount;9: Series destSeries = new Series(destSeriesName);10: chart.Series.Add(destSeries);11: destSeries.ChartType = SeriesChartType.Line;12: destSeries.BorderWidth = 3;13: destSeries.ChartArea =chart.Series[srcSeriesName].ChartArea;14: destSeries.YAxisType = AxisType.Secondary;15: chart.ChartAreas[strChartArea].AxisY2.Maximum = 100; 16: chart.ChartAreas[strChartArea].AxisY2.Title = "??????%??";17: chart.ChartAreas[strChartArea].AxisY2.TitleFont = new Font("??????", 10);18: belFormat = "P1";19:chart.ChartAreas[strChartArea].AxisY2.MajorGrid.LineDashStyle = ChartDashStyle.NotSet;20:chart.ChartAreas[strChartArea]belStyle.IsEndLabelVisible = false;21: double percentage = 0.0;22: foreach (DataPoint pt inchart.Series[srcSeriesName].Points)23: {24: percentage = (pt.YValues[0] * 100.0 / total);25: destSeries.Points.Add(Math.Round(percentage, 2));26: }27: chart.Series[destSeriesName].IsValueShownAsLabel = true; 28: chart.Series[destSeriesName].MarkerColor = Color.Red; 29: chart.Series[destSeriesName].MarkerBorderColor =Color.MidnightBlue;30: chart.Series[destSeriesName].MarkerStyle =MarkerStyle.Circle;31: chart.Series[destSeriesName].MarkerSize = 8;32: chart.Series[destSeriesName].LabelFormat = "0.#";33: }34: }通过以上代码的结合,就能制作出如下效果的图表:PS:不少网友遇到横坐标值不能完全显示的问题,只需要修改横坐标的间隔值即可。

c# ms chart 控件使用方法第一个简单的chart:spline// Create new data series and set it's visualattributes Series series = new Series("Spline");series.ChartType = SeriesChartType.Spline;series.BorderWidth = 3;series.ShadowOffset = 2;// Populate new series with dataseries.Points.AddY(67);series.Points.AddY(57);series.Points.AddY(83);series.Points.AddY(23);series.Points.AddY(70);series.Points.AddY(60);series.Points.AddY(90);series.Points.AddY(20);// Add series into the chart's series collectionChart1.Series.Add(series);同时显示2条曲线// Populate series with random dataRandom random = new Random();for (int pointIndex = 0; pointIndex < 10;pointIndex++){Chart1.Series["Series1"].Points.AddY(random.Next(45, 95));Chart1.Series["Series2"].Points.AddY(random.Next(5, 75));}// Set series chart typeChart1.Series["Series1"].ChartType = SeriesChartType.Line;Chart1.Series["Series2"].ChartType = SeriesChartType.Spline;// Set point labelsChart1.Series["Series1"].IsValueShownAsLabel = true;Chart1.Series["Series2"].IsValueShownAsLabel = true;// Enable X axis marginChart1.ChartAreas["ChartArea1"].AxisX.IsMarginVisible = true;// Enable 3D, and show data point marker linesChart1.ChartAreas["ChartArea1"].Area3DStyle.Enable3D = true; Chart1.Series["Series1"]["ShowMarkerLines"] = "True";Chart1.Series["Series2"]["ShowMarkerLines"] = "True";显示column类型图// Create new data series and set it's visual attributesSeries series = new Series("FlowRead");series.ChartType = SeriesChartType.Column;series.BorderWidth = 3;series.ShadowOffset = 2;// Populate new series with dataseries.Points.AddY(67);series.Points.AddY(57);series.Points.AddY(83);series.Points.AddY(23);series.Points.AddY(70);series.Points.AddY(60);series.Points.AddY(90);series.Points.AddY(20);// Add series into the chart's series collectionChart1.Series.Add(series);很多点,效率还可以// Fill series datadouble yValue = 50.0;Random random = new Random();for (int pointIndex = 0; pointIndex < 20000;pointIndex++){yValue = yValue + (random.NextDouble() * 10.0 - 5.0);Chart1.Series["Series1"].Points.AddY(yValue);}// Set fast line chart typeChart1.Series["Series1"].ChartType = SeriesChartType.FastLine;}日期,xy类型// Create a new random number generatorRandom rnd = new Random();// Data points X value is using current dateDateTime date = DateTime.Now.Date;// Add points to the stock chart seriesfor (int index = 0; index < 10; index++){Chart1.Series["Series1"].Points.AddXY(date, // X value is a daternd.Next(40,50)); //Close Y value// Add 1 day to our X valuedate = date.AddDays(1);}int-int的xy数据绘图// Create a new random number generatorRandom rnd = new Random();// Add points to the stock chart seriesfor (int index = 0; index < 10; index++){Chart1.Series["Series1"].Points.AddX Y(rnd.Next(10,90), // X value is a daternd.Next(40,50)); //Close Y value}数据库数据,datetime-int类型string connStr ="server=localhost;database=seis_project;uid=seisprjs;pwd=seisprjs";SqlConnection myConn = new SqlConnection(connStr);string selStr = "select 时间,序号from pub_log_read order by 序号asc";SqlCommand myCmd = myConn.CreateCommand();mandText = selStr;myConn.Open();SqlDataReader sdr =myCmd.ExecuteReader(CommandBehavior.CloseConnection);// Since the reader implements and IEnumerable, pass the readerdirectly into// the DataBindTable method with the name of the Column to be usedas the X ValueChart1.DataBindTable(sdr, "时间");sdr.Close();myConn.Close();数据库数据2,string-int类型string connStr ="server=localhost;database=seis_project;uid=seisprjs;pwd=seisprjs";SqlConnection myConn = new SqlConnection(connStr);string selStr = "select 帐号,count(帐号) as 次数from pub_log_read groupby 帐号order by 帐号asc";SqlCommand myCmd = myConn.CreateCommand();mandText = selStr;myConn.Open();SqlDataReader sdr =myCmd.ExecuteReader(CommandBehavior.CloseConnection);// Since the reader implements and IEnumerable, pass the readerdirectly into// the DataBindTable method with the name of the Column to be usedas the X ValueChart1.DataBindTable(sdr, "帐号");sdr.Close();myConn.Close();数据库绑定3-error?string connStr ="server=localhost;database=seis_project;uid=seisprjs;pwd=seisprjs";SqlConnection myConn = new SqlConnection(connStr);string selStr = "select 帐号,count(帐号) as 次数from pub_log_read groupby 帐号order by 帐号asc";SqlCommand myCmd = myConn.CreateCommand();mandText = selStr;myConn.Open();// Set chart data sourceChart1.DataSource = myCmd;// Set series members names for the X and Y valuesChart1.Series["Series1"].X ValueMember = "帐号";Chart1.Series["Series1"].YValueMembers = "次数";// Data bind to the selected data sourceChart1.DataBind();myConn.Close();数据库4,只绑定ystring connStr ="server=localhost;database=seis_project;uid=seisprjs;pwd=seisprjs";SqlConnection myConn = new SqlConnection(connStr);string selStr = "select 序号from pub_log_read order by 序号asc";SqlCommand myCmd = myConn.CreateCommand();mandText = selStr;myConn.Open();SqlDataReader sdr =myCmd.ExecuteReader(CommandBehavior.CloseConnection);// Since the reader implements and IEnumerable, pass the readerdirectly into// the DataBindTable method with the name of the Column to be usedas the X ValueChart1.Series[0].Points.DataBindY(sdr);sdr.Close();myConn.Close();数据库5,绑定xystring connStr ="server=localhost;database=seis_project;uid=seisprjs;pwd=seisprjs";SqlConnection myConn = new SqlConnection(connStr);string selStr = "select 帐号,count(帐号) as 次数from pub_log_read groupby 帐号order by 帐号desc";SqlCommand myCmd = myConn.CreateCommand();mandText = selStr;myConn.Open();SqlDataReader sdr =myCmd.ExecuteReader(CommandBehavior.CloseConnection);// Since the reader implements and IEnumerable, pass the readerdirectly into// the DataBindTable method with the name of the Column to be usedas the X ValueChart1.Series[0].Points.DataBindX Y(sdr, "帐号",sdr,"次数");sdr.Close();myConn.Close();数据库6,支持显示参数// Resolve the address to the Access databasestringfileNameString = this.MapPath(".");fileNameString += "..\\..\\..\\data\\chartdata.mdb";//Initialize a connectionstringstringmyConnectionString = "PROVIDER=Microsoft.Jet.OLEDB.4.0;DataSource=" + fileNameString;// Definethe databasequerystringmySelectQuery="SELECT * FROM REPSALES WHERE Year=2004;";// Createa database connection object using the connectionstringOleDbConnection myConnection = newOleDbConnection(myConnectionString);// Create adatabase command on the connection usingqueryOleDbCommandmyCommand = new OleDbCommand(mySelectQuery, myConnection);// Open theconnectionmyCommand.Connection.Open();// Create adatabasereaderOleDbDataReader myReader=myCommand.ExecuteReader(CommandBehavior.CloseConnection);// Since thereader implements and IEnumerable, pass the reader directlyinto// theDataBind method with the name of the Columns assigned to theappropriateproperty Chart1.Series["Series1"].Points.DataBind(myReader,"Name","Sales","Tooltip=Year, Label=Commissions{C2}");// Closethe reader and the connectionmyReader.Close();myConnection.Close();数据库7,支持多line// Resolve the address to the Access databasestringfileNameString = this.MapPath(".");fileNameString += "..\\..\\..\\data\\chartdata.mdb";//Initialize a connectionstringstringmyConnectionString = "PROVIDER=Microsoft.Jet.OLEDB.4.0;DataSource=" + fileNameString;// Definethe databasequerystringmySelectQuery="SELECT * FROM REPSALES;";// Createa database connection object using the connectionstringOleDbConnection myConnection = newOleDbConnection(myConnectionString);// Create adatabase command on the connection usingqueryOleDbCommandmyCommand = new OleDbCommand(mySelectQuery, myConnection);// Open theconnectionmyCommand.Connection.Open();// Create adatabasereaderOleDbDataReader myReader=myCommand.ExecuteReader(CommandBehavior.CloseConnection);// Data bindchart to a table where all rows are grouped in series by the "Name"column Chart1.DataBindCrossTable(myReader,"Name","Year","Sales","Label=Commissions{C}");// Closethe reader and the connectionmyReader.Close();myConnection.Close();数据库8,按照行添加数据// Resolve the address to the Access databasestringfileNameString = this.MapPath(".");fileNameString += "..\\..\\..\\data\\chartdata.mdb";//Initialize a connectionstringstringmyConnectionString = "PROVIDER=Microsoft.Jet.OLEDB.4.0;DataSource=" + fileNameString;// Definethe databasequerystringmySelectQuery="SELECT * FROM SALESCOUNTS;";// Createa database connection object using the connectionstringOleDbConnection myConnection = newOleDbConnection(myConnectionString);// Create adatabase command on the connection usingqueryOleDbCommandmyCommand = new OleDbCommand(mySelectQuery, myConnection);// Open theconnectionmyCommand.Connection.Open();//Initializes a new instance of the OleDbDataAdapter classOleDbDataAdapter myDataAdapter = new OleDbDataAdapter();myDataAdapter.SelectCommand = myCommand;//Initializes a new instance of the DataSet classDataSetmyDataSet = new DataSet();// Addsrows in the DataSetmyDataAdapter.Fill(myDataSet,"Query");foreach(DataRow row in myDataSet.Tables["Query"].Rows){// For each Row add a new seriesstring seriesName = row["SalesRep"].ToString();Chart1.Series.Add(seriesName);Chart1.Series[seriesName].ChartType = SeriesChartType.Line;Chart1.Series[seriesName].BorderWidth = 2;for(int colIndex = 1; colIndex <myDataSet.Tables["Query"].Columns.Count; colIndex++) {// For each column (column 1 and onward) add the value as apointstring columnName =myDataSet.Tables["Query"].Columns[colIndex].ColumnName; int YVal = (int) row[columnName];Chart1.Series[seriesName].Points.AddX Y(columnName, YVal);}}DataGrid.DataSource = myDataSet;DataGrid.DataBind();// Closesthe connection to the data source. This is the preferred// method ofclosing any open connection.myCommand.Connection.Close();使用xml数据// resolve the address to the X ML documentstringfileNameString = this.MapPath(".");stringfileNameSchema = this.MapPath(".");fileNameString += "..\\..\\..\\data\\data.xml";fileNameSchema += "..\\..\\..\\data\\data.xsd";//Initializes a new instance of the DataSet classDataSetcustDS = new DataSet();// Read X MLschema into the DataSet.custDS.ReadX mlSchema( fileNameSchema );// ReadX ML schema and data into the DataSet.custDS.ReadX ml( fileNameString );//Initializes a new instance of the DataView classDataViewfirstView = new DataView(custDS.Tables[0]);// Sincethe DataView implements and IEnumerable, pass the reader directlyinto // theDataBindTable method with the name of the column used for the X value. Chart1.DataBindTable(firstView, "Name");使用excel数据// resolve the address to the Excel filestringfileNameString = this.MapPath(".");fileNameString += "..\\..\\..\\data\\ExcelData.xls";// Createconnection object by using the preceding connection string.string sConn= "Provider=Microsoft.Jet.OLEDB.4.0;Data Source=" +fileNameString + ";Extended Properties="Excel8.0;HDR=YES"";OleDbConnection myConnection = new OleDbConnection( sConn );myConnection.Open();// Thecode to follow uses a SQL SELECT command to display the data fromthe worksheet.// Createnew OleDbCommand to return data from worksheet.OleDbCommandmyCommand = new OleDbCommand( "Select * From[data1$A1:E25]",myConnection );// createa databasereaderOleDbDataReader myReader=myCommand.ExecuteReader(CommandBehavior.CloseConnection);//Populate the chart with data in the fileChart1.DataBindTable(myReader, "HOUR");// closethe reader and the connectionmyReader.Close();myConnection.Close();使用csv数据// Filename of the CSV filestring file= "DataFile.csv";// Getthe path of the CSV filestring path= this.MapPath(".");path +="..\\..\\..\\data\";// Createa select statement and a connection string.stringmySelectQuery = "Select * from " + file;stringConStr = "Provider=Microsoft.Jet.OLEDB.4.0;Data Source="+path+ ";Extended Properties="Text;HDR=No;FMT=Delimited"";OleDbConnection myConnection = new OleDbConnection(ConStr);// Createa database command on the connection using queryOleDbCommandmyCommand = new OleDbCommand(mySelectQuery, myConnection);// Openthe connection and create the readermyCommand.Connection.Open();OleDbDataReader myReader=myCommand.ExecuteReader(CommandBehavior.CloseConnection);// Column1 is a time value, column 2 is a double// Databindthe reader to the chart using the DataBindX Y methodChart1.Series[0].Points.DataBindX Y(myReader, "1", myReader,"2");// Closeconnection and data readermyReader.Close();myConnection.Close();数组绘图// Initialize an array of doublesdouble[] yval = { 2, 6, 4, 5, 3 };// Initialize an array of stringsstring[] xval = { "Peter", "Andrew", "Julie", "Mary", "Dave" };// Bind the double array to the Y axis points of the Default dataseriesChart1.Series["Series1"].Points.DataBindX Y(xval, yval);数据库9,dataview// Resolve the address to the Access databasestringfileNameString = this.MapPath(".");fileNameString += "..\\..\\..\\data\\chartdata.mdb";//Initialize a connectionstringstringmyConnectionString = "PROVIDER=Microsoft.Jet.OLEDB.4.0;DataSource=" + fileNameString;// Definethe databasequerystringmySelectQuery="SELECT * FROM REPS;";// Createa database connection object using the connectionstringOleDbConnection myConnection = newOleDbConnection(myConnectionString);// Create adatabase command on the connection usingqueryOleDbCommandmyCommand = new OleDbCommand(mySelectQuery, myConnection);// Open theconnectionmyCommand.Connection.Open();//Initializes a new instance of the OleDbDataAdapter classOleDbDataAdapter custDA = new OleDbDataAdapter();custDA.SelectCommand = myCommand;//Initializes a new instance of the DataSet classDataSetcustDS = new DataSet();// Addsrows in the DataSetcustDA.Fill(custDS, "Customers");//Initializes a new instance of the DataView classDataViewfirstView = new DataView(custDS.Tables[0]);// Sincethe DataView implements IEnumerable, pass the dataview directlyinto // the DataBind method with thename of the Columns selected in thequeryChart1.Series["Default"].Points.DataBindX Y(firstView,"Name",firstView, "Sales");// Closesthe connection to the data source. This is the preferred// method of closing any openconnection.myCommand.Connection.Close();指定坐标轴的数据显示范围// Create a new random number generatorRandom rnd = new Random();// Add points to the stock chart seriesfor (int index = 0; index < 10; index++){Chart1.Series["Series1"].Points.AddX Y(rnd.Next(10,90), // X value is a daternd.Next(40,50)); //Close Y value}Chart1.ChartAreas[0].AxisY.Minimum = 40;Chart1.ChartAreas[0].AxisY.Maximum = 50;数据排序// Use point index for drawing the chartChart1.Series["Series1"].I sX ValueIndexed = true;// Sortseries points by second Y valueChart1.DataManipulator.Sort(PointSortOrder.Ascending, "Y2","Series1");查找数据最大值和最小值// Find point with maximum Y value and change colorDataPointmaxValuePoint =Chart1.Series["Series1"].Points.FindMaxValue();maxValuePoint.Color = Color.FromArgb(255, 128, 128);// Findpoint with minimum Y value and change colorDataPointminValuePoint =Chart1.Series["Series1"].Points.FindMinValue();minValuePoint.Color = Color.FromArgb(128, 128, 255);pie显示交互private void Page_Load(object sender, System.EventArgs e){// Addseries to the chartSeriesseries = Chart1.Series.Add("My series");// Setseries and legend tooltipsseries.ToolTip = "#VALX: #VAL{C} million";series.LegendToolTip = "#PERCENT";series.PostBackValue = "#INDEX";series.LegendPostBackValue = "#INDEX";// Populateseries datadouble[] yValues = {65.62, 75.54, 60.45, 34.73, 85.42, 32.12, 55.18, 67.15,56.24, 23.65};string[] xValues = {"France", "Canada", "Germany", "USA", "Italy", "Russia","China", "Japan", "Sweden", "Spain" };series.Points.DataBindX Y(xValues, yValues);// Setseries visual attributesseries.Type= SeriesChartType.Pie;series.ShadowOffset = 2;series.BorderColor = Color.DarkGray;series.CustomAttributes = "LabelStyle=Outside";}protected void Chart1_Click(object sender, ImageMapEventArgse){intpointIndex = int.Parse(e.PostBackValue);Seriesseries = Chart1.Series["My series"];if(pointIndex >= 0 &&pointIndex < series.Points.Count){series.Points[pointIndex].CustomProperties +="Exploded=true";}}chart点击事件/// <summary>/// Page Load event handler./// </summary>protected void Page_Load(object sender, System.EventArgs e){this.Chart1.Click += new ImageMapEventHandler(Chart1_Click);// directusing of PostBackValueforeach(Series series in this.Chart1.Series){series.PostBackValue = "series:" + + ",#INDEX";}// transferof click coordinates. getCoordinates is a javascriptfunction.stringpostbackScript =ClientScript.GetPostBackEventReference(this.Chart1,"chart:@");this.Chart1.Attributes["onclick"] = postbackScript.Replace("@'", "'+ getCoordinates(event)"); }/// <summary>/// Handles the Click event of the Chart1 control./// </summary>/// <param name="sender">The sourceof the event.</param>/// <paramname="e">The<seecref="System.Web.UI.WebControls.ImageMapEventArgs"/>instance containing the eventdata.</param>protected void Chart1_Click(object sender, ImageMapEventArgse){this.Chart1.Titles["ClickedElement"].Text = "Nothing";string[]input = e.PostBackValue.Split(':');if(input.Length == 2){string[] seriesData = input[1].Split(',');if (input[0].Equals("series")){this.Chart1.Titles["ClickedElement"].Text = "Last Clicked Element:" + seriesData[0] + " - Data Point #" + seriesData[1];}else if (input[0].Equals("chart")){// hit test of X and Y click pointHitTestResult hitTestResult=this.Chart1.HitTest(Int32.Parse(seriesData[0]),Int32.Parse(seriesData[1]));if (hitTestResult != null){this.Chart1.Titles["ClickedElement"].Text = "Last Clicked Element:" + hitTestResult.ChartElementType.ToString();}}}}。
MSChart控件这些内容是在学习过程中进行的整理,由于感到书籍资料或软件帮助中有时让人很不容易理解,特制作这个教程,以方便其他朋友学习,从新学习此控件的人的角度来描述相应的属性,相信也能让跟我一样程度的人更容易理解,可能在学习的过程中对某些属性与方法有理解不正确,请各位指正。
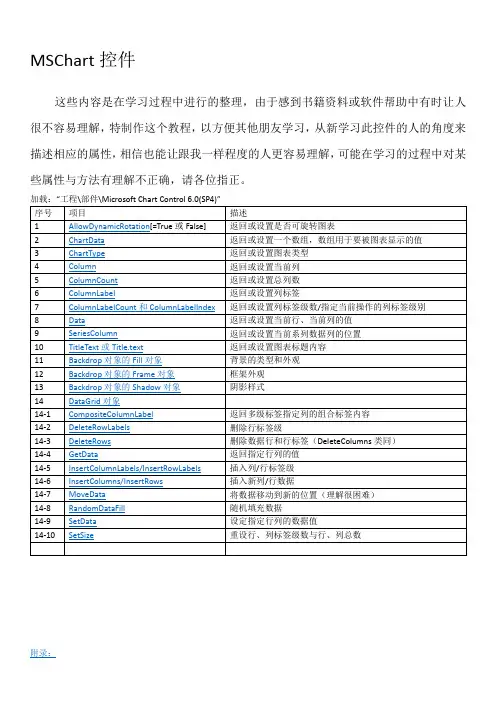
附录:1、AllowDynamicRotation作用:返回或设置是否可旋转图表注:需要图表的ChartType是3d类型才可以,当AllowDynamicRotation=True时,在图表中可按住ctrl+鼠标左键旋转图表。
示例:下列代码在窗体加载时将MSChart1设置为3d柱形图,并允许按住ctrl+鼠标左键旋转。
(窗体上放一个MSChart控件)Private Sub Form_Load()With MSChart1.chartType = VtChChartType3dBar '类型为3d柱形图,类形常数详见附录.AllowDynamicRotation = True '允许旋转End WithEnd Sub下列代码将以对话框的形式返回上面示例的AllowDynamicRotation值:MsgBox MSChart1.AllowDynamicRotation2、ChartData注:书中及软件帮助文档中说到数组需要变体型数值,是指如果要将数组第一个元素作为标题,其他作为数据,那个这个数组既有字符又有数字,那么就需要一个变体形。
如果数组中并不包含标题(或是之后使用属性来赋于标题),那么数组是可以定义类形的,个人建议先给定数组类型,之后再使用属性来设置标题。
作用:设置:将一个数组的数据作表图表的显示数据返回:将图表数据赋给一个数组示例:将数组元素作为图表的显示数据制作一个1行6列的的图表(数组的维代表图表的行,每维的元素代表列)Private Sub Form_Load()Dim 一维数组(1 To 6)'为了表示得更清楚,我们采取逐个赋值的方法一维数组(1) = 1一维数组(2) = 2一维数组(3) = 3一维数组(4) = 4一维数组(5) = 5一维数组(6) = 6With MSChart1.chartType = VtChChartType2dBar '类型为3d柱形图.ChartData = 一维数组()End WithEnd Sub为了理解图表的行列与数组的维数的对应关系,再举例一个二维数组(图表对应就形成2行6列)Private Sub Form_Load()Dim 二维数组(1 To 2, 1 To 6)'为了表示得更清楚,我们采取逐个赋值的方法二维数组(1, 1) = 1二维数组(1, 2) = 2二维数组(1, 3) = 3二维数组(1, 4) = 4二维数组(1, 5) = 5二维数组(1, 6) = 6二维数组(2, 1) = 1二维数组(2, 2) = 2二维数组(2, 3) = 3二维数组(2, 4) = 4二维数组(2, 5) = 5二维数组(2, 6) = 6With MSChart1.chartType = VtChChartType2dBar '类型为2d柱形图.ChartData = 二维数组()End WithEnd Sub下面是将数组的第一个元素设置成字符,使图表加载时将其作为标题的示例:Private Sub Form_Load()Dim 二维数组(1 To 2, 1 To 6)'为了表示得更清楚,我们采取逐个赋值的方法二维数组(1, 1) = "第一行标题"二维数组(1, 2) = 2二维数组(1, 3) = 3二维数组(1, 4) = 4二维数组(1, 5) = 5二维数组(1, 6) = 6二维数组(2, 1) = "第二行标题"二维数组(2, 2) = 5二维数组(2, 3) = 4二维数组(2, 4) = 3二维数组(2, 5) = 2二维数组(2, 6) = 1With MSChart1.chartType = VtChChartType2dBar '类型为2d柱形图.ChartData = 二维数组()End WithEnd Sub最后总结数组元素与维和图表行列的对应关系,作以下关系图:上述例子是将数组的内容反应到图表中,下面我们将使用上面的一维和二维图表,从图表中获得数据给数组,并将数组显示出来以验证结果(我们采取设置一个断点,然后通过视图\本地的方式来查看生成的数组):从图中可以看到,对于我们用2给数组生成的图表,再赋给新的数组时,数组变成了3维,并且每维还多了一个元素用来存储行标签,既“R1”、“R2”,多出来的一维用来存储列标签,既“C1”、“C2”等。

介绍MSChart的常用属性和事件介绍MSChart的常用属性和事件MSChart的元素组成最常用的属性包括ChartAreas:增加多个绘图区域,每个绘图区域包含独立的图表组、数据源,用于多个图表类型在一个绘图区不兼容时。
AlignmentOrientation:图表区对齐方向,定义两个绘图区域间的对齐方式。
AlignmentStyle:图表区对齐类型,定义图表间用以对其的元素。
AlignWithChartArea:参照对齐的绘图区名称。
InnerPlotPosition:图表在绘图区内的位置属性。
Auto:是否自动对齐。
Height:图表在绘图区内的高度(百分比,取值在0-100)Width:图表在绘图区内的宽度(百分比,取值在0-100)X,Y:图表在绘图区内左上角坐标Position:绘图区位置属性,同InnerPlotPosition。
Name:绘图区名称。
Axis:坐标轴集合Title:坐标轴标题TitleAlignment:坐标轴标题对齐方式Interval:轴刻度间隔大小IntervalOffset:轴刻度偏移量大小MinorGrid:次要辅助线MinorTickMark:次要刻度线MajorGrid:主要辅助线MajorTickMark:主要刻度线DataSourceID:MSChart的数据源。
Legends:图例说明。
Palette:图表外观定义。
Series:最重要的属性,图表集合,就是最终看到的饼图、柱状图、线图、点图等构成的集合;可以将多种相互兼容的类型放在一个绘图区域内,形成复合图。
IsValueShownAsLabel:是否显示数据点标签,如果为true,在图表中显示每一个数据值Label:数据点标签文本LabelFormat:数据点标签文本格式LabelAngle:标签字体角度Name:图表名称Points:数据点集合XValueType:横坐标轴类型YValueType:纵坐标轴类型XValueMember:横坐标绑定的数据源(如果数据源为T able,则填写横坐标要显示的字段名称)YValueMembers:纵坐标绑定的数据源(如果数据源为Table,则填写纵坐标要显示的字段名称,纵坐标可以有两个)ChartArea:图表所属的绘图区域名称ChartType:图表类型(柱形、饼形、线形、点形等)Legend:图表使用的图例名称Titles:标题集合。
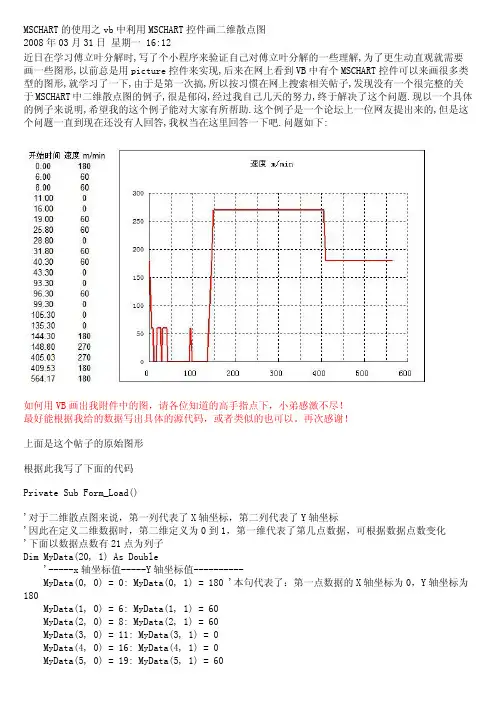
MSCHART的使用之vb中利用MSCHART控件画二维散点图2008年03月31日星期一 16:12近日在学习傅立叶分解时,写了个小程序来验证自己对傅立叶分解的一些理解,为了更生动直观就需要画一些图形,以前总是用picture控件来实现,后来在网上看到VB中有个MSCHART控件可以来画很多类型的图形,就学习了一下,由于是第一次搞,所以按习惯在网上搜索相关帖子,发现没有一个很完整的关于MSCHART中二维散点图的例子,很是郁闷,经过我自己几天的努力,终于解决了这个问题.现以一个具体的例子来说明,希望我的这个例子能对大家有所帮助.这个例子是一个论坛上一位网友提出来的,但是这个问题一直到现在还没有人回答,我权当在这里回答一下吧.问题如下:如何用VB画出我附件中的图,请各位知道的高手指点下,小弟感激不尽!最好能根据我给的数据写出具体的源代码,或者类似的也可以。
再次感谢!上面是这个帖子的原始图形根据此我写了下面的代码Private Sub Form_Load()'对于二维散点图来说,第一列代表了X轴坐标,第二列代表了Y轴坐标'因此在定义二维数据时,第二维定义为0到1,第一维代表了第几点数据,可根据数据点数变化'下面以数据点数有21点为列子Dim MyData(20, 1) As Double'-----x轴坐标值-----Y轴坐标值----------MyData(0, 0) = 0: MyData(0, 1) = 180 '本句代表了:第一点数据的X轴坐标为0,Y轴坐标为180MyData(1, 0) = 6: MyData(1, 1) = 60MyData(2, 0) = 8: MyData(2, 1) = 60MyData(3, 0) = 11: MyData(3, 1) = 0MyData(4, 0) = 16: MyData(4, 1) = 0MyData(5, 0) = 19: MyData(5, 1) = 60MyData(6, 0) = 25.8: MyData(6, 1) = 60MyData(7, 0) = 28.8: MyData(7, 1) = 0MyData(8, 0) = 31.8: MyData(8, 1) = 60MyData(9, 0) = 40.3: MyData(9, 1) = 60MyData(10, 0) = 43.3: MyData(10, 1) = 0MyData(11, 0) = 93.3: MyData(11, 1) = 0MyData(12, 0) = 96.3: MyData(12, 1) = 60MyData(13, 0) = 99.3: MyData(13, 1) = 0MyData(14, 0) = 105.3: MyData(14, 1) = 0MyData(15, 0) = 135.3: MyData(15, 1) = 0MyData(16, 0) = 144.3: MyData(16, 1) = 180MyData(17, 0) = 148.8: MyData(17, 1) = 270MyData(18, 0) = 405.03: MyData(18, 1) = 270MyData(19, 0) = 409.53: MyData(19, 1) = 180MyData(20, 0) = 564.17: MyData(20, 1) = 180'波形图外观设置With MSChart1.TitleText = "速度 m/min"' '设置图线的外观.Plot.SeriesCollection(1).Pen.Width = 30.Plot.SeriesCollection(1).Pen.Style = VtPenStyleSolid' '设置XY轴.Plot.Axis(VtChAxisIdX).ValueScale.Auto = False.Plot.Axis(VtChAxisIdY).ValueScale.Auto = False'// 设置最大值.Plot.Axis(VtChAxisIdX).ValueScale.Maximum = 600.Plot.Axis(VtChAxisIdY).ValueScale.Maximum = 300'// 设置最小值.Plot.Axis(VtChAxisIdY).ValueScale.Minimum = 0.Plot.Axis(VtChAxisIdX).ValueScale.Minimum = 0'//.Plot.Axis(VtChAxisIdX).ValueScale.MajorDivision = 6 'X轴主要网格数量 .Plot.Axis(VtChAxisIdY).ValueScale.MajorDivision = 6 'Y轴主要网格数量 .Plot.Axis(VtChAxisIdX).ValueScale.MinorDivision = 0 'X轴次要网格数量 .Plot.Axis(VtChAxisIdY).ValueScale.MinorDivision = 0 'Y轴次要网格数量 .Plot.Axis(VtChAxisIdX).AxisGrid.MajorPen.Style = VtPenStyleDotted.Plot.Axis(VtChAxisIdY).AxisGrid.MajorPen.Style = VtPenStyleDottedMSChart1.Plot.AutoLayout = FalseMSChart1.Plot.UniformAxis = FalseMSChart1.chartType = VtChChartType2dXY '设置图形为二维散点图MSChart1.ChartData = MyData '数据End WithEnd Sub运行后的效果图如下MSCHART的二维散点图对于实际工作是有很大用途的,例如数据采集中,实现时间变量的曲线等等.希望这个例子对大。

一、概述在数据可视化中,注释是一种重要的功能,它可以帮助用户更清晰地理解图表中的数据,传达更加准确和清晰的信息。
MSChart是微软公司提供的一种图表绘制工具,具有丰富的功能和灵活的应用方式。
本文将介绍MSChart中注释的使用方法,帮助读者更好地利用这一功能进行数据可视化和分析。
二、MSChart注释的基本概念1. MSChart是什么?MSChart是微软公司提供的一种用于绘制图表的工具,它能够生成丰富多样的图表,包括线形图、柱状图、饼图等。
MSChart提供了丰富的功能和参数,能够满足用户在数据可视化方面的需求。
2. 注释在数据可视化中的作用注释是指在图表中添加文字、箭头、线条等元素,用来对图表中某个特定的数据点或趋势进行解释和说明。
注释能够让用户更加直观地理解数据,传达更加有效和清晰的信息。
三、在MSChart中使用注释的方法1. 添加注释在MSChart中,用户可以通过以下步骤添加注释:(1)通过代码:在代码中使用Annotation类的实例来创建并添加注释。
(2)通过设计器:在设计器中选择需要添加注释的图表,右键点击选择“添加注释”,然后在图表上选择需要添加注释的位置,并输入注释内容。
2. 设置注释的样式和格式MSChart提供了丰富的接口和属性来设置注释的样式和格式,包括字体、颜色、格式、位置等。
用户可以根据自己的需求对注释进行定制化设置,使得注释更加符合实际应用场景和用户需求。
3. 对注释进行交互操作在MSChart中,用户可以对注释进行交互操作,包括拖动、调整大小、隐藏、显示等。
这种交互操作能够帮助用户更好地理解数据,并进行更深入的分析和研究。
4. 多种类型的注释除了常见的文字注释外,MSChart还支持添加箭头、线条等元素作为注释,这些不同类型的注释能够更好地帮助用户理解数据,传达更加清晰的信息。
四、注意事项和常见问题1. 注释的数量和位置在使用注释时,需要注意不要添加过多的注释,这会导致图表混乱,影响用户的观感。
代码<asp:Chart ID="Chart1" runat="server"><Series><asp:Series Name="Series1"></asp:Series></Series><ChartAreas><asp:ChartArea Name="ChartArea1"></asp:ChartArea></ChartAreas></asp:Chart>相信在你们看过微软的实例后对这些属性会有一些了解滴..然后进入正题,本文也主要介绍MSChart的折线图,圆饼图,和柱状图, 因为这三种本人感觉是最常用的.对于这三种用MSChart来实现的话本人感觉比较困难的就是数据绑定带来的麻烦,因为在我们平时使用的时候基本都是动态的数据,而微软实例基本都是写死在页面上的数据, 而且网上这方面资料也比较少,只能自己动手实践啦.先介绍几种MSChart的数据绑定方式,第一种,也是最通俗的一种Chart1.DataSource = GetData.GetChartData();Chart1.Series["ChartArea1"].XValueMember = "home";Chart1.Series["ChartArea1"].YValueMembers = "num1";第二种往后都是通过List的集合形式绑定数据,这里就用变量list来代替了.一些变量都是对应实体类的名称当然也对应数据库字段Chart1.DataBindTable(list, "home");"home"是x轴坐标第三种,home 分组,Time X轴坐标,num1 y轴坐标Chart1.DataBindCrossTable(list, "home", "Time", "num1", "Label=num1,ToolTip= num1");第三种,折线图绑定方式Chart1.Series[0].Points.DataBind(list, "home", "num1", "Label=num1,ToolTip=nu m1");第四种,折线图绑定方式代码Chart1.DataBindCrossTable(list, "home", "Time", "num1", "Label=num1,ToolTip= num1");//绘制线条MarkerStyle marker = MarkerStyle.Square;foreach (Series ser in Chart1.Series){ser.ShadowOffset = 1;ser.BorderWidth = 2;ser.ChartType = SeriesChartType.Line;ser.MarkerSize = 12;ser.MarkerStyle = marker;ser.MarkerBorderColor = Color.FromArgb(64, 64, 64);ser.Font = new Font("Trebuchet MS", 8, FontStyle.Regular);marker++;}第五种:Chart1.Series["Series1"].Points.DataBindXY(list, "home", list, "num1"); 我所了解的就这么几种了,有朋友知道有更好的绑定方式不妨贴上代码来.下面介绍下MSChart下的柱形图常用的属性这篇博客都有介绍,在这里我就不罗嗦了../wenjl520/archive/2009/05/16/1458461.html代码//是否启用3D显示Chart1.ChartAreas[0].Area3DStyle.Enable3D = true;//显示类型,可以是柱形折线等等Chart1.Series[0].ChartType = SeriesChartType.Line;//// Draw as 3D CylinderChart1.Series[0]["DrawingStyle"] = "Cylinder";//像素点见宽度Chart1.Series[0]["PointWidth"] = "0.8";//是否显示数值Chart1.Series[0].IsValueShownAsLabel = true;//X轴数据显示间隔Chart1.ChartAreas[0].AxisX.Interval = 1;//直角坐标显示,Chart1.ChartAreas[0].Area3DStyle.IsRightAngleAxes = false;//是否群集在一起Chart1.ChartAreas[0].Area3DStyle.IsClustered = false;//转动X轴角度Chart1.ChartAreas[0].Area3DStyle.Inclination = 40;//转动Y轴角度Chart1.ChartAreas[0].Area3DStyle.Rotation = 20;foreach (Series ser in Chart1.Series){//柱形宽度ser["PixelPointWidth"] = "40";//像素点深度ser["PixelPointDepth"] = "80";//像素点间隙深度ser["PixelPointGapDepth"] = "10";}这些属性都是设置MSChart的外观样式的属性,大家可以尝试修改试试,当然主要的是绑定数据了.所以在调用这些属性时先用上文介绍的几种绑定方式绑定数据.有些属性可能在3D模式下失效或者在2D模式下失效,这是正常现象,效果图:折线图:属性同上..有些属性会在折线图下失效,效果图:圆饼图:代码IList<ChartModel> list = GetData.GetChartDataListByPie();//数值显示百分比形式Chart1.Series["Series1"].Label = "#PERCENT{P}";Chart1.Series["Series1"].Points.DataBind(list, "home", "num1", "Legend Text=home,YValues=num1,ToolTip=num1");Chart1.Series["Series1"].ChartType = System.Web.UI.DataVisualization.Chart ing.SeriesChartType.Pie;Chart1.Series["Series1"].ToolTip = "#LEGENDTEXT: #VAL{C} million";Chart1.ChartAreas["ChartArea1"].Area3DStyle.Enable3D = true;这个比较简单吧..主要是这里的 Chart1.Series["Series1"].Points.DataBind(list, "home", "num1", "LegendText=home,YValues=num1,ToolTip=num1");LegendText整了我半天.这个是显示右侧说明的,开始老是显示不出来,而且还不统一. Legend其实就是右侧显示的说明,但是做过的朋友会发现在柱形图还有折线图如果页面指定了一个<Lengend></Lengend>标签的话,会多显示一个,所以需要在执行绑定的时候写上这么一段代码 Chart1.Series.Clear();。

图表绘制控件mschart的使⽤⽅法1VisualBasic中ActiveX控件MSChart的使⽤⽅法*依⽪提哈尔·穆罕买提,那斯尔江·⼟尔逊(新疆⼤学数学与系统科学学院,乌鲁⽊齐,830046)热依曼·吐尔逊(新疆⼤学信息⼯程学院,乌鲁⽊齐,830046)摘要:本⽂⾸先介绍了VisualBasic(简称VB)中MSChart控件的使⽤⽅法,然后通过简单的例⼦详细介绍了利⽤MSChart控件绘制Excel数据源图表的⽅法。
关键词:VisualBasic;MSChart控件;MicrosoftExcel数据表;图表;数据库The Methods of Using MSChart Control Based on VBIptihar.Muhammat,Nasirjan.Tursun(Mathematics and Systematic Science Institude of XinjiangUniversity,Urumqi,Xinjiang,830046)Reyima.Tursun(Information Science and Engineering Institude of Xinjiang University,Urumqi,Xinjiang,830046)Abstract:This article discusses how to use the MSChart control and how that is used in the VB project to drawing Microsoft? Excel charts.KeyWords: MSChart Control;Chartdata ;Mirosoft Excel Sheets;Chart;Database1. 引⾔Visual Basic中的MSChart控件是⼀个功能强⼤的⾼级图表⼯具,拥有丰富的图表绘制功能,⽤它来可以显⽰⼆维和三维的棒图、区域图、线形图、饼图等多种常⽤图表。
1、MSChart控件的属性(1)ChartType属性:用于设置或返回图表类型,MSChart控件图表类型与对应ChartType属性值如表8.7所示。
如,ChartType=1则显示二维直方图,ChartType=14则显示饼图。
表8.7 MSChart图表类型(2)行(格)属性①RowCount属性:用于表示图表中总格(行)数。
例如:若MSChart控件显示二维数组Array_2(M,N),则总格(行)数RowCount=M。
如:RowCount=5,表示有5格(行)数据。
若MSChart控件显示一维数组Array_1(N)的元素值,则总行数RowCount=1。
②Row属性:用于表示图表中某格(行)的序号。
若MSChart控件显示二维数组Array_2(M,N),则图表中第I格的序号Row=I,当Row=1表示第1格(行)数据。
③RowLabel属性:用于表示格(行)标签名,默认值为Ri。
用户可以修改其值,如改为无锡地区人数、南京地区人数等。
④RowLabelCount属性:用于表示格(行)标签数,MSChart控件允许设置多个格(行)标签。
通常取值为1,当需要用2行以上的标签时,才修改此属性。
⑤RowLabelIndex属性:用于表示格(行)标签序号,用户通过设置不同格(行)标签序号选择不同格(行)标签进行编辑。
(3)列属性①ColumnCount属性:用于表示图表中每格(行)中的列数,即数组中列数N。
如设置ColumnCount=3,则每格(行)中有3列,图表每数据格用3个矩形或3个扇形表示。
②Column属性:用于表示图表中某格(行)某列的列序号,例如:Row=1,Column=1,表示图表中第1格(行)第1列。
③ColumnLabel属性:用于表示图表列标签名,默认为Ci。
④ColumnLabelCount属性:用于表示图表某格中的列标签数。
⑤ColumnLabelIndex属性:用于表示图表某格中的列标签序号。

MSChart使用技巧总结上一篇文章写了用dotnetCHARTING 制作柱形图,折线图和圆饼图园友一直在推荐用微软的MSChart..于是,这几天工作之余研究了一下,其中也发现了不少问题.首先固然需要下载MSChart 下载地址而且微软官方有个很不错的实例代码可以帮助学习使用MSChart 下载地址,当然不用我说.大家也知道的.需要NET Framework 以及配合VS2008 sp1来使用了,至于vs2010好像还没有发现MSChart ,希望有知道的朋友给点帮助.安装完MSChart后在vs2021报表一栏里会出现MSChart控件..二话不说拖到页面.自动生成如下代码:代码<asp:Chart ID="Chart1"runat="server"><Series><asp:Series Name="Series1"></asp:Series></Series><ChartAreas><asp:ChartArea Name="ChartArea1"></asp:ChartArea></ChartAreas></asp:Chart>复制代码相信在你们看过微软的实例后对这些属性会有一些了解滴..然后进入正题,本文也主要介绍MSChart的折线图,圆饼图,和柱状图, 因为这三种本人感觉是最常常利用的.对于这三种用MSChart来实现的话本人感觉比较困难的就是数据绑定带来的麻烦,因为在咱们平时利用的时候大体都是动态的数据,而微软实例大体都是写死在页面上的数据, 而且网上这方面资料也比较少,只能自己动手实践啦.先介绍几种MSChart的数据绑定方式,第一种,也是最通俗的一种= ();["ChartArea1"].XValueMember = "home";["ChartArea1"].YValueMembers = "num1";复制代码第二种往后都是通过List的集合形式绑定数据,这里就用变量list来代替了.一些变量都是对应实体类的名称固然也对应数据库字段(list, "home");"home"是x轴坐标第三种,home 分组,Time X轴坐标,num1 y轴坐标(list, "home", "Time", "num1", "Label=num1,ToolTip=num1");第三种,折线图绑定方式[0].(list, "home", "num1", "Label=num1,ToolTip=num1");第四种,折线图绑定方式代码(list, "home", "Time", "num1", "Label=num1,ToolTip=num1");list, "home", list, "num1");我所了解的就这么几种了,有朋友知道有更好的绑定方式不妨贴上代码来.下面介绍下MSChart下的柱形图常常利用的属性这篇博客都有介绍,在这里我就不罗嗦了..代码= true;hartType = ;sValueShownAsLabel = true;= 1;= false;= false;= 40;= 20;foreach (Series ser in{以在挪用这些属性时先用上文介绍的几种绑定方式绑定数据.有些属性可能在3D模式下失效或在2D模式下失效,这是正常现象,效果图:折线图:属性同上..有些属性会在折线图下失效,效果图:圆饼图:代码IList<ChartModel> list = ();abel = "#PERCENT{P}";["Series1"].(list, "home", "num1", "LegendText=home,YValues=num1,ToolTip=num1"); ["Series1"].ChartType =["Series1"].ToolTip = "#LEGENDTEXT: #VAL{C} million";["ChartArea1"]. = true;复制代码这个比较简单吧..主如果这里的["Series1"].(list, "home", "num1","LegendText=home,YValues=num1,ToolTip=num1");LegendText整了我半天.这个是显示右边说明的,开始老是显示不出来,而且还不统一.Legend其实就是右边显示的说明,可是做过的朋友会发此刻柱形图还有折线图若是页面指定了一个<Lengend></Lengend>标签的话,会多显示一个,所以需要在执行绑定的时候写上这么一段代码可不止可以制作这三种图形,我只是感觉这三种比较常常利用.想在圆饼图中归并几项成显示成其他,弄了半天没弄出来,愁闷,谁知道告知下。
微软图表控件MsChart使用指南昨天在网上看到了微软发布了.NET 3.5框架下的图表控件,第一时间抓下来看了一下,发觉功能很强劲,基本上能想到的图表都可以使用它绘制出来,给图形统计和报表图形显示提供了很好的解决办法,同时支持Web和WinForm两种方式,不过缺点也比较明显,只能在最新的开发环境中使用,需要.Net 3.5 Sp1以及VS 2008的开发环境。
下面是下载地址:mework 3.5)–1.包含英文版,中文版。
上面提供的链接是中文版的,可以更改为英文版。
2.语言包:Microsoft Chart Controls for Microsoft .NETFramework 3.5 Language Pack3.Microsoft .NET Framework 3.5 的Microsoft 图表控件的语言包,包含23中语言。
4.Microsoft Chart Controls Add-on for Microsoft Visual Studio 2008–这个只有英文的,没找到中文的。
5.文档(Microsoft Chart Controls for .NET Framework Documentation)–这个只有英文的,没找到中文的。
6.WinForm 和的例子(Samples Environmentfor Microsoft Chart Controls)–这个只有英文的,没找到英文的。
7.Demo 下载:/mschart下了它的示例程序后,运行了一下,非常的强大,可以支持各种各样的图形显示,常见的:点状图、饼图、柱状图、曲线图、面积图、排列图等等,同时也支持3D样式的图表显示,不过我觉得最有用的功能还是支持图形上各个点的属性操作,它可以定义图形上各个点、标签、图形的提示信息(Tooltip)以及超级链接、Jav ascript动作等,而不是像其它图形类库仅生成一幅图片而已,通过这些,加上微软自己的Ajax框架,可以建立一个可以互动的图形统计报表了。
一、mschart控件使用详解 3.5 ChartAreas控件中的ChartAreas属性是ChartArea对象的集合,ChartArea负责显示容器的属性或图表的背景,由于不止一个,这就意味着MSChart控件可以包含多个图表。
在使用多个ChartAreas时理解下面几点内容非常重要:在技术上可以控制ChartArea的位置,因此多个ChartArea可以叠加,但不推荐这么做,建议在MSChart 控件内的独立区域内绘制它们,为了合并或覆盖数据点,推荐在一个ChartArea内使用多个序列,后面将会有介绍。
默认情况下,控件会为你自动调整大小和位置。
单个ChartArea将会独立调整以适应数据,正如上图所显示的,第二个ChartArea中的Y值更大,数据点也更少。
多个ChartAreas控件允许你使用多个不相容的ChartTypes(序列对象属性,控制图表的显示类型,如条形、柱状和饼状)显示图表,图表任然显示在相同的MSChart控件内。
对于单个ChartArea,有许多独立的属性可以设置和调整,这样你就可以自行调整图表区域以满足不同的需要,它的大部分属性和面板控件的属性都差不多,因此这里我们就不多说了,只说一下ChartArea 唯一的属性,下面是这些唯一属性的清单:3D样式:使用ChartArea的Area3DStyle属性和子属性,我们可以创建漂亮的、十分抢眼的3D图表,无论是在设计器中还是在代码中都必需将Enable3D属性设置为TRUE,其余的参数可以通过调整旋转、视角、照明方式和其它3D元素,让一个图像看起来具有3D效果。
坐标轴控制和样式:坐标轴集合包括x轴和y轴,以及第二个x轴和y轴,这四个项目的属性允许你设置样式、设置标签、定义间隔、设置工具提示、设置缩放等,如果你的图标要求精确的间隔、标签或其它特殊的显示需要,你可以使用这些属性。
例如,你可以颠倒坐标轴的值,或控制如何在x轴上显示标签。
MSChart控件教程MSChart控件这些内容是在学习过程中进行的整理,由于感到书籍资料或软件帮助中有时让人很不容易理解,特制作这个教程,以方便其他朋友学习,从新学习此控件的人的角度来描述相应的属性,相信也能让跟我一样程度的人更容易理解,可能在学习的过程中对某些属性与方法有理解不正确,请各位指正。
附录:1、AllowDynamicRotation作用:返回或设置是否可旋转图表注:需要图表的ChartType是3d类型才可以,当AllowDynamicRotation=True时,在图表中可按住ctrl+鼠标左键旋转图表。
示例:下列代码在窗体加载时将MSChart1设置为3d柱形图,并允许按住ctrl+鼠标左键旋转。
(窗体上放一个MSChart控件)Private Sub Form_Load()With MSChart1.chartType = VtChChartType3dBar '类型为3d柱形图,类形常数详见附录.AllowDynamicRotation = True '允许旋转End WithEnd Sub下列代码将以对话框的形式返回上面示例的AllowDynamicRotation值:MsgBox MSChart1.AllowDynamicRotation2、ChartData注:书中及软件帮助文档中说到数组需要变体型数值,是指如果要将数组第一个元素作为标题,其他作为数据,那个这个数组既有字符又有数字,那么就需要一个变体形。
如果数组中并不包含标题(或是之后使用属性来赋于标题),那么数组是可以定义类形的,个人建议先给定数组类型,之后再使用属性来设置标题。
作用:设置:将一个数组的数据作表图表的显示数据返回:将图表数据赋给一个数组示例:将数组元素作为图表的显示数据制作一个1行6列的的图表(数组的维代表图表的行,每维的元素代表列)Private Sub Form_Load()Dim 一维数组(1 To 6)'为了表示得更清楚,我们采取逐个赋值的方法一维数组(1) = 1一维数组(2) = 2一维数组(3) = 3一维数组(4) = 4一维数组(5) = 5一维数组(6) = 6With MSChart1.chartType = VtChChartType2dBar '类型为3d柱形图.ChartData = 一维数组()End WithEnd Sub为了理解图表的行列与数组的维数的对应关系,再举例一个二维数组(图表对应就形成2行6列)Private Sub Form_Load() Dim 二维数组(1 To 2, 1 To 6)'为了表示得更清楚,我们采取逐个赋值的方法二维数组(1, 1) = 1二维数组(1, 2) = 2二维数组(1, 3) = 3二维数组(1, 4) = 4二维数组(1, 5) = 5二维数组(1, 6) = 6二维数组(2, 1) = 1二维数组(2, 2) = 2二维数组(2, 3) = 3二维数组(2, 4) = 4二维数组(2, 5) = 5二维数组(2, 6) = 6With MSChart1.chartType = VtChChartType2dBar '类型为2d柱形图.ChartData = 二维数组()End WithEnd Sub下面是将数组的第一个元素设置成字符,使图表加载时将其作为标题的示例:Private Sub Form_Load()Dim 二维数组(1 To 2, 1 To 6)'为了表示得更清楚,我们采取逐个赋值的方法二维数组(1, 1) = "第一行标题"二维数组(1, 2) = 2二维数组(1, 3) = 3二维数组(1, 4) = 4二维数组(1, 5) = 5二维数组(1, 6) = 6二维数组(2, 1) = "第二行标题"二维数组(2, 2) = 5二维数组(2, 3) = 4二维数组(2, 4) = 3二维数组(2, 5) = 2二维数组(2, 6) = 1With MSChart1.chartType = VtChChartType2dBar '类型为2d柱形图.ChartData = 二维数组()End WithEnd Sub最后总结数组元素与维和图表行列的对应关系,作以下关系图:上述例子是将数组的内容反应到图表中,下面我们将使用上面的一维和二维图表,从图表中获得数据给数组,并将数组显示出来以验证结果(我们采取设置一个断点,然后通过视图\本地的方式来查看生成的数组):从图中可以看到,对于我们用2给数组生成的图表,再赋给新的数组时,数组变成了3维,并且每维还多了一个元素用来存储行标签,既“R1”、“R2”,多出来的一维用来存储列标签,既“C1”、“C2”等。
如何使用MsChart?MsChart是微软出品的一款功能强大的制作图表工具,用它可以很方便的建立各种图表。
下面我们举例来说明:submitinfo.asp' 发送数据程<HTML><HEAD><META NAME="GENERA TOR" Content="Microsoft Visual Studio 6.0"></HEAD><BODY><form method=post name="form1" action=mschart.asp><INPUT type="submit" value="发送" id=submit1 name=submit1><input type="hidden" value="宋英特的童年记录" name=chtitle><input type="hidden" value=3 name=rcount>' rcount 列数<input type="hidden" value=2 name=ccount>' ccount 行数<input type="hidden" value=1 name=rc_type><input type="hidden" value="1998" name=rname>' rname 列名数组<input type="hidden" value="1999" name=rname><input type="hidden" value="2000" name=rname><input type="hidden" value="身高" name=cname>' cname 行名数组<input type="hidden" value="体重" name=cname><input type="hidden" value=72 name=rc_data>' rc_data 数据<input type="hidden" value=75 name=rc_data><input type="hidden" value=78 name=rc_data><input type="hidden" value=81 name=rc_data><input type="hidden" value=84 name=rc_data><input type="hidden" value=89 name=rc_data></form></BODY></HTML>mschart.asp' 显示数据程序<%@ Language=VBScript %><HTML><HEAD><META NAME="GENERA TOR" Content="Microsoft Visual Studio 6.0"> <SCRIPT ID=clientEventHandlersJS LANGUAGE=javascript><!--function window_onload() {t=0;mschart1.TitleText = document.form1.chtitle.value;mschart1.ShowLegend =true;mschart1.ColumnCount =ount.value;mschart1.RowCount =document.form1.rcount.value;for (i=0;i<document.form1.rcount.value;i++){for (j=0;j<ount.value;j++){ mschart1.Row=i+1;mschart1.Column=j+1;if (ount.value>1)mschart1.ColumnLabel =ame(j).value;elsemschart1.ColumnLabel =ame.value;if ((document.form1.rcount.value*ount.value)>1) mschart1.Data=document.form1.rc_data(t).value;elsemschart1.Data=document.form1.rc_data.value;t++;}if (document.form1.rcount.value>1)mschart1.RowLabel =document.form1.rname(i).value ;elsemschart1.RowLabel =document.form1.rname.value ;}}function select1_onchange() {mschart1.chartType =select1.valuemschart1.Plot}//--></SCRIPT><TITLE>精彩春风之图表显示</TITLE></HEAD><BODY LANGUAGE=javascript onload="return window_onload()"><---此处插入mschart activex控件---><BR>MsChart显示方式<SELECT id=select1 name=select1 LANGUAGE=javascript onchange="return select1_onchange()"><OPTION value=1>二维直方图</OPTION><OPTION value=0>三维直方图</OPTION><OPTION value=3>二维折线图</OPTION><OPTION value=2>三维折线图</OPTION><OPTION value=5>二维面积图</OPTION><OPTION value=4>三维面积图</OPTION><OPTION value=14>饼图</OPTION></SELECT><form name=form1 id=form1><% for i=1 to Request.Form("rcount")%><input type="hidden" name=rname id=rname value=<%=Request.Form("rname")(i)%>> <%next%><% for i=1 to Request.Form("ccount")%><input type="hidden" name=cname id=cname value=<%=Request.Form("cname")(i)%>> <%next%><input type="hidden" name=rcount id=rcount value=<%=Request.Form("rcount")%>><input type="hidden" name=chtitle id=chtitle value=<%=Request.Form("chtitle")%>>' chtitle 标题<input type="hidden" name=ccount id=ccount value=<%=Request.Form("ccount")%>> <%if Request.Form("rc_type")=1 then%>' rc_type 排列方式(1 以行方式,2以列方式)<%for i=1 to Request.Form("rcount")*Request.Form("ccount")%><input type="hidden" name=rc_data id=rc_data value=<%=Request.Form("rc_data")(i)%>> <%next%><%else%><%for j=1 to Request.Form("rcount")%><%for i=1 to Request.Form("ccount")%><input type="hidden" name=rc_data id=rc_data value=<%=Request.Form("rc_data")((i-1)*Request.Form("rcount")+j)%>> <%next%> <%next%> <%end if%> </form></BODY> </HTML>。
Step 1 : Creating the ProjectStart Visual C++ en create a simple dialog based application labelled "Graph"Step 2 : Add the MSChart OCX to Your ProjectSelect "project menu" option and select "Components and contols" and then choose the MSChart component en click "add"Step 3 : Add the MSChart OCX to Your DialogSelect resources view tab en open the main dialog (It’s a simple dialog based application). Drop the ocx on your dialog.Now, label your Chart "IDC_MSCAHRT1"Now, choose menu option "Classwizard" to create a member variable of your chart labelled "m_Chart"Step 4: Add the CodeNow add a bouton labeled "Go" to your dialog. Double click it to edit the code and add the following code in the On_Go function:COleSafeArray saRet;DWORD numElements[] = {10, 10}; // 10x10// Create the safe-array...saRet.Create(VT_R8, 2, numElements);// Initialize it with values...long index[2];for(index[0]=0; index[0]<10; index[0]++) {for(index[1]=0; index[1]<10; index[1]++) {double val = index[0] + index[1]*10;saRet.PutElement(index, &val);}}// Return the safe-array encapsulated in a V ARIANT...m_Chart.SetChartData(saRet.Detach());m_Chart.Refresh;Step 5: Building and Running the ApplicationBuild and execute your app, then click the "Go" button. Here is the result:。
介绍MSChart的常用属性和事件MSChart的元素组成最常用的属性包括ChartAreas:增加多个绘图区域,每个绘图区域包含独立的图表组、数据源,用于多个图表类型在一个绘图区不兼容时。
AlignmentOrientation:图表区对齐方向,定义两个绘图区域间的对齐方式。
AlignmentStyle:图表区对齐类型,定义图表间用以对其的元素。
AlignWithChartArea:参照对齐的绘图区名称。
InnerPlotPosition:图表在绘图区内的位置属性。
Auto:是否自动对齐。
Height:图表在绘图区内的高度(百分比,取值在0-100)Width:图表在绘图区内的宽度(百分比,取值在0-100)X,Y:图表在绘图区内左上角坐标Position:绘图区位置属性,同InnerPlotPosition。
Name:绘图区名称。
Axis:坐标轴集合Title:坐标轴标题TitleAlignment:坐标轴标题对齐方式Interval:轴刻度间隔大小IntervalOffset:轴刻度偏移量大小MinorGrid:次要辅助线MinorTickMark:次要刻度线MajorGrid:主要辅助线MajorTickMark:主要刻度线DataSourceID:MSChart的数据源。
Legends:图例说明。
Palette:图表外观定义。
Series:最重要的属性,图表集合,就是最终看到的饼图、柱状图、线图、点图等构成的集合;可以将多种相互兼容的类型放在一个绘图区域内,形成复合图。
IsValueShownAsLabel:是否显示数据点标签,如果为true,在图表中显示每一个数据值Label:数据点标签文本LabelFormat:数据点标签文本格式LabelAngle:标签字体角度Name:图表名称Points:数据点集合XValueType:横坐标轴类型YValueType:纵坐标轴类型XValueMember:横坐标绑定的数据源(如果数据源为Table,则填写横坐标要显示的字段名称)YValueMembers:纵坐标绑定的数据源(如果数据源为Table,则填写纵坐标要显示的字段名称,纵坐标可以有两个)ChartArea:图表所属的绘图区域名称ChartType:图表类型(柱形、饼形、线形、点形等)Legend:图表使用的图例名称Titles:标题集合。
width:MSChart的宽度。
height:MSChart的高度。
常用事件:Series1.Points.DataBind()绑定数据点集合,如果要在一个MSChart控件的一个绘图区(ChartArea)内添加多个不同数据源的图表,就用这个主动绑定数据集合的方法。
可以将表中指定字段的值绑定到指定的坐标轴上。
MSChart1.DataBind()给整个MSChart绑定一个数据源,该MSChart中的图表全部可以使用该数据源作为统计来源。
示例:private void BindGrid(){chart2.Width = 800;chart2.Height = 600;//作图区的显示属性设置//chart2.ChartAreas["ChartArea1"].AxisX.IsMarginVisible = false;//chart2.ChartAreas["ChartArea1"].Area3DStyle.Enable3D = false;//背景色设置chart2.ChartAreas["ChartArea1"].ShadowColor = Color.Transparent; chart2.ChartAreas["ChartArea1"].BackColor = Color.FromArgb(209, 237, 254); //该处设置为了由天蓝到白色的逐渐变化chart2.ChartAreas["ChartArea1"].BackGradientStyle =GradientStyle.TopBottom;chart2.ChartAreas["ChartArea1"].BackSecondaryColor = Color.White;//X,Y坐标线颜色和大小chart2.ChartAreas["ChartArea1"].AxisX.LineColor = Color.FromArgb(64, 64, 64, 64);chart2.ChartAreas["ChartArea1"].AxisY.LineColor = Color.FromArgb(64, 64, 64, 64);chart2.ChartAreas["ChartArea1"].AxisX.LineWidth = 2;chart2.ChartAreas["ChartArea1"].AxisY.LineWidth = 2;chart2.ChartAreas["ChartArea1"].AxisX.Title = "时间";chart2.ChartAreas["ChartArea1"].AxisY.Title = "灰量";//中间X,Y线条的颜色设置chart2.ChartAreas["ChartArea1"].AxisX.MajorGrid.LineColor =Color.FromArgb(64, 64, 64, 64);chart2.ChartAreas["ChartArea1"].AxisY.MajorGrid.LineColor =Color.FromArgb(64, 64, 64, 64);//X.Y轴数据显示间隔chart2.ChartAreas["ChartArea1"].AxisX.Interval = 1.0; //X轴数据显示间隔chart2.ChartAreas["ChartArea1"].AxisX.IntervalType = DateTimeIntervalType.Days;chart2.ChartAreas["ChartArea1"].AxisX.IntervalOffset = 0.0;chart2.ChartAreas["ChartArea1"].AxisX.IntervalOffsetType = DateTimeIntervalType.Days;chart2.ChartAreas["ChartArea1"]belStyle.Format = "M-d";chart2.ChartAreas["ChartArea1"].AxisY.Interval = 200;//y轴数据显示间隔//X轴线条显示间隔//chart2.ChartAreas["ChartArea1"].AxisX.MajorGrid.IntervalType = DateTimeIntervalType.Hours;chart2.Palette = ChartColorPalette.Pastel;string sql = "select sum(zhl) zhl, input_date, ash_type_name from (" + " select sum(t.second_load - t.first_load) as zhl," +" to_date(to_char(t.input_date, 'dd/mm/yyyy')||'00:00','dd/mm/yyyyhh24:mi:ss') as input_date," +" u.ash_type_name" +" from transportation_bill t, ash_type u" +" where t.ash_type_id = u.ash_type_id" +" and (t.input_date between to_date('2009-6-11','yyyy-mm-dd') andto_date('2009-6-20','yyyy-mm-dd'))" +//此处加按日期查询的条件" and t.sale_organization_id = 1" +//此处加用户所在机构查询条件" group by u.ash_type_name, t.input_date" +" order by t.input_date" +")" +" group by ash_type_name,input_date" +" order by input_date";DataTable dt2 =OracleHelper.ExecuteDataTable(OracleHelper.ConnectionString, CommandType.Text, sql, "T", null);chart2.DataBindCrossTable(dt2.DefaultView, "ash_type_name","input_date", "zhl", "", PointSortOrder.Ascending);foreach (Series sr in chart2.Series){sr.ChartType = SeriesChartType.Spline;sr.XValueType = ChartValueType.Date;sr.MarkerStyle = MarkerStyle.Circle;//散点样式sr.MarkerSize = 5;//默认是5,散点大小sr.MarkerStep = 1;//默认是1,散点频率sr.MarkerColor = 1;//默认是透明,散点颜色sr.BorderWidth = 2;}//chart2.Legends["Default"].Docking = Docking.Left;}。