TracePro中文使用手册(上)
- 格式:pdf
- 大小:10.23 MB
- 文档页数:70
TracePro 表面光源生成器的使用实例1-获取LED光谱数据TracePro 的光源形式有三种:网格光源、表面光源和文件光源。
TracePro的表面光源中有一个光源特性类别,其中涵盖了常用的CREE OSRMA Philips等常见的LED光源库。
表面光源特性生成器简介这个数据库及其使用方式为我们带来了很大的方便。
但是在实际工作中总是会遇到特殊的光源数据。
此时我们就要用到TracePro 的表面光源生成器插件来手动生成光源特性数据。
这个插件就是Surface Source Property Generator,下面是详细的使用教程。
此例中我们使用CREE Xlamp XP-G LED为例。
下载XP-G LED的光源规格书首先,下载XP-G LED的光源规格书。
我们从规格书中获取LED光谱和光强配光曲线。
文件下载链接:/modules/wfdownloads/singlefile.php?cid=5&lid=17目前在TracePro的光源特性数据中是没有XP-G光源数据的,如下图所示:因此需要借助表面光源生成插件来将XP-G的光源数据加入到TracePro的光源特性文件中。
打开Surface Source Property Generator插件打开Surface Source Property Generator插件。
插件整体界面。
首先,我们需要获取LED的光谱特性数据。
针对XP-G型号的光源,我们以5000K~8300K 为例。
光谱曲线导入方法从规格书中获取蓝色曲线为其光谱图。
将此图片复制并粘贴到插件的波长编辑器中。
点击波长编辑器右下角的helper按钮展开光谱图形识别窗口。
光谱曲线定位开始进行光谱数据识别前,需要定义两个坐标点,即矩形窗口的左下角及右上角所代表的数据点。
点击Set Ref 1,然后点击矩形窗口左下角即可看到一个蓝色的圈,此点代表波长为400nm 相对强度为0。
将第二坐标修改为对应0.75 和1。
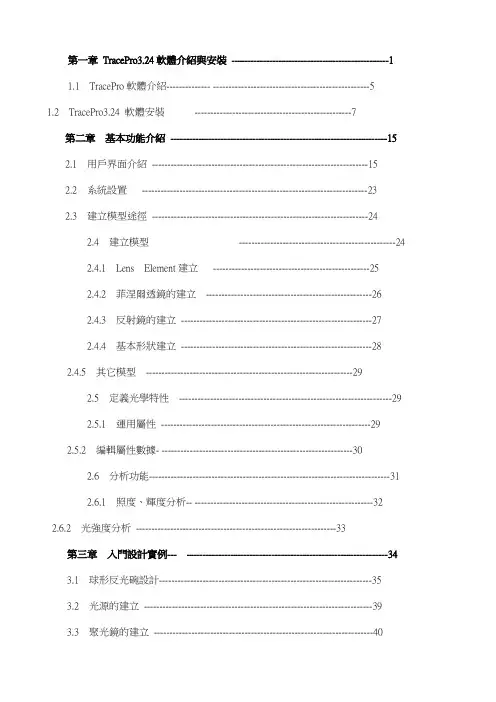
第一章TracePro3.24軟體介紹與安裝--------------------------------------------------11.1 TracePro軟體介紹-------------- --------------------------------------------------51.2 TracePro3.24 軟體安裝--------------------------------------------------7第二章基本功能介紹---------------------------------------------------------------------152.1 用戶界面介紹---------------------------------------------------------------------152.2 系統設置------------------------------------------------------------------------232.3 建立模型途徑---------------------------------------------------------------------242.4 建立模型--------------------------------------------------242.4.1 Lens Element建立--------------------------------------------------252.4.2 菲涅爾透鏡的建立-----------------------------------------------------262.4.3 反射鏡的建立-------------------------------------------------------------272.4.4 基本形狀建立-------------------------------------------------------------282.4.5 其它模型------------------------------------------------------------------292.5 定義光學特性--------------------------------------------------------------------292.5.1 運用屬性-------------------------------------------------------------------292.5.2 編輯屬性數據- -------------------------------------------------------------302.6 分析功能-----------------------------------------------------------------------------312.6.1 照度、輝度分析-- ---------------------------------------------------------322.6.2 光強度分析----------------------------------------------------------------33第三章入門設計實例--- ----------------------------------------------------------------343.1 球形反光碗設計--------------------------------------------------------------------353.2 光源的建立-------------------------------------------------------------------------393.3 聚光鏡的建立----------------------------------------------------------------------403.4 菲涅爾透鏡的建立-----------------------------------------------------------------423.4.1焦距為120mm的菲涅爾透鏡的建立-----------------------------------433.4.2焦距為185mm的菲涅爾透鏡的建立-------------------------------------463.5 液晶屏的建立-----------------------------------------------------------------------483.6 投影鏡頭的建立--------------------------------------------------------------------503.7 LCD投影機光學系統的建立---------------------------------------------------56第四章進階設計實例----------------------------------------------------------------------624.1 導光管設計-------------------------------------------------------------------------624.2 背光源設計-------------------------------------------------------------------------794.2.1背光源技術介紹--------------------------------------------------------------794.2.2設計背光源--------------------------------------------------------------------90第一章︰TracePro軟體介紹與安裝1.1 TracePro軟體介紹TracePro 是一套能進行常規光學分析、設計照明系統、分析輻射度和亮度的軟體。


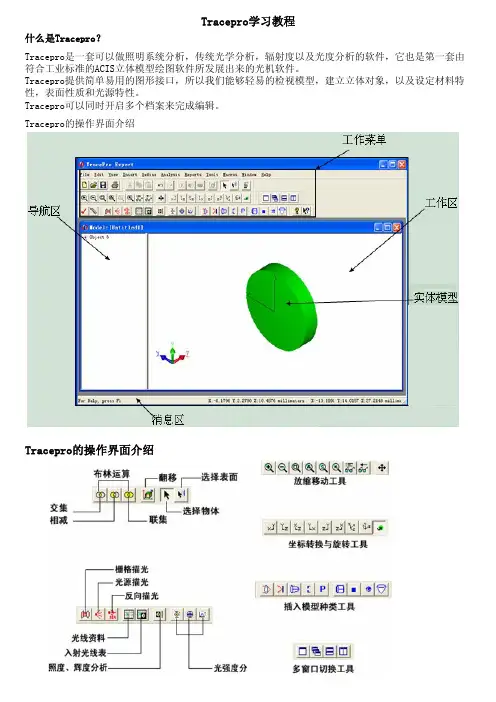
Tracepro的操作界面介绍Tracepro学习教程什么是Tracepro?Tracepro是一套可以做照明系统分析,传统光学分析,辐射度以及光度分析的软件,它也是第一套由符合工业标准的ACIS立体模型绘图软件所发展出来的光机软件。
Tracepro提供简单易用的图形接口,所以我们能够轻易的检视模型,建立立体对象,以及设定材料特性,表面性质和光源特性。
Tracepro可以同时开启多个档案来完成编辑。
Tracepro的操作界面介绍Tracepro的操作设置View>Preference此处可以设置Tracepro操作界面中显示方面的参数,如界面的显示单位,缩放时的倍率,显示光线的颜色,方式等等。
Tracepro的系统设置View>Customize此处可以设置Tracepro操作界面中运行方面的参数,如导航区的位置,模型的显示方式,模型的颜色,背景的颜色等等。
Tracepro模拟步骤1、建立模型;2、光学特性;3、光源设定;4、分析功能Tracepro建模Tracepro自建模1、利用Tracepro软件本身的功能建立各种模型2、面 平面 曲面 球面 非球面3、体 球体 正方体 椎体 环3D建模,导入 在PRO/E,UG,CAD等3D模型软件将实体建好,存igs,sat,stp等格式,导入Tracepro并设置属性后,就可进行模拟。
光学软件建模Tracepro与很多光学模拟软件如ZEMAX,OSLO,Code V等是共用的,所以可以直接用Tracepro打开这些软件保存的文档。
Tracepro建模Tracepro自建模Tracepro软件本身提供了一个强大的模型库,使用者可以根据自己的需要选择不同的模块来建立模型。
其路径就是:Insert>要点:Tracepro建模:Insert> Reflector A.反射器的类型B.反射器的焦距C.反射器的长度D.反射器的位置Tracepro建模:Insert> Baffle VaneTracepro建模:3D建模,导入Tracepro在建模方面有很强大的功能,但是在自由曲面方面仍存在一些不足,所以,就需要在3D软件中建好模型后,存igs,sat,stp等格式,最后导入Tracepro中。
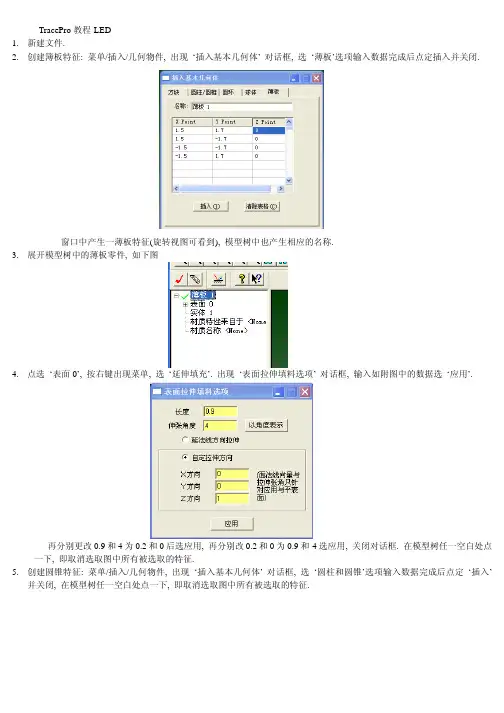
TracePro教程-LED1.新建文件.2.创建簿板特征: 菜单/插入/几何物件, 出现‘插入基本几何体’ 对话框, 选‘薄板’选项输入数据完成后点定插入并关闭.窗口中产生一薄板特征(旋转视图可看到), 模型树中也产生相应的名称.3.展开模型树中的薄板零件, 如下图4.点选‘表面0’, 按右键出现菜单, 选‘延伸填充’. 出现‘表面拉伸填料选项’ 对话框, 输入如附图中的数据选‘应用’.再分别更改0.9和4为0.2和0后选应用, 再分别改0.2和0为0.9和-4选应用, 关闭对话框. 在模型树任一空白处点一下, 即取消选取图中所有被选取的特征.5.创建圆锥特征: 菜单/插入/几何物件, 出现‘插入基本几何体’ 对话框, 选‘圆柱和圆锥’选项输入数据完成后点定‘插入’并关闭, 在模型树任一空白处点一下, 即取消选取图中所有被选取的特征.6.进行布尔运算: 在模型树中先选‘薄板 1’, 再按住Ctrl键选‘圆锥 1’. 菜单/编辑/布林运算/差集.7.慢速点选模型树中‘薄板 1’ 两次, 改名为 ‘Package’. 在模型树任一空白处点一下, 即取消选取图中所有被选取的特征.8.创建圆柱特征做散光板: 菜单/插入/几何物件, 出现‘插入基本几何体’ 对话框, 选‘圆柱和圆锥’选项输入数据完成后点‘插入’ 并关闭. 在模型树任一空白处点一下, 即取消选取图中所有被选取的特征.9.创建方块特征做LED: 菜单/插入/几何物件, 出现‘插入基本几何体’ 对话框, 选‘方块’选项输入数据完成后点‘插入’ 并关闭. 在模型树任一空白处点一下, 即取消选取图中所有被选取的特征.10.关键的来了, 设置三部曲:首先, 在模型树选取散光板特征(不是选展开后的某一面), 定义散光板的材质属性, 菜单/定义/编辑材质/表面材质, 出现对话框, 左侧选‘新增特性’ 按钮, 又出现‘输入一个新的表面特性’ 对话框, 如图设置并确定.然后, 将‘吸收率’ 设置为0, 将‘求解’ 设置为 BTDF, 按保存, 如下图:会自出现 ‘BTDF 符合能量守恒’ 的提示, 按确定后关闭, 再关闭‘表面材质编辑器’ 对话框.选择模型树中的 ‘Diffuser’按右边加号展开, 选择‘表面 1’, 也就是散光板的内侧, 然后按右键, 选菜单中的‘属性’,出现‘应用特性’对话框, 按下图设置后按‘应用’ 并关闭.12.第三步设置 ‘Package’ 上的凹槽的面属性.选择模型树中的 ‘Package’按右边加号展开, 选择‘表面0和表面 1’, 也就是凹槽的底面和侧面, 然后按右键, 选菜单中的‘属性’, 出现‘应用特性’对话框, 按下图设置后按‘应用’ 并关闭. 在模型树任一空白处点一下, 即取消选取图中所有被选取的特征.13.菜单/分析/光线追迹选项, 出现‘光线追迹选项’ 对话框, 照下图输入内容后‘应用/关闭’.14.设置LED光源:选择模型树中LED展开, 选择‘表面 0’ 即LED上表面, 右键出‘应用特性’ 对话框, 设置表面光源后按‘应用/关闭’.15.一切模型都设置完必, 就待分析了.16.菜单/开始光线追踪, 出现‘光线追踪’对话框, 选择追迹光线按钮/应用/关闭.17.菜单/分析/Candela Plots选项, 出现 ‘Candela选项’ 对话框, 选‘方位与光线’选项, 输入数据/应用.再选Candela 分布选项, 输入数据/应用/关闭.18.菜单/分析/Candela Plots/Polar Candela Distribution.。
基本参数:型面为抛物面,聚光面积为72m 2,开口直径D=9577mm ,焦距f=7500mm 。
抛物面方程为 Z Y X 3022=+,聚光器共分为12块,每块间距为20mm 。
中心开口半径为100mm 。
接收平面半径为100mm 。
操作过程如下:(1) 打开软件双击快捷方式打开软件,出现如下的对话框,选择Standard 即可满足要求。
(2) 建立模型在菜单栏中选择Insert Reflector ,弹出Insert Reflector 对话框,选择Conic 选项,其中Shape 共分四种:球面、抛物面、椭圆面和双曲面。
在本例中聚光器型面为抛物面,所以选择Parabolic 。
此外其它的一些设置可以按上面的基本参数的要求填写,如下面对话框所示,填写完毕后点击Insert 按钮。
这样就建立了一个厚度为2mm 、焦距为7500mm 、开口直径为9577mm 、中间孔洞半径为100mm 、中心坐标为(0,0,0)的抛物面聚光器,如下右图所示。
要想从不同角度观察模型,可以从通过以下菜单进行操作。
其中和按钮比较常用,为全局放大,为对模型进行旋转观测。
要想观测模型的不同效果可以点击菜单栏View选项,有Silhouettes、Render、Wireframe、Hidden Line四个选项可供选择。
(3)分割聚光器按要求聚光器共分为12块,每块间距为20mm。
此处应用布尔运算对聚光器进行分割。
首先创建X向尺寸为10000mm(要比聚光器的开口直径大一些),Y向尺寸为20mm(为每块聚光镜的间距尺寸),Z向尺寸为5000mm(要比聚光器开口深度略大)的薄板,具体参数设置如下对话框所示。
薄板创建完成后,点击鼠标右键,出现下拉菜单,选择Rotate选项,对应弹出Rotation Selection 对话框,按对话框中参数填写完成按Copy按钮。
此操作共进行5次。
最终完成结果图如下所示。
Ctrl键加鼠标左键依次选择抛物镜面和各个薄板,点击鼠标右键,选择Subtract选项,对其进行布尔减运算。
TracePro交互式优化⼯具使⽤说明1.Introduction1.IntroductionTracePro?Interactive Optimizerhelps users generate and also accomplish the optimization process of the Optical Elements and whole system-quickly and accurately.It provides a convenient and intuitional user interface to create radial free-form optical element(s).While useful for luminaire design,this tool can also be used to optimize LED second optics,reflective optics,projector system,solar concentrator and any other optical system needed optimization.The utility is for use with all TracePro editions and requires the most recent release of TracePro7.0and Microsoft Windows XP or later version.For more information on TracePro,or if you need technical support,please contact Lambda Research Corporation.About Lambda Research CorporationFounded in1992,Lambda Research Corporation is a privately held company based in Littleton,/doc/8b19926bcaaedd3383c4d3ad.html mbda provides optics software and services for government and industry worldwide.The company is an industry pioneer in the areas of stray light analysis,optical system design and analysis,scattering theory,optical testing,process control software and custom software development.Technical SupportIf you are having trouble with TracePro or have questions,please contact your distributor or Lambda Research Corporationdirectly.Technical support is available to customers with current support contracts.Additional information is also available via:the World Wide Web at /doc/8b19926bcaaedd3383c4d3ad.htmlthe user to user e-mail list tracepro-talkthe new version e-mail list tracepro-updatesTo subscribe to one of the e-mail lists,submit a request online at /doc/8b19926bcaaedd3383c4d3ad.html/lists/listinfo.You can call us between the hours of9:00am and5:30p.m.(U.S.Eastern Time)Monday through Friday or reach us by e-mail.Lambda Research Corporation25Porter RoadLittleton MA01460Phone:(978)486-0766Fax:(978)486-0755support@/doc/8b19926bcaaedd3383c4d3ad.html2.Getting Started2.Getting StartedInteractive optimizer offers an intuitive graphical user interface.Its multi-window design makes it easy to initiate a prototype design and monitor the optimization process with the instant simulation data returned from TracePro.This manual generally assumes a working knowledge of Windows.When Interactive Optimizer launched,a MDI window is initiated for starting a new optimization plan.The Interactive Optimizer user interface consists of:Profile editor windowToolbox panelProperty windowExport panelOptimization control panelOptimization logOptions panelBelow you can find instructions for some of the most basic Surface Source Property Generator operation More:Profile editor windowToolbox panelProperty windowExport panelOptimization control panelOptimization logOptions panel2.1Interactive Optimizer InterfaceInteractive Optimizer is a pure graphical user interface application.It helps users generate many kinds of freeform geometry and simulate its optical system performance in TracePro?.Furthermore it manipulates TracePro?to accomplish the optimization through DDE channel.To understand the interfaces of Interactive Optimizer,a simple description about each child windows are necessary,they are:3.Interactive Profile EditorOptical designers always have a lot of brilliant ideas to create optical systems.The optics geometry shape that they want to use in their system it’s not a primitive geometry,like sphere or block.Thus,how to create a desired geometry shape is an important issue.Even some people can’t100%simulate their optical system in TracePro,just because of complicate model creating problem.And here,Interactive Optimizer can help designer create their complicate optical components quickly and accurately.Interactive Optimizer provides Interactive Profile Drawer to easily create geometry.In Drawer,user can use straight line and spline to draw an enclosed loop to represent geometry’s profile.And without limiting the number of node point,the profile can fully matches use’s desire.The finished profile can be directly export to TracePro as a3D solid object.Or this profile can be the initial design of a system optimization process.Furthermore,it provides real-time2D raytrace function to speed up create a better initial design.There are a lot of features,such like drawing profile,raytrace,paste background bitmap and so on,that are included in Interactive Profile Drawer.So,for convenient operation,there is an independent“Toolbox”panel to switch Profile Drawer to different function.More:Interactive Profile Drawer-SegmentInteractive Profile Drawer-ObjectInteractive Profile Drawer-RaysInteractive Profile Drawer-Bitmap3.1Segment ModeAdd Segment/Control PointTo add a segment/control point into the segment,first right-click on the wanted position of the segment and then click on the"Add Segment/Control Pont"command from the pop-up menu.Delete Segment/Control PointRight-click on the wanted segment/control point and then click on the"Delete"command from the pop-up menu.Segment Type SelectionRight-click on the interested segment and then choose the wanted segment type from the pop-up menu. Now there are five segment types provided:Line:Straight line is used to connect the two adjacent segment points.Spline:Spline curve is used to fit the control points between the two adjacent segment points.Sphere:Spherical curve is used to connect the center control point and the two adjacent segment points.Ellipse:Elliptical curve is used to connect the center control point and the two adjacent segment points.Conic:Conic curve is used to fit the control points and the two adjacent segment points.Adjust Object ShapeThe shape of the object can be modified by dragging the segment/control points among the segments. 3.2Object ModeAddRight-click on the editing area to determine the center position height of the new object.Then click on the "New Object"command from the pop-up menu will add a new object into the editor window.MoveSelect the wanted object by first locating the mouse on any of the segments of it.Then move the mouse cursor with the left button depressed will move the selected object.DeleteSelect the wanted object by first locating the mouse on any of the segments of it.Then right-click the mouse and select“Delete Object”from the pop-up menu will delete the selected object.3.3Rays ModeAddTo start tracing a single ray,pressing the mouse left button at the interested start position and then drag the mouse to determine the direction of the emitting ray.Two functions are also provided for generating ray array,i.e., ray fan or ray sequence:Ray fan–First,press and drag the left button to decide the initial ray position and emit direction.Hold on the left buttonand,meanwhile,press the[ctrl]key.Then drag the mouse around to decide the expanding angle of the ray fan.Once done,release the mouse button and the[ctrl]key,and the ray fan will be added into the editor window.Ray sequence-First,press and drag the left button to decide the initial ray position and emit direction.Hold on the left button and,meanwhile,press the[Shift]key.Then drag the mouse to decide the extending range of the ray sequence.Oncedone,release the mouse button and the[shift]key,and the ray sequence will be added into the editor window.Delete RayRight-click on the interested ray and select“Delete Ray”from the pop-up menu will delete the selected ray.Clear all raysRight-click the mouse and select“Clear all rays”from the pop-up menu will delete the whole rays.3.4Bitmap ModeAddTo paste the grabbed picture,right-click on the editing area to determine the center position of the pasted image.Then click on the"Add bitmap from clip board"command from the pop-up menu,the stored picture in the clipboard will be pasted into the editor window. DeleteRight-click on the center point of the pasted bitmap and then click on the“Delete”command from the pop-up menu will delete the pasted bitmap.AdjustThe pasted bitmap can be rotated or scaled by dragging the control points of the bitmap frame.4.ToolboxThe ToolBox Panel is the control panel for users to select the manage mode of the Profile Editor Window.In each manage mode,users can implement different actions to the displayed objects in the model.More:Toolbox-Mode4.1ModeSegWhen Seg mode is selected,users can reshape the object profile by making adjustment to the segment/control point position in the Profile Editor Window.The way how the segment/control points are connected will base on the curve type selection of each segment.ObjWhen Obj mode is selected,users can select to add,delete,or move an arbitrary object in the model.RaysWhen Rays mode is selected,the raytrace function is enabled,and this helps give a quick check to the designmodel.Show RaysWhen Show Rays icon is checked,the traced rays will be instantly shown in the Profile Editor Window.BitmapWhen Bitmap mode is selected,users can paste,modify,or delete the grabbed image in the Profile Editor Window.Show BitmapWhen Show Bitmap icon is checked,the pasted picture will be shown as the background image in the Profile Editor Window.Opacity TunnerThrough the Opacity Tuner,users can directly tune the opacity of the pasted bitmap.Unit SelectorUsers can select the unit of the editor window to be mm,cm,or m.5.PropertyThe Property Editor allows users define the environment and object property in the model.More:Property Editor-General TabProperty Editor-Object Tab5.1General TabThe refractive index data are shown in the Refractive Indices /doc/8b19926bcaaedd3383c4d3ad.html ers can set the refractive index value of each item from the table.5.2Object TabThe detailed property information of an object will be shown in this /doc/8b19926bcaaedd3383c4d3ad.html ers can select to modify the item they want and the corresponding will be highlighted in the Profile Editor Window.6.ExportTo open the Export Panel,click on menu button:"Export".To generate geometry model and apply properties,use Export function to create a complete model including its optics properties in TracePro.Through DDE link,objects with the designated surface profiles can be directly added into the model window of TracePro.The creation mode and the applied property of each object can be checked and modified in the Export PanelMore:Export Optical Element(s)Creation Mode6.1Optical Element(s)This window generates optics object(s)in TracePro.Each object's geometry profile bases on”Editor Window”.And then,bydifferent“Creation mode”,3D shape could be“Radial Symmetry”,“Biaxial”andproperty.Export7.OptimizationThere are4regions in the optimization window.They are“Saving Optimization Log Options”,“Optimization Variables List”,“Optical Element Export Options”and“Definitions of Optimization Operands”.All parameters in this window will determine whether Interactive Optimization Utility links TracePro successfully and how to accomplishthis optimization.While everything is ready,click"Start"button to begin optimization.More:Optimization-OptionsOptimization-VariablesOptimization-OperandsOptimization-Objects7.1OptionsInteractive Optimization Utility uses DDE(Dynamic Data Exchange),a Windows protocol to share information with TracePro.To establish a full optimization,utility exports geometry to current document, commands that TracePro apply properties to exported object(s),and then initiates raytrace and saves simulation result.The whole optimization process would be saved.Thus,the file path and log file name have to be defined in advance.7.2VariablesAll variables will be listed in this panel.It’s just a simple viewer to monitor all variables in an easy way.We suggest not changing any value in this panel.That may cause some problems.The ideal way to modify variable-related values is through the Property window's Object Tab.Additional VariableIn some complicated case,we need some more advanced optimization skill to optimize our/doc/8b19926bcaaedd3383c4d3ad.html ually advanced optimization skill goes along with using After-scheme.To insert a new user-defined variable,first step is right click on this panel,and insert a user-defined variable.After setting its initial value,upperand lower limits, this variable’s name would be recognized in After-scheme.This new variable can be used to be one parameter of all commands in After-scheme.7.3OperandsAfter you have initiated the design of geometry shape,you need to set up the merit functions for you design system.For the following optimization process,it will take all operands as references and considering individual weight to evaluate the error value of each run.There are five different kinds of operands can be used.They are Flux,CIExy,CIEu’v’,Irradiance Profile and Candela Profile.Besides,each operand has different way to set up.Operand Type-FluxThe calculation of flux operand’s error value bases on the difference value between the target value and total flux of selection area on the observation plane.Operand Type-CIE u'v'&CIE xyThe calculation of CIE operand’s error value bases on the color difference on CIE map between the target color and the average color on selected region on observation plane.Operand Type-Irradiance ProfileThe calculation of Irr Profile operand’s error value bases on the irradiance/illumunance profile similarity between the target profile and the profile gotten from observation plane.。
基本参数:型面为抛物面,聚光面积为72m 2,开口直径D=9577mm ,焦距f=7500mm 。
抛物面方程为 Z Y X 3022=+,聚光器共分为12块,每块间距为20mm 。
中心开口半径为100mm 。
接收平面半径为100mm 。
操作过程如下:(1) 打开软件双击快捷方式打开软件,出现如下的对话框,选择Standard 即可满足要求。
(2) 建立模型在菜单栏中选择Insert Reflector ,弹出Insert Reflector 对话框,选择Conic 选项,其中Shape 共分四种:球面、抛物面、椭圆面和双曲面。
在本例中聚光器型面为抛物面,所以选择Parabolic 。
此外其它的一些设置可以按上面的基本参数的要求填写,如下面对话框所示,填写完毕后点击Insert 按钮。
这样就建立了一个厚度为2mm 、焦距为7500mm 、开口直径为9577mm 、中间孔洞半径为100mm 、中心坐标为(0,0,0)的抛物面聚光器,如下右图所示。
要想从不同角度观察模型,可以从通过以下菜单进行操作。
其中和按钮比较常用,为全局放大,为对模型进行旋转观测。
要想观测模型的不同效果可以点击菜单栏View选项,有Silhouettes、Render、Wireframe、Hidden Line四个选项可供选择。
(3)分割聚光器按要求聚光器共分为12块,每块间距为20mm。
此处应用布尔运算对聚光器进行分割。
首先创建X向尺寸为10000mm(要比聚光器的开口直径大一些),Y向尺寸为20mm(为每块聚光镜的间距尺寸),Z向尺寸为5000mm(要比聚光器开口深度略大)的薄板,具体参数设置如下对话框所示。
薄板创建完成后,点击鼠标右键,出现下拉菜单,选择Rotate选项,对应弹出Rotation Selection 对话框,按对话框中参数填写完成按Copy按钮。
此操作共进行5次。
最终完成结果图如下所示。
Ctrl键加鼠标左键依次选择抛物镜面和各个薄板,点击鼠标右键,选择Subtract选项,对其进行布尔减运算。
1.Introduction1.IntroductionTracePro®Interactive Optimizerhelps users generate and also accomplish the optimization process of the Optical Elements and whole system-quickly and accurately.It provides a convenient and intuitional user interface to create radial free-form optical element(s).While useful for luminaire design,this tool can also be used to optimize LED second optics,reflective optics,projector system,solar concentrator and any other optical system needed optimization.The utility is for use with all TracePro editions and requires the most recent release of TracePro7.0and Microsoft Windows XP or later version.For more information on TracePro,or if you need technical support,please contact Lambda Research Corporation.About Lambda Research CorporationFounded in1992,Lambda Research Corporation is a privately held company based in Littleton, mbda provides optics software and services for government and industry worldwide.The company is an industry pioneer in the areas of stray light analysis,optical system design and analysis,scattering theory,optical testing,process control software and custom software development.Technical SupportIf you are having trouble with TracePro or have questions,please contact your distributor or Lambda Research Corporation directly.Technical support is available to customers with current support contracts.Additional information is also available via:•the World Wide Web at •the user to user e-mail list tracepro-talk•the new version e-mail list tracepro-updatesTo subscribe to one of the e-mail lists,submit a request online at /lists/listinfo.You can call us between the hours of9:00am and5:30p.m.(U.S.Eastern Time)Monday through Friday or reach us by e-mail.Lambda Research Corporation25Porter RoadLittleton MA01460Phone:(978)486-0766Fax:(978)486-0755support@2.Getting Started2.Getting StartedInteractive optimizer offers an intuitive graphical user interface.Its multi-window design makes it easy to initiate a prototype design and monitor the optimization process with the instant simulation data returned from TracePro.This manual generally assumes a working knowledge of Windows.When Interactive Optimizer launched,a MDI window is initiated for starting a new optimization plan.The Interactive Optimizer user interface consists of:•Profile editor window•Toolbox panel•Property window•Export panel•Optimization control panel•Optimization log•Options panelBelow you can find instructions for some of the most basic Surface Source Property Generator operation More:•Profile editor window•Toolbox panel•Property window•Export panel•Optimization control panel•Optimization log•Options panel2.1Interactive Optimizer InterfaceInteractive Optimizer is a pure graphical user interface application.It helps users generate many kinds of freeform geometry and simulate its optical system performance in TracePro®.Furthermore it manipulates TracePro®to accomplish the optimization through DDE channel.To understand the interfaces of Interactive Optimizer,a simple description about each child windows are necessary,they are:3.Interactive Profile EditorOptical designers always have a lot of brilliant ideas to create optical systems.The optics geometry shape that they want to use in their system it’s not a primitive geometry,like sphere or block.Thus,how to create a desired geometry shape is an important issue.Even some people can’t100%simulate their optical system in TracePro,just because of complicate model creating problem.And here,Interactive Optimizer can help designer create their complicate optical components quickly and accurately.Interactive Optimizer provides Interactive Profile Drawer to easily create geometry.In Drawer,user can use straight line and spline to draw an enclosed loop to represent geometry’s profile.And without limiting the number of node point,the profile can fully matches use’s desire.The finished profile can be directly export to TracePro as a3D solid object.Or this profile can be the initial design of a system optimization process.Furthermore,it provides real-time2D raytrace function to speed up create a better initial design.There are a lot of features,such like drawing profile,raytrace,paste background bitmap and so on,that are included in Interactive Profile Drawer.So,for convenient operation,there is an independent“Toolbox”panel to switch Profile Drawer to different function.More:•Interactive Profile Drawer-Segment•Interactive Profile Drawer-Object•Interactive Profile Drawer-Rays•Interactive Profile Drawer-Bitmap3.1Segment ModeAdd Segment/Control PointTo add a segment/control point into the segment,first right-click on the wanted position of the segment and then click on the"Add Segment/Control Pont"command from the pop-up menu.Delete Segment/Control PointRight-click on the wanted segment/control point and then click on the"Delete"command from the pop-up menu.Segment Type SelectionRight-click on the interested segment and then choose the wanted segment type from the pop-up menu. Now there are five segment types provided:•Line:Straight line is used to connect the two adjacent segment points.•Spline:Spline curve is used to fit the control points between the two adjacent segment points.•Sphere:Spherical curve is used to connect the center control point and the two adjacent segment points.•Ellipse:Elliptical curve is used to connect the center control point and the two adjacent segment points.•Conic:Conic curve is used to fit the control points and the two adjacent segment points.Adjust Object ShapeThe shape of the object can be modified by dragging the segment/control points among the segments. 3.2Object ModeAddRight-click on the editing area to determine the center position height of the new object.Then click on the "New Object"command from the pop-up menu will add a new object into the editor window.MoveSelect the wanted object by first locating the mouse on any of the segments of it.Then move the mouse cursor with the left button depressed will move the selected object.DeleteSelect the wanted object by first locating the mouse on any of the segments of it.Then right-click the mouse and select“Delete Object”from the pop-up menu will delete the selected object.3.3Rays ModeAddTo start tracing a single ray,pressing the mouse left button at the interested start position and then drag the mouse to determine the direction of the emitting ray.Two functions are also provided for generating ray array,i.e., ray fan or ray sequence:•Ray fan–First,press and drag the left button to decide the initial ray position and emit direction.Hold on the left button and,meanwhile,press the[ctrl]key.Then drag the mouse around to decide the expanding angle of the ray fan.Once done,release the mouse button and the[ctrl]key,and the ray fan will be added into the editor window.•Ray sequence-First,press and drag the left button to decide the initial ray position and emit direction.Hold on the left button and,meanwhile,press the[Shift]key.Then drag the mouse to decide the extending range of the ray sequence.Once done,release the mouse button and the[shift]key,and the ray sequence will be added into the editor window.Delete RayRight-click on the interested ray and select“Delete Ray”from the pop-up menu will delete the selected ray.Clear all raysRight-click the mouse and select“Clear all rays”from the pop-up menu will delete the whole rays.3.4Bitmap ModeAddTo paste the grabbed picture,right-click on the editing area to determine the center position of the pasted image.Then click on the"Add bitmap from clip board"command from the pop-up menu,the stored picture in the clipboard will be pasted into the editor window.DeleteRight-click on the center point of the pasted bitmap and then click on the“Delete”command from the pop-up menu will delete the pasted bitmap.AdjustThe pasted bitmap can be rotated or scaled by dragging the control points of the bitmap frame.4.ToolboxThe ToolBox Panel is the control panel for users to select the manage mode of the Profile Editor Window.In each manage mode,users can implement different actions to the displayed objects in the model.More:•Toolbox-Mode4.1ModeSegWhen Seg mode is selected,users can reshape the object profile by making adjustment to the segment/control point position in the Profile Editor Window.The way how the segment/control points are connected will base on the curve type selection of each segment.ObjWhen Obj mode is selected,users can select to add,delete,or move an arbitrary object in the model.RaysWhen Rays mode is selected,the raytrace function is enabled,and this helps give a quick check to the designmodel.Show RaysWhen Show Rays icon is checked,the traced rays will be instantly shown in the Profile Editor Window.BitmapWhen Bitmap mode is selected,users can paste,modify,or delete the grabbed image in the Profile Editor Window.Show BitmapWhen Show Bitmap icon is checked,the pasted picture will be shown as the background image in the Profile Editor Window.Opacity TunnerThrough the Opacity Tuner,users can directly tune the opacity of the pasted bitmap.Unit SelectorUsers can select the unit of the editor window to be mm,cm,or m.5.PropertyThe Property Editor allows users define the environment and object property in the model.More:•Property Editor-General Tab•Property Editor-Object Tab5.1General TabThe refractive index data are shown in the Refractive Indices ers can set the refractive index value of each item from the table.5.2Object TabThe detailed property information of an object will be shown in this ers can select to modify the item they want and the corresponding will be highlighted in the Profile Editor Window.6.ExportTo open the Export Panel,click on menu button:"Export".To generate geometry model and apply properties,use Export function to create a complete model including its optics properties in TracePro.Through DDE link,objects with the designated surface profiles can be directly added into the model window of TracePro.The creation mode and the applied property of each object can be checked and modified in the Export PanelMore:•Export Optical Element(s)•Creation Mode6.1Optical Element(s)This window generates optics object(s)in TracePro.Each object's geometry profile bases on”Editor Window”.And then,by different“Creation mode”,3D shape could be“Radial Symmetry”,“Biaxial”andproperty.Export7.OptimizationThere are4regions in the optimization window.They are“Saving Optimization Log Options”,“Optimization Variables List”,“Optical Element Export Options”and“Definitions of Optimization Operands”.All parameters in this window will determine whether Interactive Optimization Utility links TracePro successfully and how to accomplish this optimization.While everything is ready,click"Start"button to begin optimization.More:•Optimization-Options•Optimization-Variables•Optimization-Operands•Optimization-Objects7.1OptionsInteractive Optimization Utility uses DDE(Dynamic Data Exchange),a Windows protocol to share information with TracePro.To establish a full optimization,utility exports geometry to current document, commands that TracePro apply properties to exported object(s),and then initiates raytrace and saves simulation result.The whole optimization process would be saved.Thus,the file path and log file name have to be defined in advance.7.2VariablesAll variables will be listed in this panel.It’s just a simple viewer to monitor all variables in an easy way.We suggest not changing any value in this panel.That may cause some problems.The ideal way to modify variable-related values is through the Property window's Object Tab.Additional VariableIn some complicated case,we need some more advanced optimization skill to optimize our ually advanced optimization skill goes along with using After-scheme.To insert a new user-defined variable,first step is right click on this panel,and insert a user-defined variable.After setting its initial value,upper and lower limits, this variable’s name would be recognized in After-scheme.This new variable can be used to be one parameter of all commands in After-scheme.7.3OperandsAfter you have initiated the design of geometry shape,you need to set up the merit functions for you design system.For the following optimization process,it will take all operands as references and considering individual weight to evaluate the error value of each run.There are five different kinds of operands can be used.They are Flux,CIExy,CIEu’v’,Irradiance Profile and Candela Profile.Besides,each operand has different way to set up.Operand Type-FluxThe calculation of flux operand’s error value bases on the difference value between the target value and total flux of selection area on the observation plane.Operand Type-CIE u'v'&CIE xyThe calculation of CIE operand’s error value bases on the color difference on CIE map between the target color and the average color on selected region on observation plane.Operand Type-Irradiance ProfileThe calculation of Irr Profile operand’s error value bases on the irradiance/illumunance profile similaritybetween the target profile and the profile gotten from observation plane.Operand Type-FluxThe calculation of Irr Profile operand’s error value bases on the irradiance/illumunance profile similarity between the target profile and the profile gotten from observation plane.7.4ObjectsDuring optimization process,Interactive Optimizer follows the variables that optimization algorithm7.Optimizationgenerates to export one or more optics that need to be optimized into TracePro in each iteration.After creating optics,next steps are performing raytrace and analyzing its result.Here,this objects panel manages how to export optics and including applying material property on it.The detailed about exporting object,such as definition of parameters and creation mode,see Export.After-schemeThe last column named“After-scheme”is the only distinction between Export window and this panel.If there’s other specific actions must be executed after creating geometry,people can add additional code at this column.It’s compatible with TracePro Scheme Commands and all commands provided by Interactive Optimizer. Double-click the grid,a Scheme editor window pops up.After coding,press“Apply”button to save it.Scheme ExecutionTo pre-execute the content in after-scheme column,Right click on the grid,a menu pops up.Three different actions as follow:8.Optimization LogThe Optimization Log window helps user monitor the optimization progress.While performing optimization, this window shows up automatically.More:•Optimization Log-Graphs•Optimization Log-Trand Chart8.1GraphsAll iteration will be recorded by Interactive er can check each time simulation result(s)through this graph panel.And all useful analysis values are listed on this panel too.ListGraphsSwitch to Graphs tab,while the selected row is changed,the graphs panel will update to the correlated simulation result map.After selecting a row,if system saved multiple maps,user can choose analysis map through Graph selector.8.2Trand ChartThe trend chart of the Error Value is displayed in this ers can monitor the optimization process by keeping track on the Error Value.By default,this plot will be automatically updated by the simulated result throughout the optimization process.Once the optimization has multiple targets,user can choose to individually view the error value trend chart of each target or just the sum of error values for targets.Interactive Optimization use Simplex as optimization algorithm that uses4kinds of method,including Reflection,Expansion,Contraction and Shrinkage,to manipulate the simplex and try to find the local minimum. So each iteration point in trend chart uses color to indicate its corresponding Simplex Algorithm action.9.OptionsThe Options Panel allows you to specify the drawing preferences and decide the preferred way to initiate the optimization process.More:•Options-Drawing Tab•Options-Optimization Tab9.1Drawing TabIn this tab,it allows you to specify the colors for the drawing items in the profile editor window.Below is a list of drawing items that you can modify:Background,Curve,Highlight curve,Selected Curve, Ray,Highlight Ray,Selected Ray,Ray Fan,Ray Sequence9.2Optimization TabIn this tab,it allows you to specify the way of initiating the Downhill Simplex Method.Two ways are provided:[Generate by Character length]or[Generate by Variable limits].9.3Tool-Reset DDEInteractive Optimizer uses DDE(Dynamic Data Exchange),a Windows protocol to share information with TracePro.Once the utility fails keeping connection with TracePro,users just need to click the[Reset DDE]menu button and the utility will fix the issue automatically.。