美联储资产负债表
- 格式:xls
- 大小:20.00 KB
- 文档页数:4

Reserve Bank credit, related items, and reserve balances of depository institutions at Federal Reserve BanksReserve Bank credit703,676 + 11,023 + 69,903 708,472Securities held outright 629,410 + 2,931 + 73,535 629,412U.S. Treasury 1629,400 + 2,931 + 73,535 629,402Bills 2226,682 + 2,925 + 40,429 226,682Notes and bonds, nominal 2389,219 0 + 30,765 389,219Notes and bonds, inflation-indexed 2 12,242 0 + 2,056 12,242Inflation compensation 3 1,256 + 6 + 284 1,258Federal agency 210 0 0 10Repurchase agreements 434,321 + 6,142 - 7,422 37,250Loans to depository institutions 59 + 4 - 13 59Adjustment credit 13 + 7 - 23 9Seasonal credit 46 - 3 + 10 50Extended credit 0 0 0 0Float1,177 + 1,238 + 1,008 2,793Other Federal Reserve assets 38,708 + 705 + 2,793 38,958Gold stock11,043 0 - 2 11,043Special drawing rights certificate account 2,200 0 0 2,200Treasury currency outstanding 534,483 + 14 + 1,476 34,483Total factors supplying reserve funds751,401 + 11,036 + 71,376 756,197Currency in circulation 5681,441 + 6,025 + 42,945 685,007Reverse repurchase agreements 620,908 + 2,706 + 20,908 20,396Foreign official and international accounts 20,908 + 2,706 + 20,908 20,396Dealers0 0 0 0Treasury cash holdings360 - 10 - 65 360Deposits with F.R. Banks, other than reserve balances 16,186 - 1,031 + 2,018 16,184U.S. Treasury, general account 4,678 - 1,281 + 33 4,662Foreign official 114 - 34 - 230 139Service-related11,181 + 281 + 2,209 11,181Required clearing balances10,452 + 2 + 1,870 10,452Adjustments to compensate for float 729 + 279 + 339 729Other212 + 2 + 5 203Other liabilities and capital20,441 + 238 + 2,685 20,670Total factors, other than reserve balances,absorbing reserve funds 739,334 + 7,925 + 68,489 742,617Reserve balances with Federal Reserve Banks12,067+ 3,111+ 2,88713,580Memo (off-balance-sheet items):Marketable securities held in custody for foreignofficial and international accounts 2,7 848,867 + 2,568 . . . 848,468U.S. Treasury 685,997 + 704. . . 685,042Federal agency 162,870 + 1,865 . . . 163,426Securities lent to dealers 304 + 153 - 4,151 111December 26, 2002Factors Affecting Reserve Balances of Depository Institutions and Condition Statement of Federal Reserve Banks1. Factors Affecting Reserve Balances of Depository InstitutionsMillions of dollarsAverages of daily figuresNote: Components may not sum to totals because of rounding.. . .not available.1.Includes securities lent to dealers, which are fully collateralized by other U.S. Treasury securities.2.Face value of the securities.pensation that adjusts for the effects of inflation on the original face value of inflation-indexed securities.4.Cash value of agreements, which are collateralized by U.S. Treasury and federal agency securities.5.Estimated.6.Cash value of agreements, which are collateralized by U.S. Treasury securities.7.Includes U.S. Treasury STRIPS and other zero coupon bonds at face value.Sources: Federal Reserve Banks and the U.S. Department of the Treasury.Change from week ended Wednesday Dec 25, 2002Week ended Dec 25, 2002 Dec 18, 2002 Dec 26, 2001Note: Components may not sum to totals because of rounding.1.Includes securities lent to dealers, which are fully collateralized by other U.S. Treasury securities.2.Face value of the securities.pensation that adjusts for the effects of inflation on the original face value of inflation-indexed securities.4.Cash value of agreements, which are collateralized by U.S. Treasury and federal agency securities.5.Includes assets denominated in foreign currencies, which are revalued daily at market exchange rates.6.Cash value of agreements, which are collateralized by U.S. Treasury securities.7.Includes exchange-translation account reflecting the daily revaluation at market exchange rates of foreign exchange commitments.AssetsGold certificate account11,039 0 - 6Special drawing rights certificate account 2,200 0 0Coin1,011 - 24 - 55Securities, repurchase agreements, and loans 666,721 + 7,269 + 60,420Securities held outright 629,412 + 5 + 73,405U.S. Treasury 1629,402 + 5 + 73,405Bills 2226,682 0 + 40,293Notes and bonds, nominal 2389,219 0 + 30,765Notes and bonds, inflation-indexed 2 12,242 0 + 2,056Inflation compensation 3 1,258 + 5 + 291Federal agency 210 0 0Repurchase agreements 4 37,250 + 7,250 - 13,000Loans59 + 14 + 14Items in process of collection (1,076) 13,239 + 4,439 + 8,017Bank premises 1,540 + 6 + 21Other assets 537,357 + 817 + 1,764Total assets (1,076)733,107 + 12,506 + 70,162LiabilitiesFederal Reserve notes, net of F.R. Bank holdings 651,891 + 6,292 + 41,390Reverse repurchase agreements 6 20,396 - 1,509 + 20,396Deposits(0)29,704 + 4,781 - 1,380Depository institutions24,701 + 6,758 - 1,070U.S. Treasury, general account 4,662 - 1,933 - 194Foreign official 139 - 33 - 94Other(0) 203 - 10 - 20Deferred availability cash items(1,076) 10,447 + 2,181 + 6,515Other liabilities and accrued dividends 72,461 + 43 - 133Total liabilities(1,076)714,898 + 11,787 + 66,787Capital accounts Capital paid in 8,382 + 6 + 1,025Surplus7,312 0 + 600Other capital accounts2,516 + 714 + 1,751Total capital18,209+ 720+ 3,374H.4.12. Consolidated Statement of Condition of All Federal Reserve BanksMillions of dollarsChange sinceWednesday Dec 26, 2001Eliminations from consolidationWednesday Dec 25, 2002Wednesday Dec 18, 20023. Maturity Distribution of Loans and Securities, December 25, 2002Millions of dollars Federal agency securitiesWeeklychanges Holdings U.S. Treasury securities 1Holdings Weeklychanges LoansRepurchase agreements 2Note:Components may not sum to totals because of rounding. . . .Not applicable.1.Includes the original face value of inflation-indexed securities and compensation that adjusts for the effects of inflation on the original face value of such securities.2.Cash value of agreements classified by remaining maturity of the agreements.Reverse repurchase agreements 2Within 15 days 57 33,670 - 13,583 0 0 21,250 20,39616 days to 90 days 2 146,846 + 12,584 0 0 16,000 091 days to 1 year141,815 + 999 10 0. . . . . . Over 1 year to 5 years . . . 173,936 + 1 0 0. . . . . . Over 5 years to 10 years . . . 53,298 + 3 0 0. . . . . . Over 10 years. . .79,838+ 20. . . . . .All 59 629,402 + 5 10 0 37,250 20,396Assets, liabilities, and capitalMaturity。

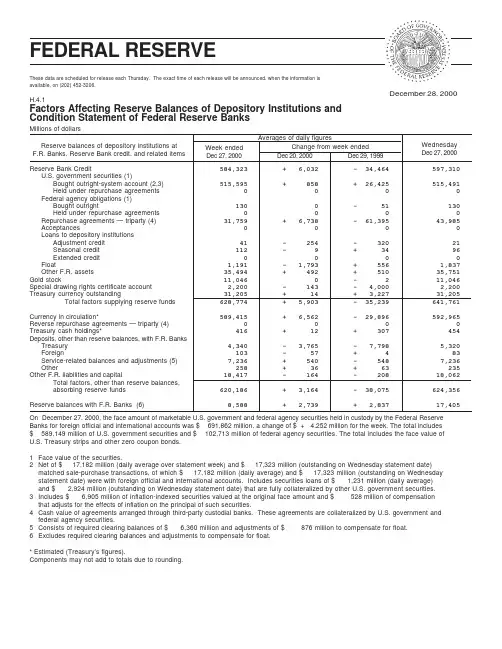
Reserve Bank Credit584,323 + 6,032 - 34,464 597,310U.S. government securities (1)Bought outright-system account (2,3) 515,595 + 858 + 26,425 515,491Held under repurchase agreements 0 0 0 0Federal agency obligations (1)Bought outright130 0 - 51 130Held under repurchase agreements 0 0 0 0Repurchase agreements — triparty (4) 31,759 + 6,738 - 61,395 43,985Acceptances0 0 0 0Loans to depository institutionsAdjustment credit 41 - 254 - 320 21Seasonal credit 112 - 9 + 34 96Extended credit 0 0 0 0Float1,191 - 1,793 + 556 1,837Other F.R. assets 35,494 + 492 + 510 35,751Gold stock11,046 0 - 2 11,046Special drawing rights certificate account 2,200 - 143 - 4,000 2,200Treasury currency outstanding31,205 + 14 + 3,227 31,205Total factors supplying reserve funds 628,774 + 5,903 - 35,239 641,761Currency in circulation*589,415 + 6,562 - 29,896 592,965Reverse repurchase agreements — triparty (4) 0 0 0 0Treasury cash holdings*416 + 12 + 307 454Deposits, other than reserve balances, with F.R. BanksTreasury 4,340 - 3,765 - 7,798 5,320Foreign103 - 57 + 4 83Service-related balances and adjustments (5) 7,236 + 540 - 548 7,236Other258 + 36 + 63 235Other F.R. liabilities and capital18,417 - 164 - 208 18,062Total factors, other than reserve balances,absorbing reserve funds 620,186 + 3,164 - 38,075 624,356Reserve balances with F.R. Banks (6)8,588+ 2,739+ 2,83717,405December 28, 2000These data are scheduled for release each Thursday. The exact time of each release will be announced, when the information is available, on (202) 452-3206.H.4.1Factors Affecting Reserve Balances of Depository Institutions and Condition Statement of Federal Reserve BanksMillions of dollarsAverages of daily figuresReserve balances of depository institutions at F.R. Banks, Reserve Bank credit, and related items On December 27, 2000, the face amount of marketable U.S. government and federal agency securities held in custody by the Federal Reserve Banks for foreign official and international accounts was $ 691,862 million, a change of $ + 4,252 million for the week. The total includes $ 589,149 million of U.S. government securities and $ 102,713 million of federal agency securities. The total includes the face value of U.S. Treasury strips and other zero coupon bonds.1Face value of the securities.2Net of $ 17,182 million (daily average over statement week) and $ 17,323 million (outstanding on Wednesday statement date)matched sale-purchase transactions, of which $ 17,182 million (daily average) and $ 17,323 million (outstanding on Wednesday statement date) were with foreign official and international accounts. Includes securities loans of $ 1,231 million (daily average)and $ 2,924 million (outstanding on Wednesday statement date) that are fully collateralized by other U.S. government securities.3Includes $ 6,905 million of inflation-indexed securities valued at the original face amount and $ 528 million of compensation that adjusts for the effects of inflation on the principal of such securities.4Cash value of agreements arranged through third-party custodial banks. These agreements are collateralized by U.S. government and federal agency securities.5Consists of required clearing balances of $ 6,360 million and adjustments of $ 876 million to compensate for float.6Excludes required clearing balances and adjustments to compensate for float.* Estimated (Treasury’s figures).Components may not add to totals due to rounding.Change from week ended Wednesday Dec 27, 2000Week ended Dec 27, 2000Dec 20, 2000Dec 29, 1999ASSETSGold certificate account11,046 0 - 2Special drawing rights certificate account 2,200 0 - 4,000Coin 946 - 8 + 743Loans117 - 8 - 2,755Acceptances0 0 0Repurchase agreements — triparty (1) 43,985 + 18,275 - 78,885Federal agency obligations (2)Bought outright130 0 - 51Held under repurchase agreements 0 0 0U.S. government securities (2)Bought outright—Bills182,530 - 97 + 557Notes (3) 240,176 + 1,047 + 21,710Bonds (4)92,784 + 1 + 9,806Total bought outright (5)515,491 + 952 + 32,074Held under repurchase agreements0 0 0Total U.S. government securities515,491 + 952 + 32,074Total loans and securities559,723 + 19,219 - 49,617Items in process of collection (771) 10,087 - 2,247 + 3,162Bank premises 1,455 + 3 + 99Other assets (6)34,268 + 548 + 435 TOTAL ASSETS (771)619,724 + 17,514 - 49,182LIABILITIESFederal Reserve notes563,160 + 6,370 - 37,761Reverse repurchase agreements — triparty (1) 0 0 0DepositsDepository institutions24,787 + 10,921 + 8,058U.S. Treasury—general account 5,320 + 539 - 20,603Foreign—official accounts83 - 144 - 151Other(0) 235 + 24 + 52Total deposits(0) 30,426 + 11,342 - 12,643Deferred availability cash items(771) 8,077 - 120 + 1,445Other liabilities and accrued dividends (7)4,341 - 34 - 137TOTAL LIABILITIES (771)606,003 + 17,557 - 49,096CAPITAL ACCOUNTS Capital paid in 7,024 + 2 + 592Surplus2,679 0 - 3,273Other capital accounts4,018- 45+ 2,596H.4.1(a)Consolidated Statement of Condition of all Federal Reserve BanksMillions of dollarsChange SinceWednesday Dec 29, 1999Eliminations from ConsolidationWednesday Dec 27, 2000Wednesday Dec 20, 20001Cash value of agreements arranged through third-party custodial banks.2Face value of the securities.3Includes $ 5,367 million of inflation-indexed securities valued at the original face amount and $ 425 million of compensation that adjusts for the effects of inflation on the principal of such securities.4Includes $ 1,538 million of inflation-indexed securities valued at the original face amount and $ 104 million of compensation that adjusts for the effects of inflation on the principal of such securities.5Net of $ 17,323 million matched sale-purchase transactions outstanding at the end of the latest statement week. Includes securities loans of $ 2,924 million that are fully collateralized by other U.S. government securities.6Includes assets denominated in foreign currencies, revalued monthly at market exchange rates.7Includes exchange-translation account reflecting the monthly revaluation at market exchange rates of foreign exchange commitments.Maturity Distribution of Loans and Securities, December 27, 2000Millions of dollarsFederal agency obligations(2)Weeklychanges Holdings U.S. government securities (1,2)Holdings Weeklychanges LoansRepurchase Agreements—Triparty (3)1Includes $ 6,905 million of inflation-indexed securities valued at the original face amount and $ 528 million of compensation that adjusts for the effects of inflation on the principal of such securities.2Includes face value of securities held under repurchase agreements classified by the remaining maturity of the agreements.3Cash value of agreements arranged through third-party custodial banks classified by remaining maturity of the ponents may not add to totals due to rounding.ReverseRepurchase Agreements—Triparty (3)Within 15 days 110 19,889 + 954 0 0 33,010 016 days to 90 days 7 110,832 - 1,017 0 0 10,97591 days to 1 year125,620 - 34 0 0—————— Over 1 year to 5 years ——— 132,792 + 1,046 130 0—————— Over 5 years to 10 years ——— 55,461 + 2 0 0——————Over 10 years ——— 70,896 + 1 0 0——————Total117515,491+ 95213043,985。

美联储拟逐步削减资产负债表14 Jun 2017美国联邦储备局(美联储)终于准备着手逐步削减资产负债表。
先从另一个角度来看,在2008年金融危机之前以及美联储随后推出名为量化宽松(QE)的资产收购计划之时,美联储2007年的资产负债表约为GDP的6%,或低于一万亿美元。
到2017年6月,美联储的资产负债表膨胀到GDP的近25%,即4.5万亿美元。
美联储资产负债表的目标规模是多大?美联储资产负债表规模庞大,自然会引起一个疑问:从长远来看,美联储资产负债表的最佳规模或目标规模是多大?自2010年以来,在经济摆脱衰退,重新开始增长之后,所有资产收购计划和量化宽松政策对于帮助美国实际GDP增速超过2%似乎无能为力,也无法将通胀率提升至2%以上。
我们认为量化宽松基本无法实现经济增长和通胀目标,即使量化宽松确实压低国债收益率,支撑股价上涨,以及降低股票和债券市场波动性亦于事无补。
因此似乎有理由认为,美联储资产负债表目前的规模过于庞大,对市场价格发现流程的干预远远超过合理的范围。
我们不知道央行资产负债表的最佳规模以多大为宜,但我们确实认为美联储将致力于将资产负债表缩减一半。
我们预计美联储的目标资产负债表规模为GDP的约12%,这是金融危机前的两倍,也是目前规模的一半。
缩减资产负债表还有美联储不愿意讨论的理由。
从我们的角度来说,在美联储加息之际,不缩减资产负债表,而始终以到期国债的所有收益或抵押担保证券(MBS)的本金还款进行再投资,这并非明智之举。
由于臃肿的资产负债表,银行在美联储持有2.2万亿美元的过剩存款准备金。
美联储通过量化宽松计划买入证券,支付方式是向银行和主要交易商等卖方的帐户记入资金,于是形成这些过剩准备金。
这些存款是联邦基金。
需要注意的是,虽然银行之间可以买卖联邦基金(例如按联邦基金利率),但银行不能取消这些存款。
只有美联储可以取消,只要不用本金还款进行再投资或卖断证券即可,但美联储不会卖出任何证券。
次贷危机以来美联储资产负债表的变化作者:唐欣语发布时间:2009-05-04 09:33 来源:21世纪经济报道2007年下半年以来,美国次贷危机愈演愈烈,美联储为应对金融危机采取了大量拯救措施,为市场提供流动性,恢复市场信心。
这导致美联储资产负债表的规模与结构发生显著变化,本文欲予以分析。
危机发生前的2007年6月底,美联储资产负债表非常简洁:在资产方,联储持有的美国财政部证券占据大头(2007年6月底占比为87.9%);在负债方,流通中的货币占据大头(2007年6月底占比为90%),但金融危机改变了这一切。
联储资产负债表的规模迅速膨胀,总规模由2007年6月的8993亿美元上升到目前的21217亿美元,不到两年时间增长了1.36倍。
资产方的结构分析首先,美联储在减持美国财政部债券。
2007年6月底联储持有财政债券为7904亿美元,2009年4月8日为5055.2亿美元,减持了36%;相应地,财政债券在资产方的占比也从87.9%下降到目前的37.6%()。
联储减持财政债券,主要是因为通过公开市场操作投放的货币不具有指向性,而救市必须“专款专用”,因此它通过减持国债回笼资金,再通过其它专项计划投放给特定机构。
这可以理解为:联储一手通过多种创新工具向市场投放流动性,一手用卖出国债的方式回收流动性。
其次,新资产项目显著增多、数额巨大。
第一,在“证券”项目(附表1中1.1项)下,从2009年1月起开始设置“MBS(抵押贷款债券)”栏,用于反映联储收购的由房利美、房地美、吉利美担保的MBS。
该收购计划于2008年11月宣布,计划收购总量将达到MBS市场的1/9,即5000亿美元,意在提高MBS市场的流动性,压低MBS的利率,从而压低长期住房抵押贷款利率,重整楼市,促进美国经济复苏。
目前此项目余额为2364亿美元,占资产方余额的11.2%。
第二,新设“定期拍卖信贷”(Term Auction Credit)项目(附表1中1.3项),用于反映“定期拍卖便利”(Term Auction Facility,简称TAF)所投放的信贷。
When ites to the Federal Reserve balance sheet, the bank deposit reserve is like the superhero cape of the banking world. It's the stash of cash that a bank has to keep on hand, either in its vault or parked at the Federal Reserve, just in case the depositorse knocking. This reserve requirement is the brainchild of the Federal Reserve, the all-powerful central bank of the United States. Its mission is to make sure that banks always have enough cash flow to handle any sudden withdrawal demands, and to keep a tight rein on how much money they can lend out. Think of it as the Fed's way of playing with the money supply and interest rates, kind of like a conductor leading an orchestra. So, the next time you picture the Federal Reserve balance sheet, imagine a secret vault full of superhero cash, keeping the banking world safe and sound!银行存款储备就像银行界的超级英雄斗篷银行在保险库里或停在联邦储备局都得存现金以防存款人敲门这一储备要求是美国全能的中央银行美联储的聪明人才。
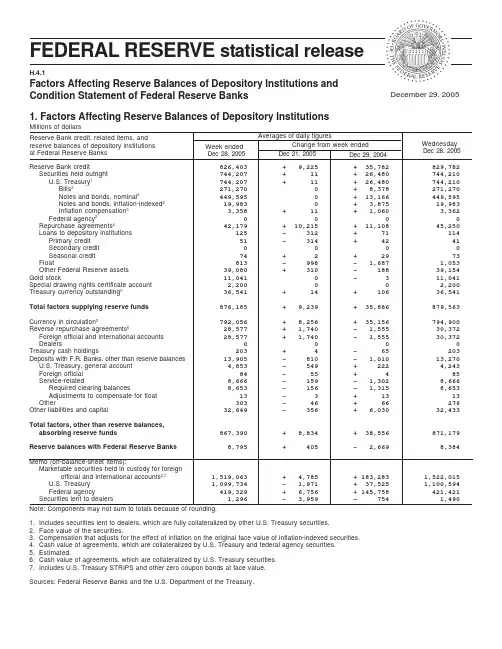
Reserve Bank credit, related items, and reserve balances of depository institutions at Federal Reserve BanksReserve Bank credit826,403 + 9,225 + 35,782 829,782Securities held outright 744,207 + 11 + 26,480 744,210U.S. Treasury 1744,207 + 11 + 26,480 744,210Bills 2271,270 0 + 8,378 271,270Notes and bonds, nominal 2449,595 0 + 13,166 449,595Notes and bonds, inflation-indexed 2 19,983 0 + 3,875 19,983Inflation compensation 3 3,358 + 11 + 1,060 3,362Federal agency 20 0 0 0Repurchase agreements 442,179 + 10,215 + 11,108 45,250Loans to depository institutions 125 - 312 + 71 114Primary credit 51 - 314 + 42 41Secondary credit 0 0 0 0Seasonal credit 74 + 2 + 29 73Float813 - 998 - 1,687 1,053Other Federal Reserve assets 39,080 + 310 - 188 39,154Gold stock11,041 0 - 3 11,041Special drawing rights certificate account 2,200 0 0 2,200Treasury currency outstanding 536,541 + 14 + 106 36,541Total factors supplying reserve funds876,185 + 9,239 + 35,886 879,563Currency in circulation 5792,056 + 8,256 + 35,156 794,900Reverse repurchase agreements 628,577 + 1,740 - 1,555 30,372Foreign official and international accounts 28,577 + 1,740 - 1,555 30,372Dealers0 0 0 0Treasury cash holdings203 + 4 - 65 203Deposits with F.R. Banks, other than reserve balances13,905 - 810 - 1,010 13,270U.S. Treasury, general account 4,853 - 549 + 222 4,243Foreign official 84 - 55 + 4 85Service-related8,666 - 159 - 1,302 8,666Required clearing balances8,653 - 156 - 1,315 8,653Adjustments to compensate for float 13 - 3 + 13 13Other303 - 46 + 66 276Other liabilities and capital32,649 - 356 + 6,030 32,433Total factors, other than reserve balances,absorbing reserve funds 867,390 + 8,834 + 38,556 871,179Reserve balances with Federal Reserve Banks8,795+ 405- 2,6698,384Memo (off-balance-sheet items):Marketable securities held in custody for foreignofficial and international accounts 2,7 1,519,063 + 4,785 + 183,283 1,522,015U.S. Treasury 1,099,734 - 1,971 + 37,525 1,100,594Federal agency 419,329 + 6,756 + 145,758 421,421Securities lent to dealers 1,296 - 3,959 - 754 1,490Averages of daily figuresNote: Components may not sum to totals because of rounding.1.Includes securities lent to dealers, which are fully collateralized by other U.S. Treasury securities.2.Face value of the securities.pensation that adjusts for the effect of inflation on the original face value of inflation-indexed securities.4.Cash value of agreements, which are collateralized by U.S. Treasury and federal agency securities.5.Estimated.6.Cash value of agreements, which are collateralized by U.S. Treasury securities.7.Includes U.S. Treasury STRIPS and other zero coupon bonds at face value.Sources: Federal Reserve Banks and the U.S. Department of the Treasury.Change from week ended Wednesday Dec 28, 2005Week ended Dec 28, 2005 Dec 21, 2005 Dec 29, 2004Note: Components may not sum to totals because of rounding.1.Includes securities lent to dealers, which are fully collateralized by other U.S. Treasury securities.2.Face value of the securities.pensation that adjusts for the effect of inflation on the original face value of inflation-indexed securities.4.Cash value of agreements, which are collateralized by U.S. Treasury and federal agency securities.5.Includes assets denominated in foreign currencies, which are revalued daily at market exchange rates.6.Cash value of agreements, which are collateralized by U.S. Treasury securities.7.Includes exchange-translation account reflecting the daily revaluation at market exchange rates of foreign exchange commitments.AssetsGold certificate account11,037 0 - 4Special drawing rights certificate account 2,200 0 0Coin688 - 16 - 29Securities, repurchase agreements, and loans789,574 + 299 + 38,704Securities held outright 744,210 + 10 + 26,397U.S. Treasury 1744,210 + 10 + 26,397Bills 2271,270 0 + 8,300Notes and bonds, nominal 2449,595 0 + 13,166Notes and bonds, inflation-indexed 2 19,983 0 + 3,875Inflation compensation 3 3,362 + 11 + 1,056Federal agency 20 0 0Repurchase agreements 4 45,250 + 250 + 12,250Loans114 + 39 + 57Items in process of collection (1,209) 7,750 - 1,367 + 1,646Bank premises 1,826 - 30 + 39Other assets 537,339 + 497 - 2,420Total assets (1,209)850,414 - 616 + 37,936LiabilitiesFederal Reserve notes, net of F.R. Bank holdings 759,246 + 6,277 + 36,342Reverse repurchase agreements 6 30,372 + 3,610 + 434Deposits(0)21,666 - 10,395 - 5,810Depository institutions17,062 - 9,343 - 4,371U.S. Treasury, general account 4,243 - 1,047 - 1,491Foreign official 85 - 1 - 2Other(0) 276 - 4 + 55Deferred availability cash items(1,209) 6,697 - 406 + 1,063Other liabilities and accrued dividends 74,419 + 65 + 1,226Total liabilities(1,209)822,400 - 849 + 33,255Capital accounts Capital paid in 13,536 0 + 1,895Surplus11,630 + 1 + 2,783Other capital accounts2,849 + 232 + 4Total capital28,014+ 233+ 4,681H.4.12. Consolidated Statement of Condition of All Federal Reserve BanksMillions of dollarsChange sinceWednesday Dec 29, 2004Eliminations from consolidationWednesday Dec 28, 2005Wednesday Dec 21, 20053. Maturity Distribution of Loans and Securities, December 28, 2005Millions of dollars Federal agency securitiesWeeklychanges Holdings U.S. Treasury securities 1Holdings Weeklychanges LoansRepurchase agreements 2Note:Components may not sum to totals because of rounding. . . .Not applicable.1.Includes the original face value of inflation-indexed securities and compensation that adjusts for the effect of inflation on the originalface value of such securities.2.Cash value of agreements classified by remaining maturity of the agreements.Reverse repurchase agreements 2Within 15 days 114 57,172 + 757 0 0 45,250 30,37216 days to 90 days 0 155,859 - 847 0 0 0 091 days to 1 year186,525 + 89 0 0. . . . . . Over 1 year to 5 years . . . 210,743 + 4 0 0. . . . . . Over 5 years to 10 years . . . 56,698 + 2 0 0. . . . . . Over 10 years. . .77,213+ 50. . . . . .All 114 744,210 + 10 0 0 45,250 30,372Assets, liabilities, and capitalMaturity。

美联储资产负债表
美联储资产负债表缩表的目标是实现宏观经济目标。
在缩减资产负债表的规模方面,美联储通过持续缩表的过程来实现其经济目标。
具体来说,缩表可以在一定程度上减少市场上的货币供应量,从而降低通货膨胀压力,保持物价稳定。
此外,缩表还可以提高美元的价值,从而促进美国的出口,有利于国际收支平衡。
然而,美联储缩表也面临着一些挑战和风险。
首先,如果缩表过快或过猛,可能会导致市场上的货币供应量减少过多,从而引起经济衰退或通货紧缩。
其次,如果缩表后的利率上升过高,可能会导致美国的债务负担加重,从而对美国经济造成不利影响。
因此,美联储在制定缩表计划时需要综合考虑各种因素,包括经济增长、物价稳定、国际收支平衡等。

最新美联储资产负债表构成
2012年10月08日 14:40
文 / liya
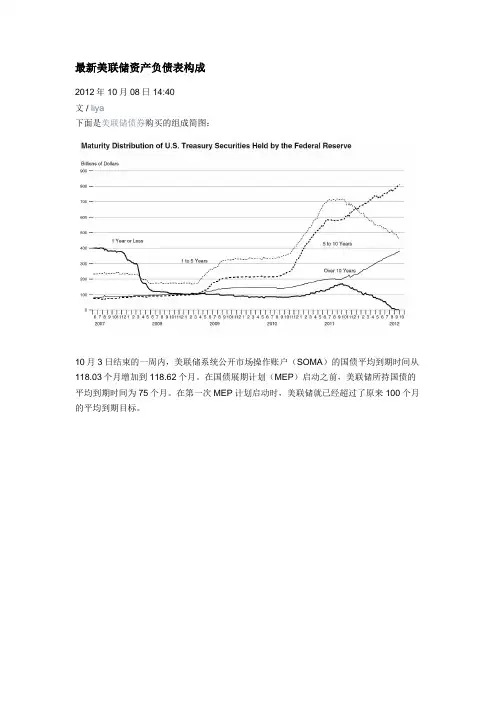
下面是美联储债券购买的组成简图:
10月3日结束的一周内,美联储系统公开市场操作账户(SOMA)的国债平均到期时间从118.03个月增加到118.62个月。
在国债展期计划(MEP)启动之前,美联储所持国债的平均到期时间为75个月。
在第一次MEP计划启动时,美联储就已经超过了原来100个月的平均到期目标。
同在10月3日结束的一周内,美联储SOMA持有国债的平均久期增加到7.31年(87.67个月),之前一周为87.33个月。
这意味着,使所有期限的国债每个百分点的收益率变动将导致价格平均下降7.31%。
上周到期资产和国债发行的抵消效应导致可流通国债的平均到期时间从65.28个月上升到65.36个月。
美联储持有的债券存量使得私人部门持有的可流通债券的平均到期日缩短了9.64个月。
而私人持有国债的平均到期日从55.70个月上升到55.73个月。
自从经济衰退以来,美联储延长了SOMA账户所持国债的平均到期时间和久期。
看起来主要减少的是7-10年期国债供应,美联储持有70%的所发行的该品种国债。
美联储持有的十年期国债从前一周的1.325万亿上升到1.333万亿,这使私人部门可流通债券减少到3.550万亿。
共计有4.884万亿的十年期未偿债券,美联储持有27.2%。
假设美联储的资产负债表在2014年年底增加到5万亿,那这一比例将上升到接近60%。
本站内容仅供读者参考,并非投资建议。
除非注明,本站文章均为原创或编译,转载请注明来源并加上本站链接。
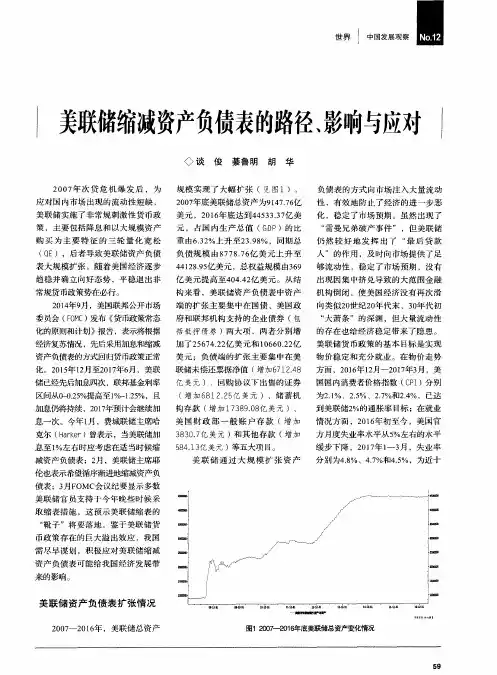
美联储资产负债表(2003.12.24)单位:百万美元美联储资产负债表(2008.12.24)* Net portfolio holdings of Commercial Paper Funding Facility LLC(以下项目标注相类似)Commercial Paper Funding Facility LLC is a limited liability company formed to purchase three-month U.S. dollar-denominated commercial paper from eligible issuers and thereby foster liquidity in short-term funding markets and increase the availability of credit for businesses and households.Maiden Lane LLC is the first holding company bearing the name that was created when JPMorgan Chase took over Bear Stearns in early 2008. The Federal Reserve Bank of New Y ork is the primary benefic iary of Maiden Lane LLC. It holds an asset portfolio that JPMorgan found too risky to assume in whole, and consequently the Federal Reserve Bank of New Y ork extended a $30 billion credit line to the limited liability company to facilitate the unwinding of these assets over time. Bloomberg, citing Bank of America analysts, reported on October 2, 2008, that the Federal Reserve might stand to lose $2 to $6 billion on the asset porfolio. A November 06, 2008, update by the Federal Reserve showed that the fair value of the assets was at $26.8 billion, meaning a book loss of $2 billion for the Federal Reserve.Maiden Lane II LLC is a limited liability company created when American International Group Inc(AIG) was taken over by the U.S. government in September 2008. Since AIG's subsidiarieshold a great many residential mortgage-backed securities that are very risky, Maiden Lane II LLC was formed to purchase these RMBS. On December 12, 2008, the Federal Reserve Bank of New Y ork began extending credit to Maiden Lane II LLC. On the Fed's Balance Sheet as of December 17, 2008, net portfolio holdings of Maiden Lane II LLC are 20,031 million dollarsMaiden Lane III LLC is a holding company created when American International Group Inc(AIG) was taken over by the U.S. government in September 2008. Similar to Maiden Lane II LLC, Maiden Lane III LLC aims to purchase multi-sector collateralized debt obligations (CDOs) on which the Financial Products group of AIG had written credit default swap contracts. On November 25, 2008, the Federal Reserve Bank of New Y ork began extending credit to Maiden Lane III LLC. As of December 17, 2008, The Federal Reserve's net portfolio holding of Maiden Lane III LLC is 19.656 billion dollars(Maiden Lane III LLC (ML III), a financing entity recently created by the Federal Reserve Bank of New Y ork (FRBNY) and AIG, has purchased an additional $16 billion in par amount of multi-sector collateralized debt obligations (Multi-Sector CDOs). As a result, the associated credit default swap contracts and similar instruments(CDS) written by AIG Financial Products Corp. (AIGFP) have been terminated. ML III`s purchases of CDOs, in conjunction with the termination of related CDS, have mitigated AIG's liquidity issues in connection with its CDS and similar exposures on Multi-Sector CDOs.)Reserve Balance with Federal Reserve Banks(in billions of dollars)Federal Reserve assets in billions of dollars. Source: Macroblog.。
一、资产类项目分析1.总资产增长率对比通过对美联储和中国人民银行近八年来总资产增长速度的统计,我们发现,中国人民银行的总资产增长率大部分年份为正值,说明中国人民银行的总资产基本上呈现不断增长的趋势,相比而言,美联储在2008年以外的年份里,总资产增长率较低,且时正时负,说明美联储的总资产增长态势不是很明显。
但是,值得注意的是,在2008年金融危机爆发之际,美联储总资产增长率在3、4季度迅速拉升,全年总资产增长率高于100%,相比而言,中国人民银行并没有表现出太大的变化来,依然保持以外的增长率在增长。
由统计数据可知,金融危机对于美国的冲击迫使美联储大幅度增加流动性供给,而我国由于金融危机冲击较小,得以保持较低的增长率。
2.美联储各类资产总额分析在金融危机之前,各项资产所占比例变化不大,但金融危机改变了这一切。
2007年下半年以来,美国次贷危机愈演愈烈,为市场提供流动性,恢复市场信心美联储为应对金融危机采取了大量拯救措施,从图表中我们可以清晰地看出在次贷危机期间各项资产都有一个较大的变化。
联储一手通过多种创新工具向市场投放流动性,一手用卖出国债的方式回收流动性。
1.在金融危机之后可以从国内信贷的结构变化看出,直接持有债券的比例大幅下降。
2.新资产项目显著增多、数额巨大。
可以在其他资产的变化中看出自从09年央行流动性互换的新项目被提出,在金融危机之后的恢复阶段,几乎占了所有的其他资产,为恢复期做出了巨大的贡献。
3.国内信贷变化分析从上图可以看出,美国资产的重头集中于国内信贷部分,自金融危机爆发至今,其国内信贷增长趋势与资产项目增长趋势极为相似,其中直接持有证劵部分的增长与国内信贷的增长有很大的相关性,分析原因如下:1.美国政府持续推行QE量化宽松政策。
扩大货币发行,减少银行压力,放松银根,来向市场注入大量的流动性以复苏经济。
在金融危机全面爆发之后,美联储通过一系列救市政策增加相当规模的基础货币供应,除去低利率效应,其中1.25万亿美元MBS、3000亿美元美国国债和1750亿美元机构证券就向市场直接注入1.725万亿美元。
金融危机以来美联储资产负债表演变综述隋晓静(中国海洋大学经济学院,山东青岛266100)摘要:为应对金融危机带来的剧烈市场动荡,在传统货币政策失灵的背景下,美联储采取了一系列非常规货币政策,使其资产负债表的规模和结构发生巨大变化。
随着宏观经济复苏,货币政策正常化被提上议程。
本文按时间顺序对美联储资产负债表相关研究进行总结和梳理,并依此探究未来的研究方向。
关键词:美联储;资产负债表;大规模资产购买;货币政策正常化中图分类号:F830文献标识码:A文章编号:1005-913X (2020)04-0089-03收稿日期:2020-02-12作者简介:隋晓静(1993-),女,山东烟台人,硕士研究生,研究方向:产业组织与产业结构。
一、前言20世纪七十年代以来,美联储的货币政策一直是稳定宏观经济的重要工具。
金融危机前,美联储通过调整联邦基金利率目标范围来进行宏观经济调控。
但由于2007年次级抵押贷款市场的恶化导致信贷市场混乱,以及2008年底联邦基金利率目标下限达到零(Gertler 等,2015),无法进一步降低,这种传统的工具开始失效,美联储不得不使用非常规货币政策工具来复苏经济,即前瞻性指引和大规模资产购买(LSAPs )或称量化宽松(QE )政策。
LSAPs 对金融市场的影响力更大且持久,在刺激实体经济以及降低利率的不确定性方面更有效(Swanson ,2017)。
一系列非常规货币政策使得美联储资产负债表的规模与结构发生巨大变化,其重要性日益凸显,尤其在联邦基金利率目标下限为零的情况下,资产负债表的规模对于判断美联储的货币政策立场有重要作用(Eksi ,2017)。
美联储采取新的货币政策工具来达到其最大化就业和稳定物价的目的,非常规政策的实施收效显著,Powell (2017)认为货币政策宽松了近十年,美国经济已接近全面发展,劳动力市场前景良好,通货膨胀率处于其2%的目标下,应继续实施正常化计划。
For release at4:30 P.M. EDTOctober 27, 2011The weekly average values, shown in table 1, reflect the September 30, 2011, quarterly updates to the fair values of the net portfolio holdings of Maiden Lane LLC, Maiden Lane II LLC, and MaidenLane III LLC, and the fair value adjustment of the Term Asset-Backed Securities Loan Facility, orTALF, which is included in "Other Federal Reserve assets." The amounts for the first six days ofthis reporting week are based on the values as of June 30, 2011, and the amounts for the last day ofthe reporting week are based on the values as of September 30, 2011.FEDERAL RESERVE statistical releaseH.4.1Factors Affecting Reserve Balances of Depository Institutions and Condition Statement of Federal Reserve BanksOctober 27, 20111. Factors Affecting Reserve Balances of Depository InstitutionsMillions of dollarsAverages of daily figuresWednesday Oct 26, 2011Week ended Oct 26, 2011Change from week ended Oct 19, 2011Oct 27, 2010Reserve Bank credit, related items, andreserve balances of depository institutions at Federal Reserve BanksReserve Bank credit2,832,936- 4,886+ 550,177 2,828,719Securities held outright 12,636,744- 4,338+ 592,843 2,634,941U.S. Treasury securities 1,670,907+ 4,945+ 836,630 1,678,012Bills 218,423 0 0 18,423Notes and bonds, nominal 21,575,160+ 6,089+ 807,885 1,582,247Notes and bonds, inflation-indexed 2 67,596- 978+ 24,618 67,596Inflation compensation 39,729- 166+ 4,129 9,747Federal agency debt securities 2 107,668- 343- 42,511 107,668Mortgage-backed securities 4 858,169- 8,939- 201,276 849,261Repurchase agreements 5 0 0 0 0Loans11,096- 164- 36,748 11,004Primary credit 4+ 1- 20 1Secondary credit 0 0 0 1Seasonal credit38- 4+ 6 38Credit extended to American InternationalGroup, Inc., net 60 0- 19,273 0Term Asset-Backed Securities Loan Facility 7 11,053- 162- 17,463 10,964Other credit extensions0 0 0 0Net portfolio holdings of Maiden Lane LLC 8 13,093- 1,397- 14,877 12,929Net portfolio holdings of Maiden Lane II LLC 9 9,803- 53- 5,993 9,472Net portfolio holdings of Maiden Lane III LLC 10 20,416- 672- 2,526 18,015Net portfolio holdings of TALF LLC 11793+ 8+ 171 794Preferred interests in AIA Aurora LLC and ALICOHoldings LLC 6 0 0- 26,057 0Float-1,016+ 77+ 506 -788Central bank liquidity swaps 12 1,853 0+ 1,793 1,853Other Federal Reserve assets 13 140,154+ 1,651+ 41,066 140,499Gold stock11,041 0 0 11,041Special drawing rights certificate account 5,200 0 0 5,200Treasury currency outstanding 1444,146+ 14+ 697 44,146Total factors supplying reserve funds 2,893,323- 4,872+ 550,8742,889,105Note: Components may not sum to totals because of rounding. Footnotes appear at the end of the table.1. Factors Affecting Reserve Balances of Depository Institutions (continued)Millions of dollarsAverages of daily figuresWednesday Oct 26, 2011Week ended Oct 26, 2011Change from week ended Oct 19, 2011Oct 27, 2010Reserve Bank credit, related items, andreserve balances of depository institutions at Federal Reserve BanksCurrency in circulation 141,041,873- 943+ 80,490 1,043,254Reverse repurchase agreements 1580,396+ 40+ 23,507 81,316Foreign official and international accounts 80,396+ 40+ 25,120 81,316Others0 0- 1,613 0Treasury cash holdings142- 1- 79 124Deposits with F.R. Banks, other than reserve balances 131,396+ 28,602- 116,934 111,469Term deposits held by depository institutions 0- 5,077- 5,113 0U.S. Treasury, General Account64,369+ 20,966+ 26,450 55,187U.S. Treasury, Supplementary Financing Account 0 0- 199,961 0Foreign official 129- 1- 2,049 132Service-related2,510- 2+ 114 2,510Required clearing balances2,510- 2+ 114 2,510Adjustments to compensate for float 0 0 0 0Other64,388+ 12,716+ 63,626 53,640Funds from American International Group, Inc. assetdispositions, held as agent 60 0 0 0Other liabilities and capital 1671,081- 939- 1,33567,368Total factors, other than reserve balances,absorbing reserve funds1,324,888+ 26,760- 14,351 1,303,530Reserve balances with Federal Reserve Banks1,568,435- 31,631+ 565,2251,585,575Note: Components may not sum to totals because of rounding.1.Includes securities lent to dealers under the overnight securities lending facility; refer to table 1A.2.Face value of the securities.pensation that adjusts for the effect of inflation on the original face value of inflation-indexed securities.4.Guaranteed by Fannie Mae, Freddie Mac, and Ginnie Mae. Current face value of the securities, which is the remaining principal balance of the underlying mortgages.5.Cash value of agreements.6.As a result of the closing of the American International Group, Inc. (AIG) recapitalization plan on January 14, 2011, the credit extended to AIGwas fully repaid and the Federal Reserve’s commitment to lend any further funds was terminated. In addition, the Federal Reserve Bank of New York (FRBNY) has been paid in full for its preferred interests in AIA Aurora LLC and ALICO Holdings LLC. The funds from AIG asset dispositions that FRBNY held as agent were the source of repayment of the credit extended to AIG, as well as a portion of theFRBNY’s preferred interests in ALICO Holdings LLC. The remaining FRBNY preferred interests in ALICO Holdings LLC and AIA Aurora LLC, valued at approximately $20 billion, were purchased by AIG through a draw on the Treasury’s Series F preferred stock commitment and then transferred by AIG to the Treasury as consideration for the draw on the available Series F funds.7.Includes credit extended by the Federal Reserve Bank of New York to eligible borrowers through the Term Asset-Backed Securities Loan Facility.8.Refer to table 4 and the note on consolidation accompanying table 9.9.Refer to table 5 and the note on consolidation accompanying table 9.10.Refer to table 6 and the note on consolidation accompanying table 9.11.Refer to table 7 and the note on consolidation accompanying table 9.12.Dollar value of foreign currency held under these agreements valued at the exchange rate to be used when the foreign currency is returnedto the foreign central bank. This exchange rate equals the market exchange rate used when the foreign currency was acquired from the foreign central bank.13.Includes other assets denominated in foreign currencies, which are revalued daily at market exchange rates, and the fair value adjustmentto credit extended by the FRBNY to eligible borrowers through the Term Asset-Backed Securities Loan Facility. Before the closing of theAIG recapitalization plan on January 14, 2011, included accrued dividends on the FRBNY’s preferred interests in AIA Aurora LLC and ALICO Holdings LLC.14.Estimated.15.Cash value of agreements, which are collateralized by U.S. Treasury securities, federal agency debt securities, and mortgage-backed securities.16.Includes the liabilities of Maiden Lane LLC, Maiden Lane II LLC, Maiden Lane III LLC, and TALF LLC to entities other than the Federal ReserveBank of New York, including liabilities that have recourse only to the portfolio holdings of these LLCs. Refer to table 4 through table 7 and the note on consolidation accompanying table 9. Also includes the liability for interest on Federal Reserve notes due to U.S. Treasury. Refer to table 8and table 9.Sources: Federal Reserve Banks and the U.S. Department of the Treasury.1A. Memorandum ItemsMillions of dollars Averages of daily figuresWednesday Oct 26, 2011Week ended Oct 26, 2011Change from week ended Oct 19, 2011Oct 27, 2010Memorandum itemMarketable securities held in custody for foreignofficial and international accounts 1 3,397,254- 11,505+ 103,181 3,391,830U.S. Treasury securities 2,675,128- 10,853+ 112,951 2,669,910Federal agency securities 2 722,126- 652- 9,770 721,921Securities lent to dealers 12,720+ 1,413+ 7,268 13,996Overnight facility 312,720+ 1,413+ 7,268 13,996U.S. Treasury securities11,746+ 1,697+ 7,458 13,044Federal agency debt securities974- 284- 190952Note: Components may not sum to totals because of rounding.1.Face value of the securities. Includes U.S. Treasury STRIPS and other zero-coupon bonds at face value and mortgage-backed securities at originalface value.2.Includes debt and mortgage-backed securities.3.Fully collateralized by U.S. Treasury securities.2. Maturity Distribution of Securities, Loans, and Selected Other Assets and Liabilities, October 26, 2011Millions of dollars Within 15days 16 days to 90 days 91 days to 1 year Over 1 year to 5 years Over 5 years to 10 years Over 10years All Remaining maturityLoans 139 1 4,132 6,832 0 ... 11,004U.S. Treasury securities 2Holdings16,515 26,737 117,752 697,690 607,404 211,914 1,678,012Weekly changes- 3,520+ 3,520- 352- 8,505+ 14,088+ 2,525+ 7,756Federal agency debt securities 3Holdings0 6,170 19,596 63,409 16,146 2,347 107,668Weekly changes0 0+ 844- 844 0 0 0Mortgage-backed securities 4Holdings0 0 0 13 21 849,227 849,261Weekly changes0 0 0 0- 1- 12,813- 12,814Asset-backed securities held byTALF LLC 50 0 0 0 0 0 0Repurchase agreements 6 0 0 ... ... ... ... 0Central bank liquidity swaps 75001,3530 0 0 0 1,853Reverse repurchase agreements 6 81,316 0 ... ... ... ... 81,316Term deposits 0 0 0.........Note: Components may not sum to totals because of rounding.. . . Not applicable.1.Excludes the loans from the Federal Reserve Bank of New York (FRBNY) to Maiden Lane LLC, Maiden Lane II LLC, MaidenLane III LLC, and TALF LLC. The loans were eliminated when preparing the FRBNY’s statement of condition consistent with consolidation under generally accepted accounting principles.2.Face value. For inflation-indexed securities, includes the original face value and compensation that adjusts for the effect of inflation on theoriginal face value of such securities.3.Face value.4.Guaranteed by Fannie Mae, Freddie Mac, and Ginnie Mae. Current face value of the securities, which is the remaining principal balance of theunderlying mortgages.5.Face value of asset-backed securities held by TALF LLC, which is the remaining principal balance of the underlying assets.6.Cash value of agreements.7.Dollar value of foreign currency held under these agreements valued at the exchange rate to be used when the foreign currency is returned tothe foreign central bank. This exchange rate equals the market exchange rate used when the foreign currency was acquired from the foreign central bank.3. Supplemental Information on Mortgage-Backed SecuritiesMillions of dollarsWednesdayAccount nameOct 26, 2011Mortgage-backed securities held outright1 849,261 Commitments to buy mortgage-backed securities2 20,500 Commitments to sell mortgage-backed securities2 0Cash and cash equivalents3 01.Guaranteed by Fannie Mae, Freddie Mac, and Ginnie Mae. Current face value of the securities, which is the remaining principal balance of theunderlying mortgages.2.Current face value. Generally settle within 180 days and include commitments associated with outright transactions, dollar rolls, and coupon swaps.3.This amount is included in other Federal Reserve assets in table 1 and in other assets in table 8 and table 9.4. Information on Principal Accounts of Maiden Lane LLCMillions of dollarsWednesdayAccount nameOct 26, 2011Net portfolio holdings of Maiden Lane LLC1 12,929Outstanding principal amount of loan extended by the Federal Reserve Bank of New York2 9,882Accrued interest payable to the Federal Reserve Bank of New York2 745Outstanding principal amount and accrued interest on loan payable to JPMorgan Chase & Co.3 1,3721.Fair value. Fair value reflects an estimate of the price that would be received upon selling an asset if the transaction were to be conducted in anorderly market on the measurement date. Revalued quarterly. This table reflects valuations as of September 30, 2011. Any assets purchased after this valuation date are initially recorded at cost until their estimated fair value as of the purchase date becomes available.2.Book value. This amount was eliminated when preparing the Federal Reserve Bank of New York’s statement of condition consistent withconsolidation under generally accepted accounting principles. Refer to the note on consolidation accompanying table 9.3.Book value. The fair value of these obligations is included in other liabilities and capital in table 1 and in other liabilities and accrued dividends intable 8 and table 9.Note: On June 26, 2008, the Federal Reserve Bank of New York (FRBNY) extended credit to Maiden Lane LLC under the authority of section 13(3)of the Federal Reserve Act. This limited liability company was formed to acquire certain assets of Bear Stearns and to manage those assetsthrough time to maximize repayment of the credit extended and to minimize disruption to financial markets. Payments by Maiden Lane LLC fromthe proceeds of the net portfolio holdings will be made in the following order: operating expenses of the LLC, principal due to the FRBNY, interestdue to the FRBNY, principal due to JPMorgan Chase & Co., and interest due to JPMorgan Chase & Co. Any remaining funds will be paid to the FRBNY.5. Information on Principal Accounts of Maiden Lane II LLCMillions of dollarsWednesdayAccount nameOct 26, 2011Net portfolio holdings of Maiden Lane II LLC1 9,472Outstanding principal amount of loan extended by the Federal Reserve Bank of New York2 6,507Accrued interest payable to the Federal Reserve Bank of New York2 553Deferred payment and accrued interest payable to subsidiaries of American International Group, Inc.3 1,1001.Fair value. Fair value reflects an estimate of the price that would be received upon selling an asset if the transaction were to be conducted in anorderly market on the measurement date. Revalued quarterly. This table reflects valuations as of September 30, 2011. Any assets purchased after this valuation date are initially recorded at cost until their estimated fair value as of the purchase date becomes available.2.Book value. This amount was eliminated when preparing the Federal Reserve Bank of New York’s statement of condition consistent withconsolidation under generally accepted accounting principles. Refer to the note on consolidation accompanying table 9.3.Book value. The deferred payment represents the portion of the proceeds of the net portfolio holdings due to subsidiaries of AmericanInternational Group, Inc. in accordance with the asset purchase agreement. The fair value of this payment and accrued interest payable are included in other liabilities and capital in table 1 and in other liabilities and accrued dividends in table 8 and table 9.Note: On December 12, 2008, the Federal Reserve Bank of New York (FRBNY) began extending credit to Maiden Lane II LLC under the authorityof section 13(3) of the Federal Reserve Act. This limited liability company was formed to purchase residential mortgage-backed securities from the U.S. securities lending reinvestment portfolio of subsidiaries of American International Group, Inc. (AIG subsidiaries). Payments by Maiden Lane II LLC from the proceeds of the net portfolio holdings will be made in the following order: operating expenses of Maiden Lane II LLC, principal due tothe FRBNY, interest due to the FRBNY, and deferred payment and interest due to AIG subsidiaries. Any remaining funds will be shared by the FRBNY and AIG subsidiaries.6. Information on Principal Accounts of Maiden Lane III LLCMillions of dollarsWednesdayAccount nameOct 26, 2011Net portfolio holdings of Maiden Lane III LLC1 18,015Outstanding principal amount of loan extended by the Federal Reserve Bank of New York2 9,739Accrued interest payable to the Federal Reserve Bank of New York2 669Outstanding principal amount and accrued interest on loan payable to American International Group, Inc.3 5,5091.Fair value. Fair value reflects an estimate of the price that would be received upon selling an asset if the transaction were to be conducted in anorderly market on the measurement date. Revalued quarterly. This table reflects valuations as of September 30, 2011. Any assets purchased after this valuation date are initially recorded at cost until their estimated fair value as of the purchase date becomes available.2.Book value. This amount was eliminated when preparing the Federal Reserve Bank of New York’s statement of condition consistent withconsolidation under generally accepted accounting principles. Refer to the note on consolidation accompanying table 9.3.Book value. The fair value of these obligations is included in other liabilities and capital in table 1 and in other liabilities and accrued dividends intable 8 and table 9.Note: On November 25, 2008, the Federal Reserve Bank of New York (FRBNY) began extending credit to Maiden Lane III LLC under the authorityof section 13(3) of the Federal Reserve Act. This limited liability company was formed to purchase multi-sector collateralized debt obligations(CDOs) on which the Financial Products group of American International Group, Inc. (AIG) has written credit default swap (CDS) contracts. Inconnection with the purchase of CDOs, the CDS counterparties will concurrently unwind the related CDS transactions. Payments by Maiden LaneIII LLC from the proceeds of the net portfolio holdings will be made in the following order: operating expenses of Maiden Lane III LLC, principal dueto the FRBNY, interest due to the FRBNY, principal due to AIG, and interest due to AIG. Any remaining funds will be shared by the FRBNY andAIG.7. Information on Principal Accounts of TALF LLCMillions of dollarsWednesdayAccount nameOct 26, 2011Asset-backed securities holdings1 0Other investments, net 794Net portfolio holdings of TALF LLC 794Outstanding principal amount of loan extended by the Federal Reserve Bank of New York2 0Accrued interest payable to the Federal Reserve Bank of New York2 0Funding provided by U.S. Treasury to TALF LLC, including accrued interest payable3 1091.Fair value. Fair value reflects an estimate of the price that would be received upon selling an asset if the transaction were to be conducted in an orderlymarket on the measurement date.2.Book value. This amount was eliminated when preparing the Federal Reserve Bank of New York’s statement of condition consistent with consolidationunder generally accepted accounting principles. Refer to the note on consolidation accompanying table 9.3.Book value. The fair value of these obligations is included in other liabilities and capital in table 1 and in other liabilities and accrued dividends in table 8and table 9.Note: On November 25, 2008, the Federal Reserve announced the creation of the Term Asset-Backed Securities Loan Facility (TALF) under the authority of section 13(3) of the Federal Reserve Act. The TALF is a facility under which the Federal Reserve Bank of New York (FRBNY) extends loans with a term of up to five years to holders of eligible asset-backed securities. The TALF is intended to assist financial markets in accommodating the credit needs of consumers and businesses by facilitating the issuance of asset-backed securities collateralized by a variety of consumer and business loans. The loans provided through the TALF to eligible borrowers are non-recourse, meaning that the obligation of the borrower can be discharged by surrendering the collateral to the FRBNY. The loans are extended for the market value of the security less an amount known as a haircut. As a result, the borrower bears the initial risk of a decline in the value of the security.TALF LLC is a limited liability company formed to purchase and manage any asset-backed securities received by the FRBNY in connection with the decision of a borrower not to repay a TALF loan. TALF LLC has committed, for a fee, to purchase all asset-backed securities received by the FRBNY in conjunction with a TALF loan at a price equal to the TALF loan plus accrued but unpaid interest. Losses on asset-backed securities held by TALF LLC will be offset in the following order: by the commitment fees collected by TALF LLC, by the interest received on investments of TALF LLC, by up to $4.3 billion in subordinated debt funding provided by the U.S. Treasury, and finally, by senior debt funding provided by the FRBNY. Payments by TALF LLC from the proceeds of its net portfolio holdings will be made in the following order: operating expenses of TALF LLC, principal due to the FRBNY, principal due to the U.S. Treasury, interest due to the FRBNY, and interest due to the U.S. Treasury. Any remaining funds will be shared by the FRBNY and the U.S. Treasury.8. Consolidated Statement of Condition of All Federal Reserve Banks Millions of dollarsEliminations from consolidation WednesdayOct 26, 2011Change sinceWednesdayOct 19, 2011WednesdayOct 27, 2010Assets, liabilities, and capitalAssetsGold certificate account 11,037 0 0 Special drawing rights certificate account 5,200 0 0 Coin 2,346+ 63+ 158 Securities, repurchase agreements, and loans 2,645,944- 5,311+ 559,814 Securities held outright1 2,634,941- 5,059+ 596,375 U.S. Treasury securities 1,678,012+ 7,756+ 840,164 Bills2 18,423 0 0 Notes and bonds, nominal2 1,582,247+ 7,707+ 811,406 Notes and bonds, inflation-indexed2 67,596 0+ 24,618 Inflation compensation3 9,747+ 49+ 4,141 Federal agency debt securities2 107,668 0- 42,013 Mortgage-backed securities4 849,261- 12,814- 201,776 Repurchase agreements5 0 0 0 Loans 11,004- 251- 36,560 Net portfolio holdings of Maiden Lane LLC6 12,929- 191- 15,540 Net portfolio holdings of Maiden Lane II LLC7 9,472- 386- 7,000 Net portfolio holdings of Maiden Lane III LLC8 18,015- 2,802- 5,517 Net portfolio holdings of TALF LLC9 794+ 9+ 172 Preferred interests in AIA Aurora LLC and ALICOHoldings LLC10 0 0- 26,057 Items in process of collection (93) 329+ 67+ 45 Bank premises 2,186+ 3- 40 Central bank liquidity swaps11 1,853 0+ 1,793 Other assets12 138,270+ 1,746+ 42,113 Total assets (93) 2,848,375- 6,802+ 549,941 Note: Components may not sum to totals because of rounding. Footnotes appear at the end of the table.8. Consolidated Statement of Condition of All Federal Reserve Banks (continued) Millions of dollarsEliminations from consolidation WednesdayOct 26, 2011Change sinceWednesdayOct 19, 2011WednesdayOct 27, 2010Assets, liabilities, and capitalLiabilitiesFederal Reserve notes, net of F.R. Bank holdings 1,001,574+ 421+ 79,249 Reverse repurchase agreements13 81,316+ 848+ 25,764 Deposits (0) 1,697,001- 4,495+ 451,726 Term deposits held by depository institutions 0- 5,077- 5,113 Other deposits held by depository institutions 1,588,042+ 16,356+ 577,437 U.S. Treasury, General Account 55,187- 13,205+ 27,958 U.S. Treasury, Supplementary Financing Account 0 0- 199,961 Foreign official 132- 6- 1,569 Other (0) 53,640- 2,563+ 52,975 Deferred availability cash items (93) 1,117- 279- 949 Other liabilities and accrued dividends14 15,311- 3,313- 591Total liabilities (93) 2,796,319- 6,817+ 555,199Capital accountsCapital paid in 26,028+ 8- 687 Surplus 26,028+ 8+ 130 Other capital accounts 0 0- 4,700Total capital 52,057+ 17- 5,256 Note: Components may not sum to totals because of rounding.1.Includes securities lent to dealers under the overnight securities lending facility; refer to table 1A.2.Face value of the securities.pensation that adjusts for the effect of inflation on the original face value of inflation-indexed securities.4.Guaranteed by Fannie Mae, Freddie Mac, and Ginnie Mae. Current face value of the securities, which is the remaining principal balance of theunderlying mortgages.5.Cash value of agreements, which are collateralized by U.S. Treasury and federal agency securities.6.Refer to table 4 and the note on consolidation accompanying table 9.7.Refer to table 5 and the note on consolidation accompanying table 9.8.Refer to table 6 and the note on consolidation accompanying table 9.9.Refer to table 7 and the note on consolidation accompanying table 9.10.As a result of the closing of the AIG recapitalization plan on January 14, 2011, the Federal Reserve Bank of New York has been paid in fullfor its preferred interests in AIA Aurora LLC and ALICO Holdings LLC. A portion of the preferred interests was redeemed by AIG with the funds from AIG asset dispositions that were held as agent by the Federal Reserve.11.Dollar value of foreign currency held under these agreements valued at the exchange rate to be used when the foreign currency is returned tothe foreign central bank. This exchange rate equals the market exchange rate used when the foreign currency was acquired from the foreign central bank.12.Includes other assets denominated in foreign currencies, which are revalued daily at market exchange rates and the fair value adjustment tocredit extended by the Federal Reserve Bank of New York (FRBNY) to eligible borrowers through the Term Asset-Backed Securities Loan Facility.Before the closing of the AIG recapitalization plan on January 14, 2011, included accrued dividends on the FRBNY’s preferred interests in AIA Aurora LLC and ALICO Holdings LLC.13.Cash value of agreements, which are collateralized by U.S. Treasury securities, federal agency debt securities, and mortgage-backed securities.14.Includes the liabilities of Maiden Lane LLC, Maiden Lane II LLC, Maiden Lane III LLC, and TALF LLC to entities other than the FederalReserve Bank of New York, including liabilities that have recourse only to the portfolio holdings of these LLCs. Refer to table 4 through table 7 and the note on consolidation accompanying table 9. Also includes the liability for interest on Federal Reserve notes due to U.S. Treasury. Before the closing of the AIG recapitalization plan on January 14, 2011, included funds from American International Group, Inc. asset dispositions, held as agent.H.4.110. Collateral Held against Federal Reserve Notes: Federal Reserve Agents’ AccountsMillions of dollarsWednesday Federal Reserve notes and collateralOct 26, 2011 Federal Reserve notes outstanding 1,177,317 Less: Notes held by F.R. Banks not subject to collateralization 175,743 Federal Reserve notes to be collateralized 1,001,574 Collateral held against Federal Reserve notes 1,001,574 Gold certificate account 11,037 Special drawing rights certificate account 5,200 U.S. Treasury, agency debt, and mortgage-backed securities pledged1,2 985,337 Other assets pledged 0 Memo:Total U.S. Treasury, agency debt, and mortgage-backed securities1,2 2,634,941 Less: Face value of securities under reverse repurchase agreements 71,709 U.S. Treasury, agency debt, and mortgage-backed securities eligible to be pledged 2,563,232 Note: Components may not sum to totals because of rounding.1.Includes face value of U.S. Treasury, agency debt, and mortgage-backed securities held outright, compensation toadjust for the effect of inflation on the original face value of inflation-indexed securities, and cash value of repurchaseagreements.2.Includes securities lent to dealers under the overnight securities lending facility; refer to table 1A.。
美联储资产负债表解读MILASS我们都知道,一国(或地区)的法定货币是由该国(或地区)的货币发行机构发行,而这个发行机构通常是该国(或地区)的中央银行(非中央银行发行的情况,本文不累述)。
狭义的法定货币是指中央银行发行的钞票。
广义的法定货币又分基础货币和广义货币(M2或M3,各国定义的标准有一定差异)。
基础货币的供应是由中央银行来实现的,而派生货币供应(广义货币除去基础货币)则是由商业银行来实现。
一般来讲,基础货币的发行是需要保证物背书的,这些保证物可以是贵金属、金融票据、外国货币以及实物等资产。
也就是说,央行通过购买这些资产来发行基础货币。
而在实际操作过程当中,我们发现央行充当了最后贷款人的角色,央行通过再贴现、再贷款等方式直接向金融机构、甚至是政府部门进行资金融通,发行基础货币。
中央银行在履行货币发行、执行货币政策等职能时,这些业务活动所形成的债权债务,就构成了央行的资产负责表。
下面笔者就以美国联邦储备银行的资产负债表为例,来和大家探讨全球结算货币——美元的发行。
在此之前,我们先来看看中央银行资产负债表的基本概念和内容。
一.定义中央银行资产负债表的定义是:中央银行在履行职能时,业务活动所形成的债权债务存量表。
中央银行资产负债业务的种类、规模和结构都综合地反映在资产负债表上。
二.内容中央银行资产负债表的内容包括:1.负债项目(1)流通中的货币作为发行的银行,发行货币是中央银行的基本职能,也是中央银行的主要资金来源,中央银行发行的货币通过再贴现、再贷款、购买有价证券和收购黄金、外汇投入市场,成为流通中的货币,成为中央银行对公众的负债。
(2)各项存款包括政府和公共机构存款、商业银行等金融机构存款。
作为国家的银行,政府通常会赋予中央银行代理国库的职责,政府和公共机构存款由中央银行办理。
作为银行的银行,中央银行的金融机构存款包括了商业银行缴存准备金和用于票据清算的活期存款。
(3)其他负债包括对国际金融机构的负债或中央银行发行债券。
美联储资产负债表的原理
美联储的资产负债表是一个复杂的系统,主要涉及资产和负债两个方面。
以下是其运作原理:
1. 资产端:美联储的资产主要包括各种金融工具,如美国国债、抵押支持证券和联邦机构证券等。
这些资产是通过公开市场操作购买的,旨在增加银行体系的流动性并影响利率水平。
2. 负债端:美联储的负债主要包括货币发行、联邦储备存款和政府存款等。
其中,货币发行是美联储最主要的负债,通过印制美元来满足市场需求。
联邦储备存款是银行和其他金融机构在美联储的存款,用于满足其储备金要求。
政府存款则是政府在美联储的存款,主要来自于财政收入和支出。
美联储通过调整其资产负债表规模和结构,可以影响市场上的货币供应量和利率水平,进而实现货币政策目标。
例如,当美联储认为经济增长过快、通货膨胀率过高时,可以通过卖出持有的证券、减少资产规模等方式,减少市场上的货币供应量,进而抑制通货膨胀和经济增长。
相反,如果经济出现衰退、通货紧缩等情况,美联储可以通过购买证券、增加资产规模等方式,增加市场上的货币供应量,刺激经济增长。
总之,美联储的资产负债表是其货币政策的重要工具之一,通过调整资产负债表的规模和结构,可以影响市场上的货币供应量和利率水平,进而实现货币政策目标。