孔结构
- 格式:ppt
- 大小:721.50 KB
- 文档页数:23

孔隙结构分类
孔隙结构的分类主要有以下几种:
1. 按孔隙成因分类:孔隙可分为原生孔隙和次生孔隙。
原生孔隙是在沉积成岩过程中形成的,不受后期成岩作用的影响;次生孔隙则是受沉积后压实作用和成岩作用的影响形成的。
2. 按孔隙产状分类:根据孔隙的产状,孔隙可分为粒间孔隙、粒内孔隙、微孔隙及裂缝孔隙等四种类型。
3. 按孔隙大小分类:孔隙可分为超毛细管孔隙、毛细管孔隙和微毛细管孔隙等。
4. 按孔隙空间构造分类:孔隙可分为孔隙缩小型、孔隙展大型、孔隙裂缝型等。
5. 按流体渗滤及几何特征的裂缝性碳酸盐岩孔隙结构分类:孔隙可分为裂缝型、缝洞型、裂缝-孔洞型和无规则型等。
总的来说,不同的分类标准使孔隙结构变得多种多样,具体使用哪一种分类方法应根据具体研究或工程实践的目的和要求来确定。

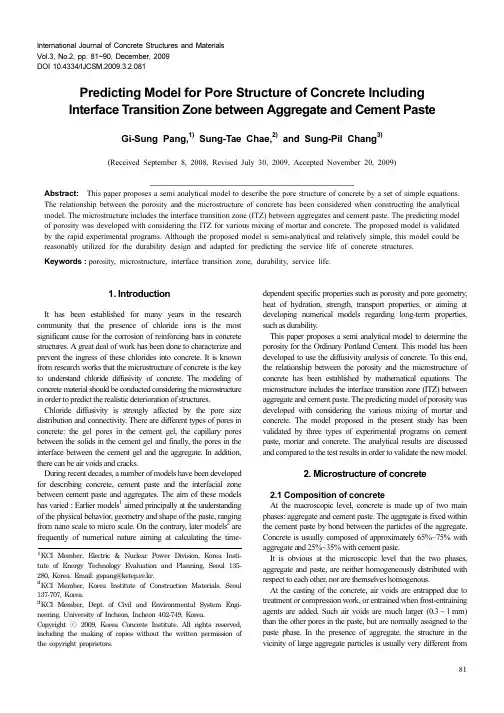
International Journal of Concrete Structures and MaterialsVol.3, No.2, pp. 81~90, December, 2009DOI 10.4334/IJCSM.2009.3.2.081Predicting Model for Pore Structure of Concrete IncludingInterface Transition Zone between Aggregate and Cement PasteGi-Sun g Pan g,1) Sun g-Tae Chae,2) an d Sun g-Pil Chan g3)(Received September 8, 2008, Revised July 30, 2009, Accepted November 20, 2009)Abstract:This paper proposes a semi analytical model to describe the pore structure of concrete by a set of simple equations. The relationship between the porosity and the microstructure of concrete has been considered when constructing the analytical model. The microstructure includes the interface transition zone (ITZ) between aggregates and cement paste. The predicting model of porosity was developed with considering the ITZ for various mixing of mortar and concrete. The proposed model is validated by the rapid experimental programs. Although the proposed model is semi-analytical and relatively simple, this model could be reasonably utilized for the durability design and adapted for predicting the service life of concrete structures. Keywords:porosity, microstructure, interface transition zone, durability, service life.1. IntroductionIt has been established for many years in the research community that the presence of chloride ions is the most significant cause for the corrosion of reinforcing bars in concrete structures. A great deal of work has been done to characterize and prevent the ingress of these chlorides into concrete. It is known from research works that the microstructure of concrete is the key to understand chloride diffusivity of concrete. The modeling of concrete material should be conducted considering the microstructure in order to predict the realistic deterioration of structures. Chloride diffusivity is strongly affected by the pore size distribution and connectivity. There are different types of pores in concrete: the gel pores in the cement gel, the capillary pores between the solids in the cement gel and finally, the pores in the interface between the cement gel and the aggregate. In addition, there can be air voids and cracks.During recent decades, a number of models have been developed for describing concrete, cement paste and the interfacial zone between cement paste and aggregates. The aim of these models has varied ; Earlier models1 aimed principally at the understanding of the physical behavior, geometry and shape of the paste, ranging from nano scale to micro scale. On the contrary, later models2 are frequently of numerical nature aiming at calculating the time-dependent specific properties such as porosity and pore geometry, heat of hydration, strength, transport properties, or aiming at developing numerical models regarding long-term properties, such as durability.This paper proposes a semi analytical model to determine the porosity for the Ordinary Portland Cement. This model has been developed to use the diffusivity analysis of concrete. To this end, the relationship between the porosity and the microstructure of concrete has been established by mathematical equations. The microstructure includes the interface transition zone (ITZ) between aggregate and cement paste. The predicting model of porosity was developed with considering the various mixing of mortar and concrete. The model proposed in the present study has been validated by three types of experimental programs on cement paste, mortar and concrete. The analytical results are discussed and compared to the test results in order to validate the new model.2. Microstructure of concrete2.1 Composition of concreteAt the macroscopic level, concrete is made up of two main phases: aggregate and cement paste. The aggregate is fixed within the cement paste by bond between the particles of the aggregate. Concrete is usually composed of approximately 65%~75% with aggregate and 25%~35% with cement paste.It is obvious at the microscopic level that the two phases, aggregate and paste, are neither homogeneously distributed with respect to each other, nor are themselves homogenous.At the casting of the concrete, air voids are entrapped due to treatment or compression work, or entrained when frost-entraining agents are added. Such air voids are much larger (0.3~1mm) than the other pores in the paste, but are normally assigned to the paste phase. In the presence of aggregate, the structure in the vicinity of large aggregate particles is usually very different from1)KCI Member, Electric & Nuclear Power Division, Korea Insti-tute of Energy Technology Evaluation and Planning, Seoul 135-280, Korea. Email: gspang@ketep.re.kr.2)KCI Member, Korea Institute of Construction Materials, Seoul137-707, Korea.3)KCI Member, Dept. of Civil and Environmental System Engi-neering, University of Incheon, Incheon 402-749, Korea.Copyright ⓒ 2009, Korea Concrete Institute. All rights reserved,includ ing the making of copies without the written permission ofthe copyright proprietors.8182│International Jou rnal of Concrete Stru ctu res and Materials (Vol.3 No.2, December 2009)that of the bulk paste. There is a third phase, the transition zone,which represents the interfacial region between the large aggregate particles and the cement paste. A schematic picture of the composition of concrete is shown in Fig. 1.2.2 Microstructure of cement pasteWhen cement and water are mixed, the cement reacts with the water to form a porous conglomerated mass of fine crystal-like gel particles constituting the cement gel, see Fig. 2. The main volume of the gel consists of calcium-silicate-hydrate (C-S-H) products in which calcium hydroxide (CH) is incorporated, and the gel volume grows as the hydration proceeds. Part of the original volume not occupied by gel consists of capillary pores, which are much coarser than gel pores. Y oung pastes have a inter-connected capillary-pore system but, as hydration proceeds, the hydration products grow into the capillary pores resulting in the reduction of the capillary pore volume.Photographs taken by an SEM microscope, one of the specimen tested in the present work are shown in Fig. 3 obtained from theprevious research.3The physical structure of the cement paste can be discerned to some extent there. The fluffy balls consist of hydrated C-S-H gels that have grown into the capillary pores. The internal porosity of the cement paste is high, as can be seen. The CH grows inside the C-S-H, or between the parts of it. It is limited in size by the space available.The older the cement paste becomes the denser and the more featureless the C-S-H gel appears. T obermorite and Jennit are natural minerals that resemble C-S-H gel. This has an extraordinarily high internal surface area as measured by water adsorption, in the range of 250 ~ 450m 2/g or 100 ~ 700m 2/g.4,52.3 Volume relationship of cement pasteA classification of the porosity of cement paste is given in T able 1.4Table 1 shows there is an enormous range of pore size distribution,from 10µm to less than 0.5nm in diameter. It is known that the pore size distributions are mainly affected by the w/c ratio and the degree of hydration. As can be seen in Table 1, porosity over the whole size range of pores has an influence on paste properties. Y et it is difficult to get an exact assessment of pore-size distributions because no one measurement encompasses the whole size range and because it is difficult to interpret experimental data. Thus,comparisons of porosity should be made with care.4Basic volume relationships between cement, cement gel, gel pores, capillary pores and water in cement paste are shown in Figs. 4 and 5. Figure 4 shows that the volume relationship in cement paste varies with increasing hydration. As shown in Fig. 5,increasing w/c ratio results in increasing capillary pore volume,but maintaining the constant level of gel pores.Fig. 2 Development of the struc ture of c ement paste ac c ording to Powers.1Fig. 3 SEM photograph.3Fig. 1 Sc hematic pic ture of the c omposition of c onc rete.International Jou rnal of Concrete Stru ctu res and Materials (Vol.3 No.2, December 2009)│833. Analytical model of pore structure ofconcrete3.1 Porosity of cement pasteIn this study, the structure of the concrete is based on a structural model described in Fagerlund,6 which is based on the work ofPowers.1The model is described mathematically by a set of simple equations, for calculating the volume fraction of the ordinary Portland cement, hydration products (gel) and pores. Powers proposed certain empirically based equations, derived from experimental data. The equations do not distinguish between the various hydration states and different types of the hydration products, all are regardedas cement gel. Besides, a given increase in degree of hydration is assumed to create the same amount and structure of cement gel irrespectively of at what hydration state this additional hydration occurs.The total pore volume (V p )p of the cement paste is as shown in Fig. 6.(1)where (V p )p =total pore volume of the cement paste (m 3); W =content of water mixed (kg); W n =chemically bound water (kg);ρw =density of water (kg/m 3); and w/c =water to cement ratio.In the above model, it is assumed that the chemically bound water “decreases” in volume to 0.75 of the volume it had prior to hydration, and the water bound chemically in the hydration process is , where α=degree of hydration (−). The typical value of k is 0.23.For the following expression, the maximum possible degree of hydration, αmax equal to (w/c)/(w/c)*, must be substituted for a if w/c ≤w/c *. The typical value of w/c * is 0.38.The compact volume, i.e. the solid volume without any pores,of the cement paste (V 0)p is;(2)where (V 0)p =compact volume of the cement paste (m 3),ρc =density of the cement (kg/m 3)The total volume of the cement paste V p is the sum of the pore volume and the compact volume (3)The total porosity of the cement paste P p is (4)The ratio of the volume of hydration product to that of the cement from which it is formed may be calculated by dividing the former quantity by the volume of cement reacted per unit mass ofcement, which is α/ρc , giving . Therefore, theV p ()p W 0.75W n –ρw ---------------------------W 0.75k αC –ρw ------------------------------Cρw-----w/c 0.75k α–()===k αC ⋅⋅V o ()p C ρ---c 0.75W n ρw -----------------+C ρw -----ρwρc-----0.75k α+⎝⎠⎛⎞==V p V p ()p V 0()p +C ρw -----ρwρc-----w/c +⎝⎠⎛⎞==P p V p ()p V p------------w/c 0.75k α–ρw ρc-----w/c +------------------------------==1w/c ()*ρc /ρw +Table 1 Classific ations of the pore sizes in hydrated c ement.Type Diameter (nm)Description Role of waterPaste properties affectedCapillary pores 50~10,000Large capillariesBehaves as bulk waterStrength, permeability10~50Medium-sized capillaries Moderate surface tension forces generated Strength. permeability; shrinkage at high humidity Gel pores2.5~10Small (gel) capillaries Strong surface tension forces generated Shrinkage to 50% RH 0.5~2.5MicroporesStrongly adsorbed water; no menisci form Shrinkage, creep <~0.5Micropores “interlayer”Structural water involved in bondingShrinkage, creepFig. 4 Volume relationship of hydrated pastes by c hangingdegree of hydration.4Fig. 5 Volume relationship of hydrated pastes by c hanging w/cratios.4Fig. 6 Volume relationships among constituents of the hydratedpaste.84│International Jou rnal of Concrete Stru ctu res and Materials (Vol.3 No.2, December 2009)volume of the cement gel is;(5)It is assumed that the cement gel formed during hydration has aporosity of 28%, therefore the volume of the gel pores (V gel )p is;(6)The gel porosity of the cement paste P gel is (7)The volume of the capillary pores (V cap )p in the cement paste is =(8)The capillary porosity P cap of the paste is(9)3.2 Interfacial zones between cement paste and aggregateThe structure of aggregate depends on the types of minerals in the aggregate and on its geological history which differ markedly from one location to another. In Korea, fractions of crushed granite and gneiss are normally used. Such aggregates are hard, tight and not easily dissolved. Although the porosity is low, only about 0~1%,the pores in these types of aggregate are quite coarse and are often so interconnected that the permeability and the diffusivity of for example, granite, are in parity with that of cement paste of a highw/c ratio.5,7Between the cement paste and the aggregate there is a thin,rather porous inter-facial zone (sometimes called the transition zone, tz), see Fig. 7. It becomes increasingly porous during hydration and normally has a larger content of CH-crystals than the bulk paste located farther from the aggregate does. This zone may also crack due to differences in modulus of elasticity and strength of aggregate and cement paste. Referring to the work of other researchers,Winslow et al.2 noted a region of approximately 50nm thickness which, has quite different properties than the rest of the bulk paste.Bourdette et al.8 estimated from the literature the transition zone (tz) to be 30µm thick. Using their models of hydration around the tz, they obtained results for porosity three times as high in tz as in the bulk paste, although it decreased with hydration age, whereas the porosity of the bulk paste remained relatively constant.3.3 Porosity and density of concreteFor mortar and concrete, additional porosity occurs in pore sizeslarger than the plain paste’s threshold diameter measured by mercury intrusion porosimetry (MIP).2 In Winslow et al., mortars with a w/c of 0.4 were made with aggregate of different ratios.The samples were hydrated in lime-saturated water for 28 days and were then oven dried at 105o C. The pore size distributions of the pastes were obtained by MIP . An average thickness of the paste surrounding each aggregate particle was calculated by dividing the volume of paste in the mixture by the surface area of the sand in the mixture. A computer program for random particle placement, percolation assessment and phase fraction estimation was developed. By executing the program for different number of aggregate particles, the volume fraction of aggregate required for interfacial zone percolation for a given aggregate size distribution and interfacial zone thickness was determined and compared to experimental results. An interfacial zone thickness of 15~20µm was found to be most consistent with results of the experiments.In this study, the volume of tz is calculated from the concept of equivalent radius of aggregate and thickness of tz. It is assumed that maximum thickness of tz is 30mm, which increases by degree of hydration. The equivalent radius of aggregate is calculated from the size distribution of sand and coarse aggregate as follows;(10)where r e =equivalent radius of aggregate, t TZ =thickness of tz,r i =radius of aggregate used and m i =mass ratio of aggregate, r i ,in this study, t TZ =30 (µm).In this study, the pore volume of aggregate is ignored. The volume of aggregate is (11)where β=G/CIt is assumed that the volume of tz is proportion to degree of hydration. The total volume of tz is calculated as follows;(12)V gel C αρc -------1w/c ()*ρc ρw -----+⎝⎠⎛⎞C αρw -------ρw ρc-----w/c ()*+⎝⎠⎛⎞==V gel ()p 0.28V gel 0.28αC ρw -------ρwρc-----w/c ()*+⎝⎠⎛⎞==P gel V gel ()p V p---------------0.28αρw ρc -----w/c ()*+⎝⎠⎛⎞/ρw ρc -----w/c ()+⎝⎠⎛⎞==V cap ()p V p ()p V gel ()p –=Cρw-----w /c 0.75k 0.28ρw ρc -----w/c ()*+⎝⎠⎛⎞+⎝⎠⎛⎞α–P capw /c 0.75k 0.28ρwρc-----w /c ()*+⎝⎠⎛⎞+α–ρwρc-----w /c +-----------------------------------------------------------------------------------=r e t TZ +()3r e ()3–r i t TZ +()3r i ()3–[]m i∑=V a G ρG ------C ρw -----ρw ρG ------β⎝⎠⎛⎞==V TZ 1t TZ r e ------+⎝⎠⎛⎞31–G ρG ------α1t TZ r e ------+⎝⎠⎛⎞31–C ρw -----ρw ρG ------β⎝⎠⎛⎞α==Fig. 7 Sc hematic representation of the transition zone.5International Jou rnal of Concrete Stru ctu res and Materials (Vol.3 No.2, December 2009)│85where G =aggregate content, ρG =density of aggregate.The porosity of tz is three times as high as in the bulk cement paste,8the pore volume of tz can be calculated;(13)The total pore volume of the mortar or concrete is as shown in Fig. 8. The Equation (1) is modified since pore volume of tz and airs are included.(14)The total volume of the mortar or concrete is; (15)The total porosity of mortar or concrete is (16)It is assumed that the volume of gel pore is same as the cement past, so gel porosity of concrete is =(17)The pore volume of tz is included in the volume of the capillary pore in the mortar or concrete because pore size of tz belongs to capillary pore. The volume of capillary pore and porosity are; (18)The porosity of cement paste in mortar and concrete is; (19)V TZ ()p 3w/c 0.75k α–ρw ρc-----w/c +------------------------------1t TZ r e ------+⎝⎠⎛⎞31–C ρw -----ρw ρG ------β⎝⎠⎛⎞α=V c ()p V p ()p V TZ ()p V air ++Cρw-----w/c 0.75k α–()==3+w/c 0.75k α–ρwρc-----w/c +------------------------------1t TZ r e ------+⎝⎠⎛⎞31–C ρw -----ρw ρG ------β⎝⎠⎛⎞αV air +V c V a V p V TZ V air +++C ρw -----ρw ρG ------β⎝⎠⎛⎞C ρw -----ρw ρc -----w/c +⎝⎠⎛⎞+== 1t TZ r e ------+⎝⎠⎛⎞31–C ρw -----ρw ρG ------β⎝⎠⎛⎞αV air ++P c V c ()pV c------------=w/c 0.75k α–()3w/c 0.75k α–ρw ρc-----w/c +-----------------------------1t TZ r e ------+⎝⎠⎛⎞31–ρw ρG-----β⎝⎠⎛⎞αρw C -----V air++ρw ρc -----w/c +⎝⎠⎛⎞11t TZ r e ------+⎝⎠⎛⎞31–α+⎝⎠⎛⎞ρw ρG-----β⎝⎠⎛⎞ρw C -----V air++-------------------------------------------------------------------------------------------------------------------------------------------------P gel c,V gel ()p V c---------------=0.28αρwρc -----w/c ()*+⎝⎠⎛⎞ρw ρc -----w/c +⎝⎠⎛⎞11t TZ r e ------+⎝⎠⎛⎞31–α+⎝⎠⎛⎞ρw ρG ------β⎝⎠⎛⎞ρw C-----V air++----------------------------------------------------------------------------------------------------------------------P cap c ,V p ()p V gel ()p V TZ ()p+–V c------------------------------------------------------=w/c α0.75k 0.28ρwρc -----w/c ()*+⎝⎠⎛⎞+⎝⎠⎛⎞–= 3w/c 0.75k α–ρw ρc-----w/c +------------------------------1t TZ r e ------+⎝⎠⎛⎞31–ρw ρG------β⎝⎠⎛⎞α+ρw ρc -----w/c +⎝⎠⎛⎞11t TZ r e ------+⎝⎠⎛⎞31–α+⎝⎠⎛⎞ρw ρG------β⎝⎠⎛⎞ρwC -----V air++------------------------------------------------------------------------------------------------------------------------P ′gel c ,V gel ()pV c V a–---------------=0.28αρw ρc -----w/c ()*+⎝⎠⎛⎞ρw ρc -----w/c +⎝⎠⎛⎞1t TZ r e ------+⎝⎠⎛⎞31–αρw ρG------β⎝⎠⎛⎞ρw C -----V air++-------------------------------------------------------------------------------------------------------------=Fig. 8 Sc hematic volume frac tions of pores and solid materials.86│International Jou rnal of Concrete Stru ctu res and Materials (Vol.3 No.2, December 2009)(20)4. Experiments4.1 Materials and mixture proportionsThe three types of experiments (cement paste, mortar, and concrete) were conducted for the evaluation of porosity. The materials used and mixture properties are summarized in Table 2,Tables 3 and 4. The Ordinary Portland Cement was used for all experiments and porosities are tested at various times, such as 1, 3,7, 14, 28 and 91days.The water-binder ratios of cement pastes are 0.3, 0.35, 0.4, 0.5,0.6 and 0.7 in cement paste. For evaluating the effects of aggregate,mortar were manufactured. The main variables are w/c (0.4, 0.5,0.55, 0.6 and 0.65) and the mass ratio of sand and cement (S/c =1,1.5 and 2). The maximum sizes of fine and coarse aggregate are 5mm, 13mm respectively and various w/c ratios (0.4, 0.5 and 0.6) are used.4.2 Test methodsMercury Intrusion Porosimetry (MIP) is a technique used tomeasure pore size distribution, and has an advantage in that it is able to span the measurement of pore sizes ranging from a few nanometres, to several hundred micrometers. As concrete has a distribution of pore sizes ranging from sub-nanometer to many millimeters, MIP has formed an important tool in the characterization of pore size distribution and total volume of porosity.The specimens are dried to remove all moisture from the pore structure. They are then placed into sealed “penetrometers” which are weighed both before and after being loaded with the specimen.The penetrometers are placed into the machine where they are evacuated and then filled with mercury. The pressurized testing then commences and the machine calculates and records how much mercury is being forced into the pore structure.The degree of hydration, α, is defined as the fraction of cement that has fully hydrated. For the present experiments, α was determined experimentally by comparing the amount of non-evaporable water in a sample to the amount needed for complete hydration. To determine the non-evaporable water content, four dried specimens from each paste group were subjected to ignitionat 800oC for 2h, cooled in vacuum desiccators at less than 20Pa for 1h, and then weighed. The water in the paste that was not removed by the drying process, W n , (also known as the non-evaporable water) is then estimated as shown in Eq. (21).(21)where, w 1 and w 2 are the weights of the dry specimen before and after ignition, respectively.The degree of hydration can then be calculated as shown in Eq.(22)(22)where (W n /C )* is the non-evaporable water corresponding to a completely hydrated paste. The typical value of it is 0.25.The total porosity of specimen is calculated by Eq. (23).(23)where, W 1, W 2, and W 3 are weight after 105oC oven dry, weight in water and weight in surface dry condition.4.3 MeasurementsThe results obtained from the instrument are;1)pore size distribution(macro/meso range of porosity spectrum)2)hysteresis curve, specific surface, bulk density 3)total porosity (%), particle size distributionThe non-evaporable water contents by degree of hydration, the measured results are summarized in Table 5. The porosities of capillary pore volume were obtained by MIP . The effects of water/cement ratios and sand contents on porosity are estimated by MIP .For various degree of hydration, porosities of specimens are measured and the results are summarized in Table 6.w/c α0.75k 0.28ρwρc -----w/c ()*+⎝⎠⎛⎞+⎝⎠⎛⎞–P ′cap c ,= 3w/c 0.75k α–ρw ρc-----w/c +------------------------------1t TZ r e ------+⎝⎠⎛⎞31–ρw ρG ------β⎝⎠⎛⎞α+ρw ρc -----w/c +⎝⎠⎛⎞1t TZ r e ------+⎝⎠⎛⎞31–αρw ρG------β⎝⎠⎛⎞+------------------------------------------------------------------------------------------------------------------------W n w 1w 2–w 2----------------C =αW nW n /C ()*C -----------------------W n 0.25C--------------==P t W 3W 1–W 3W 2–------------------=Table 2 Mixture proportions for c ement pastes.ID w/c (-)Cement (kg)Type of cementCP 0.3, 0.35, 0.4, 0.5, 0.6, 0.7300OPCTable 3 Mixture proportions for c onc rete spec imens.Specimenw/b (-)Water (kg m -3)Binder (kg m -3)Sand (kg m -3)Gravel (kg m -3)Type of cementC400.41403507421,135OPC C500.51583507241,107OPC C600.61753507071,080OPCTable 4 Mixture proportions for mortar spec imens.Specimen w/c (-)Water (kg)Cement (kg)Sand (kg)Type of cement M1-10.4120300300OPC M1-1.50.4120300450OPC M1-20.4120300600OPC M2-10.5150300300OPC M2-1.50.5150300450OPC M2-20.5150300600OPC M30.55165300600OPC M40.6180300600OPC M50.65195300600OPCInternational Jou rnal of Concrete Stru ctu res and Materials (Vol.3 No.2, December 2009)│875. Validation of analytical model5.1 Model for cement pasteFor validating of the proposed model, the predicted values by Eq. (4) are comprised with data of other researchers as shown in Fig. 9. Figure 9 includes porosities derived from calculated phase compositions, the degree of hydration is assumed to be the valueof maximum and a specific volume of cement is 3.17×10⁻⁴ m 3kg -1.As expected, the capillary porosities decreased with the increase of the degree of hydration and the water/cement ratio for all specimens as shown in Fig. 10; capillary pore space is filled with cement hydrates by hydration reaction (pore volume of gel increases by degree of hydration). From the Fig. 10, the predicted values by Eq. (9) are very similar with the measurements.Table 5 Measured properties of c ement paste.TypeTime (days)137142891w/c =0.3W n (kg m -3)23.82 27.91 30.06 30.92 33.02 35.10 α (-)0.345 0.404 0.436 0.448 0.479 0.509 P p (-)0.269 0.225 0.201 0.178 0.170 0.159 w/c =0.35W n (kg m -3)-26.91 29.95 ---α (-)-0.390 0.434 ---P p (-)-0.315 0.285 ---w/c =0.4W n (kg m -3)24.34 31.93 35.45 38.64 42.69 41.78α (-)0.353 0.463 0.514 0.560 0.619 0.605 P p (-)0.376 0.315 0.271 0.257 0.227 0.226 w/c =0.5W n (kg m -3)24.60 30.89 36.68 44.74 46.26 51.97 α (-)0.356 0.448 0.532 0.648 0.670 0.753 P p (-)0.439 0.399 0.355 0.327 0.299 0.287 w/c =0.6W n (kg m -3)24.08 30.18 38.49 45.65 48.79 53.27 α (-)0.349 0.437 0.558 0.662 0.707 0.772 P p (-)0.496 0.475 0.421 0.394 0.382 0.340 w/c =0.7W n (kg m -3)23.82 30.96 38.04 48.18 51.06 56.45 α (-)0.345 0.449 0.551 0.698 0.740 0.818 P p (-)0.548 0.522 0.494 0.455 0.425 0.395Table 6 Measured properties of mortar.Specimen w/c Wn (kg m -3)α (-)P cap (-)Sand/cement M1-10.436.018 0.522 0.213 10.444.505 0.645 0.177 1M1-1.50.435.466 0.514 0.188 1.50.443.470 0.630 0.166 1.5M1-20.425.530 0.370 0.217 20.435.445 0.514 0.169 20.444.712 0.648 0.149 20.452.026 0.754 0.123 2M2-10.540.158 0.582 0.268 10.550.094 0.726 0.227 1M2-1.50.538.364 0.556 0.248 1.50.545.264 0.656 0.220 1.5M2-20.528.911 0.419 0.254 20.537.398 0.542 0.230 20.548.231 0.699 0.196 20.556.580 0.820 0.176 2M2-30.5529.514 0.428 0.276 20.5540.779 0.591 0.255 20.5550.057 0.725 0.214 20.5559.340 0.860 0.195 2M2-40.634.500 0.500 0.280 20.643.539 0.631 0.263 20.656.580 0.820 0.223 20.663.480 0.920 0.208 2M2-50.6534.500 0.500 0.308 20.6544.850 0.650 0.288 20.6558.650 0.850 0.238 20.6564.860 0.940 0.225 2Fig. 9 Relation between total porosity and water/cement ratio.For various degree of hydration, Figs. 11 and 12 show therelation between porosity and water cement ratio by the proposed model. The porosity of gel increases with the increase of the degree of hydration and decreases with water/cement ratio, but reverse tendency occurs to the critical water/cement ratio at full hydration because water is insufficient for full hydration.5.2 Model for mortarFig. 13 shows the experimental results and comparisonsbetween measured and predicted data by Eq. (19). It is thoughtthat predicted values are very close to the measured ones like thecement paste, the capillary porosity of mortar decreases withincreasing hydration. As shown in Fig. 13, high water/cementratio increases the pore volume of mortar.Mortar and concrete can not properly be described as thecomposites of coarse and fine aggregates in a matrix of cementpaste otherwise identical with the aggregate-free material. Themicrostructure of the paste close to the aggregate differs from thatof cement paste in bulk, and much of the paste in concrete ormortar places or lies in this category.Interface transition zone (ITZ) between aggregate and cementpaste has more pore space than bulk cement paste because thesurfaces of aggregates were closely covered with poorly crystallinematerial as CH(Ca(OH2). In this zone, it is up to about 30µmwide; the paste is of increased porosity and presumably low instrength.The porosity of cement paste in mortar and concrete differsfrom the aggregate-free cement paste. Therefore, property ofinterface transition zone on porosity must be considered for moreaccuracy. Figs. 14 and 15 show the relation between sand contentand capillary porosity. The capillary porosity of mortar with Fig. 10 Comparison of the calculated and measured capillaryporosities.Fig. 11 Relation between capillary porosity and water/cement ratio.Fig. 12 Relation between gel porosity and water/c ement ratio.Fig. 13 Relation between water/cement ratio and capillary porosity.Fig. 14 Relation between G/C ratios and capillary porosity (w/c = 0.4).88│International Jou rnal of Concrete Stru ctu res and Materials (Vol.3 No.2, December 2009)。

![孔隙结构特征 [自动保存的]](https://uimg.taocdn.com/28dd432ef78a6529647d534e.webp)


混凝土孔结构与强度关系理论研究共3篇混凝土孔结构与强度关系理论研究1混凝土孔结构与强度关系理论研究混凝土作为建筑材料,其力学性能受多种因素影响。
其中混凝土中的孔结构对其力学性能有很大影响。
本文将从孔结构对混凝土强度的影响、孔结构设计对混凝土强度提升的措施等方面进行理论研究。
1.孔结构对混凝土强度的影响混凝土中的孔结构对其强度的影响是非常重要的,其中主要包括以下三个方面:(1)孔径大小对混凝土强度的影响混凝土中的孔隙大小是混凝土强度的一个重要因素。
孔径越小,混凝土的强度越高,因为孔结构的存在会影响混凝土内的应力分布,导致混凝土强度降低。
(2)孔洞形状对混凝土强度的影响混凝土中的孔洞形状也会影响其强度。
例如,球形孔洞的强度比其他形状的孔洞强度高,这是因为球形孔洞的应力集中程度要比其他形状的孔洞低。
(3)孔隙度对混凝土强度的影响混凝土中的孔隙度也是影响强度的因素之一。
孔隙度越大,混凝土的强度越低,因为孔隙度大,混凝土内的应力分布不均匀,导致混凝土强度的下降。
2.孔结构设计对混凝土强度提升的措施为了提高混凝土的强度,需要采取一些措施来优化混凝土的孔结构设计,其中有以下几点:(1)混凝土中采用小孔径的橡胶颗粒通过将橡胶颗粒掺入混凝土中,可以减小混凝土中的孔径,提高混凝土的密实性和强度。
(2)优化混凝土的配合比通过调整混凝土的配合比,可以控制混凝土中孔隙度的大小,从而提高混凝土的密实性和强度。
(3)采用纤维增强混凝土技术在混凝土中加入合适的纤维可以增加混凝土的强度和抗裂性。
综上所述,混凝土孔结构对其强度的影响是很大的,优化混凝土的孔结构设计有利于提高混凝土的强度和密实性。
通过采取一些措施来优化混凝土的孔结构设计,可以提高混凝土的力学性能,延长混凝土的使用寿命。
混凝土孔结构与强度关系理论研究2混凝土结构中的孔洞是由于其内部的气泡或者空隙引起的,而这些空隙会对混凝土结构的力学性能产生影响。
因此,混凝土孔结构与其强度之间具有紧密的联系,对其进行深入的理论研究对于工程实践具有重要意义。
材料的孔结构和比表面积概述说明以及解释1.引言1.1 概述材料的孔结构与比表面积是材料科学领域中一个重要的研究方向。
孔结构和比表面积是描述材料内部孔隙特征以及单位质量或单位体积的表面积大小的参数。
这些参数不仅决定了材料在各种物理、化学和生物过程中的性能,还直接影响着材料在催化剂、吸附剂、分离膜等领域中的应用。
1.2 文章结构本文将按照以下结构进行论述:首先介绍材料孔结构的定义和分类,包括常见的各类孔隙形态和尺寸;其次解释比表面积的概念并探讨其重要性;然后讨论影响材料孔结构和比表面积的因素,包括原始材料特性以及制备方法等;接下来介绍常用的孔结构和比表面积测试方法,并提及一些先进技术在该领域中的应用;之后通过分析催化剂领域以及吸附材料在环境治理中的应用案例,展示了孔结构与比表面积对于材料性能和功能发挥的关键作用;最后对孔结构与比表面积的未来研究方向和发展趋势进行了展望。
1.3 目的本文旨在系统概述和解释材料的孔结构和比表面积的相关内容,帮助读者全面了解这个领域的基本概念、重要性以及表征方法与应用。
同时,通过案例分析和展望,让读者认识到孔结构与比表面积在催化、环境治理等领域中具有广泛而深远的应用前景。
希望本文能够为相关研究人员提供参考,并促进该领域更深入的探索和发展。
2. 材料的孔结构与比表面积2.1 孔结构的定义与分类材料的孔结构指的是材料内部存在的微小空隙或孔洞。
这些孔洞可以是微观范围内的细小通道,也可以是宏观上可见的大型空腔。
根据孔洞尺寸和形状的不同,孔结构可以被分为以下几类:1) 微孔:直径小于2纳米(nm)的孔洞,其表面积相对较大。
微孔通常由吸附作用引起,因此在催化剂和吸附材料中扮演重要角色。
2) 中孔:直径介于2纳米到50纳米之间,具有较高比表面积和一定渗透性。
中孔可以提供更大的反应活性表面,并且更容易在其中承载催化剂。
3) 大孔:直径大于50纳米,具有高度渗透性和较低比表面积。
大型孔洞对于流体传输和负载相对较大颗粒物质非常重要。
孔结构的分类及特点
1. 咱来说说孔结构的分类呀,有一种叫微孔,就好像是特别小特别小的秘密通道。
你看像活性炭里就有很多微孔,这能让它具有超强的吸附能力呢,能把一些微小的杂质都给吸进去,厉害吧!
2. 还有介孔呢,这就像是一条中间大小的通道啦。
好比在一些催化剂里,介孔能提供合适的空间让反应更顺畅地进行,这不是很奇妙吗?
3. 大孔呀,那就是宽敞的大道啦!像在一些过滤材料中,大孔让流体可以很轻松地通过,畅通无阻哟!你想想看,如果没有大孔,那得堵成啥样呀!
4. 封闭孔呢,就像是一条走到头的死胡同。
它虽然不怎么起作用,但也是孔结构里的一种呀,你说是不是很有意思?
5. 通孔就像直直的马路一样,贯通到底。
在很多材料里,通孔能让物质快速地传输通过,可重要了呐!
6. 再来看看网络孔,这就好像是好多道路交织在一起形成的网络。
在一些复杂的结构体中,网络孔可是发挥着关键作用呢,难道你不想深入了解一下吗?
我觉得孔结构的分类真的超级有趣,每种都有自己独特的特点和用处,它们共同构成了丰富多彩的材料世界!。
形容孔结构(原创版)目录1.孔结构的基本概念2.孔结构的分类3.孔结构的应用领域4.孔结构的发展前景正文1.孔结构的基本概念孔结构,是指物质中存在的各种形状、大小、排列方式的孔道或空隙。
这些孔道或空隙可以是天然形成的,也可以是人工制备的。
孔结构在众多领域中都有广泛的应用,如催化、吸附、过滤、传感等。
2.孔结构的分类根据孔道的形状、大小和排列方式,孔结构可以分为以下几类:(1)毛细孔:由微小的孔道组成,其直径一般在 1 纳米至 1000 纳米之间。
毛细孔通常具有良好的吸附性能,可用于气体吸附、液体过滤等。
(2)微孔:微孔的孔径范围较大,一般在 2 纳米至 50 纳米之间。
微孔结构具有较高的表面积,可提高催化效果和物质传输速率。
(3)介孔:介孔的孔径介于微孔和宏孔之间,一般在 50 纳米至 1000 纳米之间。
介孔结构具有良好的吸附和催化性能,可用于多种化学反应和环境治理。
(4)宏孔:宏孔的孔径较大,一般在 1000 纳米以上。
宏孔结构具有良好的透气性和过滤性能,可用于空气过滤、液体过滤等。
3.孔结构的应用领域孔结构在多个领域中具有广泛的应用,如:(1)催化:孔结构可提高催化剂的表面积,提高催化效果。
如汽车尾气净化催化剂、石油化工催化剂等。
(2)吸附:孔结构具有良好的吸附性能,可用于气体吸附、液体吸附等。
如活性炭、分子筛等。
(3)过滤:孔结构可用于过滤杂质,提高产品质量。
如空气过滤、液体过滤等。
(4)传感:孔结构可用于制备高灵敏度的传感器,提高检测精度。
如气体传感器、湿度传感器等。
4.孔结构的发展前景随着科学技术的不断发展,孔结构在各个领域的应用将越来越广泛。
未来,孔结构的研究重点将集中在提高孔结构的性能、优化孔结构的制备工艺以及拓展孔结构在新领域的应用等方面。