英语二大作文模板(图表)
- 格式:docx
- 大小:84.03 KB
- 文档页数:3
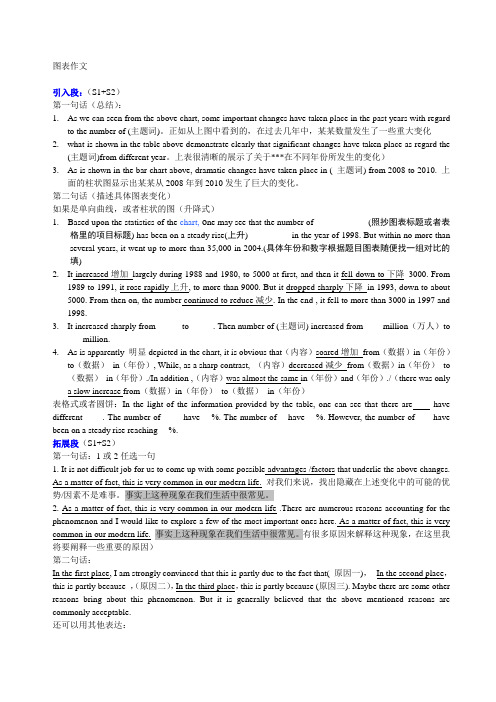
图表作文引入段:(S1+S2)第一句话(总结):1.As we can seen from the above chart, some important changes have taken place in the past years with regardto the number of (主题词)。
正如从上图中看到的,在过去几年中,某某数量发生了一些重大变化2.what is shown in the table above demonstrate clearly that significant changes have taken place as regard the(主题词)from different year。
上表很清晰的展示了关于***在不同年份所发生的变化)3.As is shown in the bar chart above, dramatic changes have taken place in ( 主题词) from 2008 to 2010. 上面的柱状图显示出某某从2008年到2010发生了巨大的变化。
第二句话(描述具体图表变化)如果是单向曲线,或者柱状的图(升降式)1. Based upon the statistics of the chart,o ne may see that the number of ____________(照抄图表标题或者表格里的项目标题) has been on a steady rise(上升)__________in the year of 1998. But within no more than several years, it went up to more than 35,000 in 2004.(具体年份和数字根据题目图表随便找一组对比的填)2.It increased增加largely during 1988 and 1980, to 5000 at first, and then it fell down to下降3000. From1989 to 1991, it rose rapidly上升, to more than 9000. But it dropped sharply下降in 1993, down to about 5000. From then on, the number continued to reduce减少. In the end , it fell to more than 3000 in 1997 and 1998.3.It increased sharply from _____ to _____. Then number of (主题词) increased from ____million(万人)to___ million.4.As is apparently 明显depicted in the chart, it is obvious that(内容)soared增加from(数据)in(年份)to(数据)in(年份), While, as a sharp contrast, (内容)decreased减少from(数据)in(年份)to (数据)in(年份)./In addition ,(内容)was almost the same in(年份)and(年份)./(there was onlya slow increase from(数据)in(年份)to(数据)in(年份)表格式或者圆饼:In the light of the information provided by the table, one can see that there are____ have different ____. The number of ____ have __%. The number of __have __%. However, the number of ___ have been on a steady rise reaching __%.拓展段(S1+S2)第一句话:1或2任选一句1. It is not difficult job for us to come up with some possible advantages /factors that underlie the above changes. As a matter of fact, this is very common in our modern life. 对我们来说,找出隐藏在上述变化中的可能的优势/因素不是难事。

英语二作文图表模板Possible essay:The chart below shows the results of a survey of 300 people on their preferences for different types of vacations.According to the chart, beach vacations are the most popular choice, with 40% of respondents selecting them as their top pick. This is followed by cultural trips (25%), nature adventures (20%), and city breaks (15%).Interestingly, there are some gender and age differences in the data. Women are more likely to prefer beach vacations (45%) than men (35%), while men are more likely to choose nature adventures (25%) than women (15%). Younger people (under 30) are more likely to opt for city breaks (20%) than older people (over 50) who prefer cultural trips (30%).The chart also reveals some regional variations. People from coastal areas are more likely to choose beach vacations (50%) than people from inland areas (30%), while people from mountainous areas are more likely to select nature adventures (30%) than people from flat areas (10%). People from urban areas are more likely to prefer cultural trips (30%) than people from rural areas (20%).Overall, the chart suggests that people have diverse preferences when it comes to vacations, which are influenced by factors such as gender, age, and region. While beach vacations may be the most popular choice, they are not the only option, and travelers should considertheir personal interests and needs when planning their trips.。

审题三事项:英文指令、数字信息、文字说明1.图表数据本质透析图表归类:折线图——curve/line graph本质变化:趋势柱状图——bar chart/column chart饼图——pie chart表格——table本质排序:对比组合图对比+趋势透析:固定时间段内,相同事物写变化;固定时间点,不同事物写对比或排序2.变化类词汇与句式1.数量单位Dozen/hundred/thousand/million/billion/trillion300——three hundred——hundreds of2.时间点/段In 1990/from 1990 to 1992/since 1990(has been)/after 1992/between 1990 and 1998/during the period from...to.../ten years=a decade3.上升:动词increase,rise(rose),climb,jump,go up,grow,ascend快速上升:surge,shoot(shot)up,boom,soar,leap上升:名词an increase to/by...,a rise,a growth,a jump,a surge,a boom,an upward trend inFrom 1977 to 1980,there was an upward trend in the number of birds.from120 million to the highest point/peak at approximately/about/some 127million.4.下降V.decrease,decline,descend,go down,fall,be reduced,drop,sink(sank),dip,shrink,diminish逐渐变小:dwindle剧烈下降:slump,plungen.a decrease,a decline,a fall,a drop,a slump in,a reduction in,a downward trend in变化程度:原则:形容词修饰名词副词修饰动词、形容词、副词、句子表快速剧烈/明显:sharp/sharply,rapidly,dramatically,drastic/drastically,considerably,remarkably,extremely,strikingly,substantially,enormously,exponentially,significantly,greatly,steeply。

英语二大作文模板图表The bar chart shows the percentage of people in different age groups who prefer to shop online. As we can see, the younger age groups tend to have a higher preference for online shopping, with 80% of people aged 18-24 and 75% of people aged 25-34 preferring to shop online. On the other hand, only 40% of people aged 55-64 and 30% of people aged 65 and above prefer online shopping.The line graph illustrates the changes in the average global temperature from 1900 to 2000. It is evident that there has been a steady increase in the average global temperature over the past century, with a significant rise in the latter half of the 20th century. The year 1998 marked the highest average global temperature during this period.The pie chart displays the distribution of household expenditure in a typical family. It is clear that the largest portion of the expenditure goes towards housing andutilities, accounting for 35% of the total expenditure. This is followed by transportation, which makes up 25% of the expenditure. Other significant expenses include food and beverage (15%), healthcare (10%), and entertainment (10%).The table presents the statistics of the top 10 countries with the highest GDP in the world. The United States ranks first with a GDP of $21.43 trillion, followed by China with a GDP of $14.34 trillion. Japan, Germany, and India complete the top 5 with GDPs of $5.08 trillion, $4.42 trillion, and $3.18 trillion respectively. The remaining countries in the top 10 are the United Kingdom, France, Brazil, and Italy.。
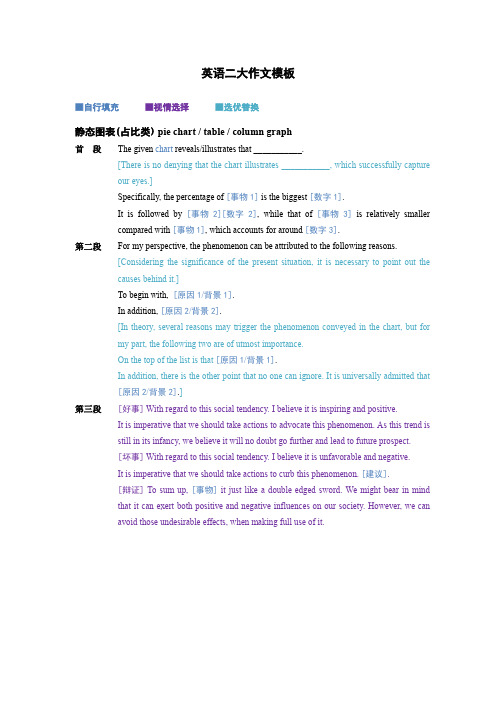
英语二大作文模板■自行填充■视情选择■选优替换静态图表(占比类) pie chart / table / column graph首段The given chart reveals/illustrates that ___________.[There is no denying that the chart illustrates ___________, which successfully captureour eyes.]Specifically, the percentage of [事物1] is the biggest [数字1].It is followed by [事物2][数字2], while that of [事物3]is relatively smallercompared with [事物1], which accounts for around [数字3].第二段For my perspective, the phenomenon can be attributed to the following reasons.[Considering the significance of the present situation, it is necessary to point out thecauses behind it.]To begin with, [原因1/背景1].In addition, [原因2/背景2].[In theory, several reasons may trigger the phenomenon conveyed in the chart, but formy part, the following two are of utmost importance.On the top of the list is that [原因1/背景1].In addition, there is the other point that no one can ignore. It is universally admitted that[原因2/背景2].]第三段[好事] With regard to this social tendency. I believe it is inspiring and positive.It is imperative that we should take actions to advocate this phenomenon. As this trend isstill in its infancy, we believe it will no doubt go further and lead to future prospect.[坏事]With regard to this social tendency. I believe it is unfavorable and negative.It is imperative that we should take actions to curb this phenomenon. [建议].[辩证] To sum up, [事物] it just like a double-edged sword. We might bear in mindthat it can exert both positive and negative influences on our society. However, we canavoid those undesirable effects, when making full use of it.动态图表(趋势类) column graph / line chart首段This is a chart which describes the general trend of ___________.To be specific, the past ____ years has witnessed [趋势1] in [事物1].Meanwhile/On the contrary, [事物2] has/have experienced [趋势2]from...to/duringthe same period/in the first ____ years, and then [趋势3] in the following ____ years.[What is clearly represented by the vivid but thought-provoking chart is that [事物]have had great fluctuations during [时间]. On the basis of the above chart,it can beeasily found that [事物] has been on the [趋势], significantly [趋势] from … to …over … . Obviously,the inclinations,clearly reflected by the chart,should be given moreconsideration.]第二段There are two fundamental factors contributing to this phenomenon.The primary factors lies in [原因1/背景1].Secondly, [原因2/背景2].[In theory, several reasons may trigger the phenomenon conveyed in the chart, but formy part, the following two are of utmost importance.On the top of the list is that [原因1/背景1].In addition, there is the other point that no one can ignore. It is universally admitted that[原因2/背景2].]第三段[好事] With regard to this social tendency. I believe it is inspiring and positive.It is imperative that we should take actions to advocate this phenomenon. As this trend isstill in its infancy, we believe it will no doubt go further and lead to future prospect.[坏事]With regard to this social tendency. I believe it is unfavorable and negative.It is imperative that we should take actions to curb this phenomenon. [建议].[辩证] To sum up, [事物] it just like a double-edged sword. We might bear in mindthat it can exert both positive and negative influences on our society. However, we canavoid those undesirable effects, when making full use of it.[趋势] 平稳stay stable / remain steady上升increase / ascended / aggrandize下降decrease / descend / decline波动fluctuate顶峰peak / reach its summit / reach its zenith[程度] 小幅gradually / smoothly / steadily / slightly大幅dramatically / sharply/ considerably / appreciably / greatly。

考研英语二作文模板一、图表作文模板。
Recently, there has been a growing concern over the issue of _______________ (话题). According to the chart/ graph/ table, _______________ (图表内容简述). From the data presented, we can see that _______________ (数据分析).This phenomenon can be attributed to a number of factors. Firstly,_______________ (原因一). In addition, _______________ (原因二). Last but not least, _______________ (原因三).In my opinion, it is high time that we took some effective measures to tackle this problem. For one thing, _______________ (建议一). For another, _______________ (建议二). Only in this way can we _______________ (解决问题的期望结果).In conclusion, _______________ (总结观点). Therefore, we should_______________ (呼吁行动).二、观点对比作文模板。
Nowadays, there is a heated debate on the topic of _______________ (话题). Some people believe that _______________ (观点一). On the other hand, others argue that_______________ (观点二).Those who support the former opinion maintain that _______________ (理由一). Moreover, they claim that _______________ (理由二). However, those who side with the latter opinion hold that _______________ (理由一). What's more, they point out that _______________ (理由二).As far as I am concerned, I am in favor of the latter opinion. This is because_______________ (支持观点二的原因一). Furthermore, _______________ (支持观点二的原因二).In conclusion, _______________ (总结观点). Therefore, we should_______________ (呼吁行动).三、议论文模板。
第一节图表作文万能模板万能作文全文模板一(积极类)There is no denying the fact that the bar/pine chart/curve graph reveals a common and thought-provoking phenomenon that 主题句. It is clearly observed that between 参照时间点一and 参照时间点二,比较对象主题词一witnessed a mild/rapid/sharp/dramatic increase or surge. On the contrary, 比较对象主题名词二saw a moderate/significant /steep/stable decrease. To our surprise, 比较对象主题名词三stayed the same or remained stable/leveled off or the biggest surge happened 在哪个时间段。
This phenomenon may be rooted in several factors but three of them are the major contributors. To begin with, 原因一. In addition, 原因二. Finally/Ultimately/Above all, 原因三.The above overall analysis reminds us that some effective initiatives must be done to maintain the current progressive situation. Most importantly, the relevant agencies of our Chinese Administration are supposed to motivate the public to join together in promoting as well as advancing this tendency. Only by joint efforts from people of diverse social layers can the good trend be likely to move forward healthily and smoothly.万能作文全文模板二(不好发展趋势)The bar chart above evidently shows the tendency of 主题名词from 时间to 时间. From the graph, we can see that the number of 主题dropped or increased at a startling speed in 哪些years. In 哪个具体年份,the number of 主题名词was 升降. On the contrary, in the following 具体years, it dramatically climbed to 具体数字, which was 几倍times as many as in 具体时间.There are several reasons which account for this phenomenon. To begin with, 原因一. What’s more, such a tendency is also due to 原因二. Finally, 原因三is also a reason. Accordingly, such a trend is not surprising to us.From the chart, we may safely draw a conclusion that 结论句. In my personal sense, because of 原因, this tendency will continue in the following years. However, if we let this situation go unchanged, this tendency can bring a high price for us. Numerous cases can illustrate this, but one will suffice. Accordingly, we should adopt measures to ensure that this problem doesn’t go out of hand and change this issue to be progressive.万能作文全文模板三(危害类)As is shown in the table, there have been great changes in 主题词between 时间and 时间. One noticeable change is that formerly 句子,however, at present this is not the case. In contrast, 一事物has increased rapidly. And the same goes for 另一事物.There are several reasons which account for this phenomenon. To begin with, 原因一. What’s more, such a tendency is also due to 原因名词短语.This tendency is expected to be reversed soon. Such a phenomenon should give us and our government a warning. In order to decrease 现象, as we have witnessed it, we should undertaken the sense of responsibility to take wise actions. Our Administration should implement effective measures to curb this harmful outcome. In the final analysis, only through our concerted efforts can we have a brilliant, promising and harmonious prospect.第二节历年真题套用万能作文模板示例2012年作文试题与解析-Directions: Write an essay on the following table. In your writing you should1) describe the table, and2) give your comments.You should write at least 150 words. Write your essay on Answer Sheet 2. (15 points)某公司员工工作满意度调查【精品范文】As we can see in this table above, there exist extremely differences in job contentment among their staff members in various age periods. The number of people above 50 who are satisfied with their jobs ranks first which is 40%, followed by people below 40 and those between 41 to 50, with 16.7% and 0% respectively. Meanwhile, 64% people between 41 to 50 are discontent with their jobs, followed by people below 40, which reaches 33.3%.The primary reasons for this trend can be listed as follows. To begin with, people between 41 to 50 suffer from enormous pressure because they have children to raise and aged parents to support. Their stress exceeds remarkably those who are above 50 and below 40. In addition, individuals above 50 have abundant life experience, which makes them quite composed and optimistic when confronting similar pressure.To sum up, the senior citizens enjoy more contentment than the young and middle-aged people under 50. Effective measures should be taken to release pressure of those who are between 41 to 50.2011年作文试题与解析Directions: Write an essay based on the following chart. In your writing, you should1) interpret the chart, and2} give your comments.You should write at least 150 words. Write your essay on ANSWER SHEET 2. (15 points)【精品范文】第一段(总体描述)As we can see in the above bar chart, dramatic changes have taken place in the market share of certain brands in domestic car markets from 2008 to 2009. (细节描述)During the period, there was a drastic jump of 8% from 25% to 33% in the market portion of Chinese brands, while that of Japanese brands declined significantly by 10% from 35% to 25%. At the same time, the percentage of American brands remained steady.属于分析原因模板There are at least two fundamental reasons accounting for these changes. On the one hand, cutting-edge technology has offered a technical foundation for the rapid development of Chinese automobile industry by providing material basis and technical means. Meanwhile, no one could fail to notice that national automobile companies in growing numbers resort to price promotions to boost sales. On the other hand, the incredible words and behaviors of Japanese automobile corporations such as Toyota in recent years also contribute to this tendency because it cheapens their image and finally ruin their reputation.第三段:主要是做一个总结展望或者建议Taking the above mentioned into consideration, it is far from being difficult to realize the significance of quality, price and reputation of a corporation. Without the trust and favor of consumers, enterprises are bound to be affected adversely. Therefore, I reckon that if Chinese automobile industry wants to enjoy a sustainable development, what they need is to spare no effort to reinforce their brands’ image.祝愿英语二考生一考而过,马到成功!黄涛。
The [table \ pie \bar \line chart] above clearly reflects the statistics of [job happiness index of the staff in a certain company] {the market share [of mobile-phone in the developed countries \taken by Japanese car brands]} [several reasons for]:__.as is shown, it is universally acknowledged that [sb have little respect for sth \], [sth still failed to arouse concerns of sb] \{ [sth is becoming more and more vital \sth play a key role] in daily life, commercial activity, network industry, the advertising field ] } \[sth becomes larger year by year] \ {people vary in their purposes \ [reasons for blogging] with age} [the estimated world illiteracy rates differ a lot by gender \region \age \period in the past two \ few years.]The figures of [] has been a [slight \ steady\ dramatic] [rise \ fluctuation \ fall] in the past N years, and the increase of percentage gets greater and greater, obviously. Specifically speaking,所占比率The largest part of [] that accounts for 50%. B be second to A, which makes up 35%. C in third spot, is 7%. It is followed by _ _ _with 9%、4%、and 3%respectively.对应比例During the same period, [] be in proportion to [], and went up rapidly from [] to [][people ranging from 41 to 50 are least pleased with their current situation], accounting for approximately64 percent, comprising the maximum\minimum part in the whole proportion, people over 50 are most pleased with it, at about 40%, meanwhile, the proportions of the personnel feeling hard to say are the same between those who are under 40 and over 50, making up 50%.Female students are more likely to get depressed than male ones, which is twice as much as that of male.Students aged from 25to 29 years having mental diseases are 1.8%apparently higher\ lower than those who are below 25 years old, in addition, they almost have the same possibility to get depressed.占据首末The number of [] that resulted from [ ] [increased \ decreased] sharply 10 percents to 608, which is highlighted on the first row of the table.The lowest rates are in developed countries, with about 1%for males and 2%for females \With a 15 percent rise \ fall.比率变动Among 5.8 billion people round the world, there are 1.1 billion smokers, only accounted for 8%in 2008, while in 2011 it increased significantly to 13%.增减迅猛[] related with [] enjoyed the greatest [soar \ drop], as compared to [_in_] \ as against that of [last year\2004], the figure \ percentage has nearly [one point one times \ one and a half times \ doubled \ tripled \%\20 per thousand.[] decreased dramatically by 10%from 25%in 2008 to 35%in 2009.保持不变As a sharp contrast, that there was only a slow increase in [] during the same period, from_to_.In addition, the rates was almost the same in 2008 and 2009 \there was a small [ rise \ fall] by 5%.波峰波谷Sth fluctuated in the past few years, in 1995, it reached the peak. However, three years later, it dropped to its nadir, reducing \ increasing to__in 1998.第二段By analyzing these data displayed in the table, It is no difficult job for us to come up with the following two reasons for the variation.1. For one thing, the financial \mental or learning pressure from work and family might lead to the decrease of job happiness index foremployees especially \except under the age of50. For another thing, the reason why those who are over 50 have the highest job happiness index is that they have more \less experience \lower capacity to deal with pressure.]2. For one thing, the general improvement of ordinary people’s living standard in the developing countries has made it possible for people to have mobile-phones. For another thing, the market share in the developed country has nearly occupied the whole.3. For one thing, the increasingly fast pace of people’s life today brings dramatic change to the traditional Chinese diet. For another thing, since people spend most of their time engaging in daily office work instead of physical exercise, their physical conditions get worse.The relatively higher rates of females result from complicated factors, such as social, political, economic and conventional factors of the region.The grandmother would like to pay more attention to ihtt than her grandson in the aspect of food.第三段As has been mentioned above, I hold it self-evident that {certain [disturbing \ exciting] changes have taken place in the field, this tendency, in my personal sense, will be going on in a [depressive \ positive] direction.} \ [it is difficult for everyone to be content with their jobs.] \[will become more and more prominent][] by its outstanding advantages, such as stronger interactivity, no limitation of time and place, well-targeted, higher economic character, and more objective, compared with the traditional ones, all of the good sides cause the continuous growth of [its marker scale]. Conversely Speaking, the [merchants \company] should spare no pains to ensure its [reliability \ comfort level \right to education \opportunity to learn], which is the basis of a sound [internet \working] environment.By that time, people will suffer from their own shortsighted behavior. Thus it is essential that countermeasures should be taken immediately so as to halt and reverse the grim situation. First and foremost, [Local] governments at all levels are expected to [tighten relevant laws and regulations of food to severely punish those who [violate traffic rules openly, be they _or_] \[build more facilities \ gymnasiums for citizens to exercise \relax]. Additionally,a widespread education campaign should be launched to inform citizens that [the proper attitude of living\rules are fundamental for them \]. Third and last, [they should try to seek help from the professional in or out of school]\[international organizations must work together to develop a series of plans to protect ocean resources]. It is in those effective approaches that we may obtain some improvements as expectancy.重点词汇:positions complicated political depressive tendency prominent interactivity merchants reliability immediately regulations facilities gymnasium campaign fundamental professional international organizations resources expectancy violate。
英语二图表作文模板As we all know, English is a very important subject in our study. In the English exam, we often encounter the task of writing an essay based on a given chart or graph. Therefore, it is necessary for us to master the skills of writing an English composition based on a chart. Here, I will provide you with a template for writing an English composition based on a chart.Firstly, when we are given a chart or graph in the exam, we should carefully analyze the information presented. For example, if the chart shows the changes in the number of people using bicycles in a city over a period of time, we should pay attention to the time frame, the peak and low points, and any significant fluctuations. By doing so, we can have a clear understanding of the data and be well-prepared for writing the composition.Secondly, in the introduction of the composition, we need to briefly describe the chart or graph. We can start by stating the type of chart, such as a bar chart, line graph, or pie chart, and then provide an overview of the main trends or features shown in the chart. For instance, we can say "The bar chart illustrates the changes in the number of people using bicycles in City X from 2010 to 2020. It can be observed that..."Moving on to the body paragraphs, we should focus on the key points and trends revealed by the chart. We can use specific data from the chart to support our points and provide detailed explanations. For example, if the chart shows a significant increase in the number of people using bicycles in a certain year, we can explain the possible reasons behind this trend, such as the implementation of bike-sharing programs or the construction of more bike lanes. Additionally, we can compare and contrast different years or categories shown in the chart to demonstrate a comprehensive understanding of the data.In the conclusion, we should summarize the main points discussed in the body paragraphs and make some predictions or suggestions based on the trends shown in the chart. For instance, if the chart indicates a continuous decline in the number of peopleusing bicycles, we can propose some measures to encourage more people to use bicycles, such as promoting cycling as a green and healthy transportation option.In conclusion, writing an English composition based on a chart requires us to carefully analyze the data, provide a clear introduction, elaborate on the key points, and make a meaningful conclusion. By following this template, we can effectively organize our ideas and write a coherent and insightful composition. With practice and mastery of the skills, we can surely excel in this type of English writing task.。