2002 - NiCu metallization for low-cost high-efficiency PERC cells
- 格式:pdf
- 大小:169.08 KB
- 文档页数:6
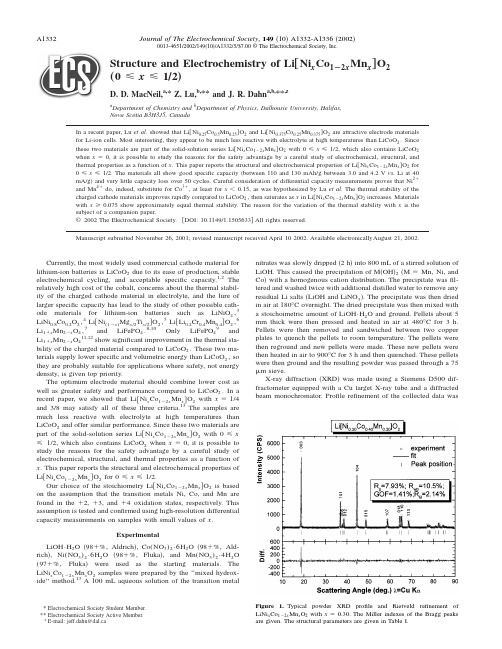
Structure and Electrochemistry of Li†Ni x Co1À2x Mn x‡O2…0рxр1Õ2…D.D.MacNeil,a,*Z.Lu,b,**and J.R.Dahn a,b,**,za Department of Chemistry andb Department of Physics,Dalhousie University,Halifax,Nova Scotia B3H3J5,CanadaIn a recent paper,Lu et al.showed that Li͓Ni0.25Co0.5Mn0.25͔O2and Li͓Ni0.375Co0.25Mn0.375͔O2are attractive electrode materials for Li-ion cells.Most interesting,they appear to be much less reactive with electrolyte at high temperatures than LiCoO2.Since these two materials are part of the solid-solution series Li͓Ni x Co1Ϫ2x Mn x͔O2with0рxр1/2,which also contains LiCoO2 when xϭ0,it is possible to study the reasons for the safety advantage by a careful study of electrochemical,structural,and thermal properties as a function of x.This paper reports the structural and electrochemical properties of Li͓Ni x Co1Ϫ2x Mn x͔O2for 0рxр1/2.The materials all show good specific capacity͑between110and130mAh/g between3.0and4.2V vs.Li at40 mA/g͒and very little capacity loss over50cycles.Careful consideration of differential capacity measurements proves that Ni2ϩand Mn4ϩdo,indeed,substitute for Co3ϩ,at least for xϽ0.15,as was hypothesized by Lu et al.The thermal stability of the charged cathode materials improves rapidly compared to LiCoO2,then saturates as x in Li͓Ni x Co1Ϫ2x Mn x͔O2increases.Materials with xу0.075show approximately equal thermal stability.The reason for the variation of the thermal stability with x is the subject of a companion paper.©2002The Electrochemical Society.͓DOI:10.1149/1.1505633͔All rights reserved.Manuscript submitted November26,2001;revised manuscript received April102002.Available electronicallyAugust21,2002.Currently,the most widely used commercial cathode material forlithium-ion batteries is LiCoO2due to its ease of production,stable electrochemical cycling,and acceptable specific capacity.1,2The relatively high cost of the cobalt,concerns about the thermal stabil-ity of the charged cathode material in electrolyte,and the lure of larger specific capacity has lead to the study of other possible cath-ode materials for lithium-ion batteries such as LiNiO2,3LiNi0.8Co0.2O2,4Li͓Ni(1Ϫx)Mg x/2Ti x/2͔O2,5Li͓Li0.2Cr0.4Mn0.4͔O2,6 Li1ϩx Mn2Ϫx O4,7and LiFePO4.8-10Only LiFePO49andLi1ϩx Mn2Ϫx O411,12show significant improvement in the thermal sta-bility of the charged material compared to LiCoO2.These two ma-terials supply lower specific and volumetric energy than LiCoO2,so they are probably suitable for applications where safety,not energy density,is given top priority.The optimum electrode material should combine lower cost aswell as greater safety and performance compared to LiCoO2.In arecent paper,we showed that Li͓Ni x Co1Ϫ2x Mn x͔O2with xϭ1/4 and3/8may satisfy all of these three criteria.13The samples are much less reactive with electrolyte at high temperatures than LiCoO2and offer similar performance.Since these two materials are part of the solid-solution series Li͓Ni x Co1Ϫ2x Mn x͔O2with0рx р1/2,which also contains LiCoO2when xϭ0,it is possible to study the reasons for the safety advantage by a careful study of electrochemical,structural,and thermal properties as a function of x.This paper reports the structural and electrochemical properties of Li͓Ni x Co1Ϫ2x Mn x͔O2for0рxр1/2.Our choice of the stoichiometry Li͓Ni x Co1Ϫ2x Mn x͔O2is based on the assumption that the transition metals Ni,Co,and Mn are found in theϩ2,ϩ3,andϩ4oxidation states,respectively.This assumption is tested and confirmed using high-resolution differential capacity measurements on samples with small values of x.ExperimentalLiOH•H2O͑98ϩ%,Aldrich͒,Co(NO3)2•6H2O͑98ϩ%,Ald-rich͒,Ni(NO3)2•6H2O͑98ϩ%,Fluka͒,and Mn(NO3)2•4H2O (97ϩ%,Fluka͒were used as the starting materials.The LiNi x Co1Ϫ2x Mn x O2samples were prepared by the‘‘mixed hydrox-ide’’method.13A100mL aqueous solution of the transition metal nitrates was slowly dripped͑2h͒into800mL of a stirred solution of LiOH.This caused the precipitation of M͑OH͒2͑MϭMn,Ni,and Co͒with a homogenous cation distribution.The precipitate wasfil-tered and washed twice with additional distilled water to remove any residual Li salts͑LiOH and LiNO3͒.The precipitate was then dried in air at180°C overnight.The dried precipitate was then mixed with a stoichoimetric amount of LiOH•H2O and ground.Pellets about5 mm thick were then pressed and heated in air at480°C for3h. Pellets were then removed and sandwiched between two copper plates to quench the pellets to room temperature.The pellets were then reground and new pellets were made.These new pellets were then heated in air to900°C for3h and then quenched.These pellets were then ground and the resulting powder was passed through a75m sieve.X-ray diffraction͑XRD͒was made using a Siemens D500dif-fractometer equipped with a Cu target X-ray tube and a diffracted beam monochromator.Profile refinement of the collected data was*Electrochemical Society Student Member. **Electrochemical Society Active Member. z E-mail:jeff.dahn@dal.caFigure 1.Typical powder XRD profile and Rietveld refinement ofLiNi x Co1Ϫ2x Mn x O2with xϭ0.30.The Miller indexes of the Bragg peaksare given.The structural parameters are given in Table I.0013-4651/2002/149͑10͒/A1332/5/$7.00©The Electrochemical Society,Inc.made using Hill and Howard’s version of the Rietveld Program,Rietica.14The electrodes were prepared by combining 7mass %,each of Super S Carbon Black ͑MMM Carbon,Belgium ͒and polyvi-nylidene difluoride ͓PVDF,10%in N -methylpyrrolidinone ͑NMP ͒,NRC ͔with the electrode powders.To the mixture an extra portion of NMP was added to form a slurry,which was then mixed for 10min.The slurry was then coated on a piece of thin aluminum foil ͑16m thick ͒.The electrode was then dried overnight in a 110°C oven.The next day 13mm diam disks were punched.The electrochemical cells were prepared in standard 2325coin-cell hardware with a single lithium metal foil used as both the counter and reference electrode.Cells were assembled in an argon-filled glove box,following previously described procedures.12The electrolyte used for analysis was 1M LiPF 6in ethylene carbonate/diethyl carbonate ͑EC/DEC,33/67͒.The cells were then removed from the glove box and placed on the charging system ͑E-One/Moli Energy ͒.The cells were initially charged with a specific current of 5mA/g between 3and 4.4V vs.Li for four charge/discharge cycles.After the initial four cycles the current was increased to 30mAh/g and the cell was cycled between 3and 4.2V vs.Li for an additional 50cycles.After the cycling,the charged cell ͑4.2V ͒was removed and the differential scanning calo-rimeter ͑DSC ͒sample cells prepared in welded stainless steel tubes,as described previously.15Upon cell disassembly in the glove box,the sample was removed from the aluminum current collector and transferred to the sample tube.The tube was sealed with no addi-tional electrolyte or solvent added.The samples were analyzed in the DSC using a temperature scan rate of 5°C/min.Results and DiscussionFigure 1shows a typical XRD pattern of a sample from the LiNi x Co 1Ϫ2x Mn x O 2series with Miller indexes indicated.All peaks are indexed on the ␣-NaFeO 2structure ͑space group:R 3¯m ,no.166͒and Rietveld refinement was performed on the series using this structure.The Li atoms are on 3a sites,the Ni,Mn,and Co atoms are randomly placed on 3b sites,and oxygen atoms are on 6c sites.Since the radius of the Ni 2ϩcation (r Ni 2ϩϭ0.69Å)is close to that of Li ϩ(r Li ϩϭ0.76Å),a small amount of Ni may occupy the 3a Li sites.If this occurs,we assume the same amount of displaced Li atoms will occupy the 3b Ni site.16͑It is important to note that the refinement cannot distinguish which of Ni,Mn,or CoactuallyFigure 2.Change in lattice constants of LiNi x Co 1Ϫ2x Mn x O 2as Co contentchanges.Figure 3.Amount of Ni in the lithium layers of LiNi x Co 1Ϫ2x Mn x O 2as Co content varies.Table I.Rietveld fitting results for LiNi x Co 1À2x Mn x O 2.R wp is the weighted profile agreement factor,GOF is the goodness of fit,and R B is the Bragg intensity agreement factor as described in Ref.14.x a ͑Å͒c ͑Å͒c /a R wp GOF R B 02.8168Ϯ0.000114.0544Ϯ0.0006 4.989510.45 1.57 4.10.0125 2.8173Ϯ0.000114.0667Ϯ0.0006 4.99309.50 1.30 1.80.025 2.8183Ϯ0.000114.0727Ϯ0.0008 4.99339.30 1.20 1.40.05 2.8208Ϯ0.000114.0856Ϯ0.0008 4.99359.41 1.25 1.90.075 2.8242Ϯ0.000114.1043Ϯ0.0012 4.994111.21 1.18 2.70.15 2.8335Ϯ0.000114.1432Ϯ0.0011 4.991411.06 1.15 2.20.225 2.8457Ϯ0.000114.1860Ϯ0.0009 4.985111.28 1.17 2.30.3 2.8549Ϯ0.000114.2161Ϯ0.0006 4.979510.51 1.41 2.10.375 2.8627Ϯ0.000114.2387Ϯ0.0008 4.973910.70 1.60 2.50.45 2.8795Ϯ0.000114.2784Ϯ0.0010 4.95869.67 1.39 1.50.52.8879Ϯ0.000214.2963Ϯ0.00154.950410.761.671.7moves to the Li layer,although we believe Ni is most likely.͒Figure 1shows that the Rietveld fit to the pattern is excellent,suggesting that the structural model is correct.The best-fit structural parameters are shown in Table I for all samples in the LiNi x Co 1Ϫ2x Mn x O 2series.As the concentration of Ni increases,x in LiNi x Co 1Ϫ2x Mn x O 2,there is an increase in both the a axis and the c axis but a decrease in the c /a ratio.This is clearly demonstrated in Fig.2.The increase in unit cell size might be caused by the substitution of the larger Ni 2ϩ(r Ni 2ϩϭ0.69Å)ion for Co 3ϩ(r Co 3ϩϭ0.545Å).10The Mn 4ϩion (r mn 4ϩϭ0.53Å)is about the same size as the Co 3ϩion,so we believe the Ni ion is responsible for the changes observed.In addition,as dem-onstrated by Fig.3,more transition metal atoms ͑probably Ni ͒are found in Li sites ͑3a ͒when the Ni content (x )increases in LiNi x Co 1Ϫ2x Mn x O 2.Figures 4and 5show the voltage vs.specific capacity of Li/LiNi x Co 1Ϫ2x Mn x O 2cells between 3and 4.4V measured using a specific current of 5mA/g.The x ϭ0sample shows very little first-cycle irreversible capacity,while the remaining samples give first-cycle irreversible capacities between 15and 20mAh/g,except for the x ϭ0.5sample which was near 10mAh/g.These irrevers-ible capacity losses are less than 12%of the first charge capacity.All cells give reversible capacities above 150mAh/g over this potential range.Most interesting in Fig.4is the development of capacity below 3.8V as the Ni content increases.Figures 6and 7show the differential capacity vs.potential for Li/LiNi x Co 1Ϫ2x Mn x O 2cells.The large peak near 3.9V for LiCoO 2(x ϭ0)represents the transition between localized and delocalized electron states in the compound.Delmas et al.have shown that this transition is related to an insulator-metal transition as lithium is removed from the structure.17As the Ni and Mn contents increase ͑i.e.,as x increases ͒in LiNi x Co 1Ϫ2x Mn x O 2there is a decrease in theintensity of the peak,at least until x ϭ0.225.As x increases above 0.225,a new peak near 3.75V increases in intensity.It has been previously suggested that the oxidation states of Ni,Co,and Mn are ϩ2,ϩ3,and ϩ4,respectively,in the LiNi x Co 1Ϫ2x Mn x O 2series.Figure 8shows a schematic of the d-electron levels expected in this compound.18The e g and t 2g de-rived bands should split as indicated in the octahedral crystal field.Based on similarities with LiNiO 2,LiCoO 2,and layered LiMnO 2,we expect Mn to be high spin and Ni and Co to be low spin as shown.The d-levels fall relative to the vacuum level as one moves to the right in the periodic table as schematically indicated.19Based on Fig.8it is clear that the electron configuration Mn 4ϩ,Ni 2ϩis energetically preferred compared to Mn 3ϩ,Ni 3ϩ.The long dashed arrow in Fig.8shows the transfer of the Mn 3ϩe g electron to Ni,making Ni 2ϩ.Figure 7shows the development of low potential capacity as the Ni concentration increases.Figure 9shows the low potential region on an expanded scale.By comparison to the differential capacity of LiCoO 2one can identify the low potential capacity due to the Ni atoms.Figure 9indicates by the shaded regions that part of the differential capacity vs.potential that we believe is due to the oxi-dation of the few Ni 2ϩatoms in the materials with x ϭ0.0125,0.025,and 0.05.The shaded regions in Fig.9are for the second charge of Li/LiNi x Co 1Ϫ2x Mn x O 2and Li/LiCoO 2cells.The specific capacity of the shaded regions in Fig.9were measured ͑the shaded area ͒and were plotted against the Ni content in Fig.10.In addition,corresponding areas were measured for the first charge and the sec-ond discharge of the same cells and these are also plotted in Fig.10.If the Ni 2ϩions are being directly oxidized to Ni 4ϩions ͑removing both approximately equal energy e g electrons in Ni 2ϩas shown in Fig.8͒,then we expect a slope of 560mAh/͑g formula unit Ni ͒which is very close to the observed data in Fig.10.Figure 10also shows a line corresponding to one-electron oxidation and it is clear that this line does not describe the data well.Therefore webelieveFigure 4.V oltage vs.capacity of Li/LiNi x Co 1Ϫ2x Mn x O 2cells between 3and 4.4V for x ϭ0to0.15.Figure 5.V oltage vs.capacity of Li/LiNi x Co 1Ϫ2x Mn x O 2cells between 3and 4.4V for x ϭ0.225to0.50.Figure 6.Differential capacity vs.potential for Li/LiNi x Co 1Ϫ2x Mn x O 2cells with x between x ϭ0and0.15.Figure 7.Differential capacity vs.potential for Li/LiNi x Co 1Ϫ2x Mn x O 2cells with x between x ϭ0.225and 0.50.that at low values of x in LiNi x Co 1Ϫ2x Mn x O 2it is the Ni that is being oxidized at the lowest potentials.At higher values of x ,͑say x Ͼ0.1͒we believe the bands of Ni and Co begin to overlap sub-stantially and the Ni-derived capacity cannot be cleanly discerned.The capacity retention ͑capacity vs.cycle number ͒of Li/LiNi x Co 1Ϫ2x Mn x O 2cells between 3.0and 4.2V ͑᭹͒and between 3.0and 4.4V for a few cells ͑᭺͒is shown in Fig.11.The cells were cycled using a specific current of 30mA/g.There is good capacity retention for all samples with x Ͼ0and these show a capacity between 110and 130mAh/g to 4.2V .The capacity can be increased by some 20-30mAh/g by increasing the cutoff voltage to 4.4V .The capacity of the LiCoO 2sample cycled to 4.2V decreases rapidly with increasing cycle number for reasons that we do not understand.It is worth noting that samples of LiCoO 2made by us,using stan-dard solid-state reactions between Li 2Co 3and CoCO 3or Co 3O 4,show excellent cyclability.Thus,we suspect the poor performance of this LiCoO 2sample must be related to the details of its preparation.After the 50charge-discharge samples shown in Fig.11,the cells were charged to 4.2V for DSC testing.The cells were disassembled and DSC samples prepared from the wet electrodes as described in the Experimental section.Figure 12shows the results of the DSC experiments on the charged LiNi x Co 1Ϫ2x Mn x O 2electrodes.As the concentration of Ni and Mn in LiCoO 2increases,the thermal stabil-ity of the charged cathode material in electrolyte increases,even at the small Ni and Mn concentrations of 0.05.For Ni and Mncon-Figure 8.Schematic of d-electron levels in LiNi x Co 1Ϫ2x Mn x O 2.U Cr is the crystal field splitting energy and U ex is the exchangeenergy.Figure 9.Differential capacity vs.potential for Li/LiNi x Co 1Ϫ2x Mn x O 2cells with x ϭ0.0125,0.025,and 0.05͑͒and Li/LiCoO 2cells ͑͒.The shaded regions are the capacity due to the added nickelatoms.Figure 10.The low potential capacity due to Ni atoms ͑area of shaded regions in Fig.9͒plotted vs.x in LiNi x Co 1Ϫ2x Mn x O 2͑x ϭ0.0125,0.025,0.05,and 0.075͒.Figure 11.Capacity vs.cycle number for Li/LiNi x Co 1Ϫ2x Mn x O 2cells.͑᭹,͒cycling performed between 3and 4.2V ,͑᭺,ᮀ͒cycles performed be-tween 3and 4.4V .centrations above 0.05there is an almost 100°increase in the tem-perature of any significant exothermic activity.For Ni and Mn con-centrations of 0.05and above there is no large change in the reactivity of the sample,each having an almost negligible amount of reactivity below the large exothermic peak near 300°C.ConclusionA full series of LiNi x Co 1Ϫ2x Mn x O 2compounds were synthesized by the mixed hydroxide method.These materials were found to beisostructural with LiCoO 2and have Ni 2ϩand Mn 4ϩ1:1substitution for Co 3ϩ.The amount of Ni in the lithium layer increases as the concentration of Ni in LiNi x Co 1Ϫ2x Mn x O 2increases as determined from Rietveld refinement.These materials show a specific capacity between 110and 130mAh/g between 3.0and 4.2V .They show less than 12%irreversible capacity.These new cathodes with x Ͼ0.05show a dramatic increase in the thermal stability of charged elec-trodes in electrolytes.Dalhousie University assisted in meeting the publication costs of this article.References1.T.Nagaura and K.Tozawa,Prog.Batteries Sol.Cells,9,209͑1990͒.2.K.Mizushima,P.C.Jones,P.J.Wiseman,and J.B.Goodenough,Mater.Res.Bull.,15,783͑1980͒.3.W.Li,J.N.Reimers,and J.R.Dahn,Solid State Ionics,67,123͑1993͒.4.I.Saadoune and C.Delmas,J.Solid State Chem.,136,8͑1998͒.5.Y .Gao,M.V .Yakovleva,and W.B.Ebner,Electrochem.Solid-State Lett.,1,117͑1998͒.6.J.M.Paulsen,B.Ammundsen,H.Disilvesto,R.Steiner,and D.Hassell,Abstract 71,The Electrochemical Society Meeting Abstracts,V ol.2000-2,Phoenix,AZ,Oct 22-27,2000.7. E.Ferg,R.J.Gummow,A.Dekock,and M.M.Thackeray,J.Electrochem.Soc.,141,L147͑1994͒.8. A.K.Padhi,K.S.Nanjundaswamy,and J.B.Goodenough,J.Electrochem.Soc.,144,1188͑1997͒.9. A.Yamada,S.C.Chung,and K.Hinokuma,J.Electrochem.Soc.,148,A224͑1997͒.10.H.Huamg,S.C.Yin,and L.F.Nazar,Electrochem.Solid-State Lett.,4,A170͑2001͒.11.U.von Sacken,E.Nodwell,A.Sundher,and J.R.Dahn,J.Power Sources,54,240͑1995͒.12. D.D.MacNeil,Z.Lu,Z.Chen,and J.R.Dahn,J.Power Sources,108,8͑2002͒.13.Z.Lu,D.D.MacNeil,and J.R.Dahn,Electrochem.Solid-State Lett.,4,A200͑2001͒.14.Rietica vl.62,Windows version of Lucas Heights Powder Method;R.J.Hill andC.J.Howard,J.Appl.Crystallogr.,14,149͑1981͒.15. D.D.MacNeil and J.R.Dahn,Thermochim.Acta,386,153͑2002͒.16.R.D.Shannon,Acta Crystallogr.,Sect.A:Cryst.Phys.,Diffr.,Theor.Gen.Crys-tallogr.,32,751͑1976͒.17.M.Menetrier,I.Saadoune,S.Levasseur,and C.Delmas,J.Mater.Chem.,9,1135͑1999͒.18.Y .Gao,K.Myrtle,M.J.Zhang,J.N.Reimers,and J.R.Dahn,Phys.Rev.B,54,16670͑1996͒.19.W.A.Harrison,Electronic Structure and the Physics of the Chemical Bond ,Dover,New York ͑1989͒.Figure 12.DSC of the charged electrode samples in Fig.10after 50cycles at 4.2V .DSC was performed at 5°C/min.。
化学分析计量2016年,第25卷,第2期26进一步研究。
参考文献[1] 张庆庆,王燕燕,孟品佳.季铵盐类农药残留检测前处理研究[J].湖北大学学报:自然科学版,2014,35(2): 132–137.[2] 陈珊珊,邓晓,刘景坤,等.百草枯检测方法的研究进展[J].农药,2014,53(1): 4–6,30.[3] 杜宝顺,翟德胜,范文燕,等.百草枯半数致死量测定[J].新乡医学院学报,2006,23(2): 161–162.[4] 张婷,谭家镒,田艳,等.气相色谱法检测全血中百草枯[J].广东公安科技,2007,89(4): 21–22.[5] SN 0340–1995 出口粮谷、蔬菜中百草枯残留量检验方法紫外分光光度法[S].[6] 刘雪,卢蕾,马金凤,等.超高效液相色谱串联质谱法测定银杏叶中氨基甲酸酯类农药残留[J].化学分析计量,2012(3): 60–64.[7] 蒋宏,胡贝贞,宋伟华.微波辅助萃取–液相色谱–串联质谱法测定植物源产品中的阿维菌素B1a残留量[J].化学分析计量,2012,21(2): 45–48.[8] 李捷,杨方,卢声宇,等.超高效液相色谱–电喷雾串联质谱法测定茶叶中敌草快和百草枯残留[J].分析试验室,2014(5): 537–541.[9] 郑和辉,卞战强,田向红,等.液相色谱串联质谱法直接进样测定饮用水中的百草枯[J].中国卫生检验杂志,2014,24(18):2 602–2 603,2 608.[10] Angela Schaner,Heidi Hickes1. Quantitative analysis of paraquat in vegetation by stable isotope dilution and liquid chromatography/electrospray ionization-mass spectrometry [J]. Journal ofAOAC International,2015,98(2): 512–516.[11] Tingting Zou,Pingli He,Jingjing Cao,et al. Determination of paraquat in vegetables using HPLC–MS–MS[J]. Journal ofChromatographic Science,2015,53(2): 204–209.[12] 万建春,郭平,王文君,等.液相色谱–串联质谱法测定鳗鱼中链霉素和双氢链霉素残留量[J].分析试验室,2015(2):168–172.[13] 蓝运华,江绍锋,龚有丽,等.会仙湿地水体百草枯污染及其固定/转化率[J].广西师范大学学报:自然科学版,2014(4):142–151.(上接第22页)[5] 张莉,王芳.气相色谱–质谱联用快速测定饮用水源水中半挥发性有机物[J].化学分析计量,2011,20(5): 42–43.[6] 杨翠萍,连进军,谭培功,等.环境污染事故中挥发性有机物快速定量方法[J].化学分析计量,2006,15(6): 35–37.[7] VDA 278: 2002 Thermodesorption analysis of organic emissions for the characterization of non-metallic automobile interiormaterials[S].[8] ISO 16000–6: 2011 Indoor air-Part 6: Determination of volatile organic compounds in indoor and test chamber air by active sampling on Tenax TA sorbent,thermal desorption and gas chromatography using MS or MS–FID[S].[9] HJ/T400–2007 车内挥发性有机物和醛酮类物质采样测定方法[S].检测唾液可验出癌症 仅需10 min据英国《每日电讯报》报道,科学家正在研究一项10 min内仅靠唾液即可完成癌症检测的技术。

第14卷第6期2023年12月有色金属科学与工程Nonferrous Metals Science and EngineeringVol.14,No.6Dec. 2023加强炼镁传热效率的研究进展郭军华1, 丁天然1, 李培艳1, 孙逸翔1, 刘洁1, 钟素娟1, 张廷安*2(1.郑州机械研究所有限公司新型钎焊材料与技术国家重点实验室, 郑州 450000;2.东北大学冶金学院, 沈阳 110819)摘要:随着轻量化需要日益迫切,金属镁及其合金由于具有质量轻、比强度和比刚度高等特性,应用越来越广泛,镁行业的发展也愈发受人关注。
皮江法是国内炼镁的主要生产工艺,但是随着绿色低碳发展理念的推行,该炼镁工艺在生产过程中传热效率低、还原周期长、能耗高和排放大等缺点突显,一直制约着炼镁行业的发展。
经过多年的研究,学者们在提高镁冶炼传热效率,降低还原温度,缩短还原周期等方面取得一系列成果。
本文主要从还原剂、工艺条件、传热装置3个方面详细综述了提升炼镁传热效率的研究进展,并对未来炼镁技术发展提出了建议和思路,仅供参考。
关键词:镁冶炼;传热效率;还原剂;传热装置;优化工艺中图分类号:TF822 文献标志码:AResearch progress in strengthening the heat transfer efficiencyof magnesium smeltingGUO Junhua 1, DING Tianran 1, LI Peiyan 1, SUN Yixiang 1, LIU Jie 1, ZHONG Sujuan 1, ZHANG Ting ’an *2(1. State Key Laboratory of Advanced Brazing Filler Metals & Technology , Zhengzhou Research Institute of Mechanical EngineeringCo., Ltd., Zhengzhou 450000, China ; 2. School of Metallurgy , Northeastern University , Shenyang 110819, China )Abstract: With the increasing need for lightweight materials, magnesium and its alloys have been widely used because of their light quality, high specific strength and specific stiffness, and the development of the magnesium industry has attracted increasing attention. The Pidgeon process is the main production process of magnesium smelting in China. However, with the implementation of the green and low-carbon development concept, the process has many shortcomings, such as low heat transfer efficiency, long reduction cycle, high energy consumption and large emissions, which has been restricting the development of the magnesium smelting industry. After years of research, scholars have made a series of achievements in improving the heat transfer efficiency of magnesium smelting, reducing reduction temperature, shortening the reduction cycle, etc. In this paper, the research progress in improving the heat transfer efficiency of magnesium smelting was reviewed in detail from three aspects including reductant, process conditions and heat transfer device, and suggestions and ideas on the existing magnesium smelting technology were put forward for reference only.Keywords: magnesium smelting ; heat transfer efficiency ; reducing agent ; heat transfer device ; optimization process收稿日期:2022-11-15;修回日期:2022-12-24基金项目:国家自然科学基金辽宁联合基金资助项目(U1508217)通信作者:张廷安(1960— ),教授,主要从事有色金属冶炼、新工艺的开发、固废处理等方面的研究。
Accumulation of heavy metals from contaminated soil to plants and evaluation of soil remediation by vermiculiteMery Malandrino ⇑,Ornella Abollino,Sandro Buoso,Agnese Giacomino,Carmela La Gioia,Edoardo MentastiUniversity of Torino,Department of Analytical Chemistry,Via Pietro Giuria 5,10125Torino,Italya r t i c l e i n f o Article history:Received 15July 2010Received in revised form 6October 2010Accepted 7October 2010Available online 4November 2010Keywords:Contaminated soil Heavy metalsSequential extraction In situ immobilization Vermiculite Edible plantsa b s t r a c tWe evaluated the distribution of 15metal ions,namely Al,Cd,Cu,Cr,Fe,La,Mn,Ni,Pb,Sc,Ti,V,Y,Zn and Zr,in the soil of a contaminated site in Piedmont (Italy).This area was found to be heavily contaminated with Cu,Cr and Ni.The availability of these metal ions was studied using Tessier’s sequential extraction procedure:the fraction of mobile species,which potentially is the most harmful for the environment,was much higher than that normally present in unpolluted soils.This soil was hence used to evaluate the effectiveness of treatment with vermiculite to reduce the availability of the pollutants to two plants,Lact-uca sativa and Spinacia oleracea ,by pot experiments.The results indicated that the addition of vermiculite significantly reduces the uptake of metal pollutants by plants,confirming the possibility of using this clay in amendment treatments of metal-contaminated soils.The effect of plant growth on metal fractionation in soils was investigated.Finally,the sum of the metal percentages extracted into the first two fractions of Tessier’s protocol was found to be suitable in predicting the phytoavailability of most of the pollutants present in the investigated soil.Ó2010Elsevier Ltd.All rights reserved.1.IntroductionPeri-urban agriculture has been assuming greater significance in the last years due to an increase in population and urbanization.The input of metal pollutants to such marginal agricultural lands through sewage sludge and industrial effluents (Chhonkar et al.,2000a,b;Rattan et al.,2002,2005)is a matter of concern because of the persistence of these metals in soils,uptake by crops and accumulative effects in animal and human beings (Gupta and Gup-ta,1998).One remediation technology for metal-contaminated soil includes excavation of soil followed by washing and disposal of the treated material (US Environmental Protection Agency,1991).However,this remediation strategy is very expensive and gives rise to a considerable amount of wastes.Although phytoremediation,i.e.the use of plants for ameliorating metal-contaminated sites,has received considerable attention in recent years,one of the ma-jor problems associated with this approach is low metal removal rates (Pierzynski et al.,2000;McGrath et al.,2002;Rattan et al.,2002).Hence,a logical and rational remediation process appears to be chemical stabilization,i.e.metal immobilisation by using dif-ferent mon methods for immobilisation of met-als in soil are to apply lime,phosphates,organic matter residues and other natural or synthetic additives,like zeolites,beringite,hy-drous oxides of Al,Fe and Mn (Vangronsveld et al.,1990;Gworek,1992;Khattak and Page,1992;Bolan and Duraisamy,2003).Alto-gether the chemical stabilization method is surely a relatively sim-ple and cost-effective remediation technique for contaminated sites and hence it merits systematic investigation.For these reasons,in recent years,many researchers studied the behaviour of natural organic and inorganic materials having high adsorption capacity and which are particularly abundant and inex-pensive,in order to use them as low-cost effective amendments for on-site remediation of metal-contaminated soils.Clay minerals,such as montmorillonite and vermiculite,have a high cation exchange capacity and high specific surface area asso-ciated with their small particle sizes.Such properties have made these materials the target of several adsorption studies.Previous investigations in our laboratory showed that vermiculite,a wide-spread natural clay,has a high total capacity toward some heavy metals (Malandrino et al.,2006).In the present work we have determined the extent and distribution of contamination in a site polluted by heavy metals and the metal availability by Tessier’s fractionation method.Then we have evaluated the effectiveness of the treatment with vermiculite on the uptake of pollutants present in the investigated soil by two plants,Lactuca sativa and Spinacia oleracea .Finally we have studied the changes in metal availability after application of vermiculite.0045-6535/$-see front matter Ó2010Elsevier Ltd.All rights reserved.doi:10.1016/j.chemosphere.2010.10.028⇑Corresponding author.Address:Universitàdegli Studi di Torino,Dipartimentodi Chimica Analitica,Via Pietro Giuria 5,10125Torino,Italy.Tel.:+390116707844;fax:+390116707615.E-mail addresses:mery.malandrino@unito.it (M.Malandrino),ornella.abolli-no@unito.it (O.Abollino),sandro.buoso@unito.it (S.Buoso),agnese.giacomino@u-nito.it (A.Giacomino),gioia@unito.it ( Gioia),edoardo.mentasti@unito.it (E.Mentasti).2.Experimental2.1.Site descriptionThe investigated site is located in northeast Piedmont,Italy, near the town of Borgomanero,in the province of Novara,as re-ported in Fig.1.The area,now uncultivated and characterised by a high environmental deterioration,was used as permanent mea-dow and woodland in the past.The contamination occurred be-cause of the repeatedfloods of a small stream,which today has a new course,caused by the insufficient size of the stream bed withSample dissolution for the determination of total concentra-tions was performed with a Milestone MLS-1200Mega(Milestone, Sorisole,Italy)microwave laboratory unit.Metal determinations were carried out with a Varian Liberty 100model(Varian Australia,Mullgrave,Australia)inductively cou-pled plasma-atomic emission spectrometer(ICP-AES).The calibra-tions were always performed with standard solutions prepared in aliquots of sample blanks.High purity water(HPW)produced with a Millipore Milli-Q sys-tem was used throughout.All the reagents used were of analytical grade.Standard metal solutions were prepared from concentrated170M.Malandrino et al./Chemosphere82(2011)169–178Grain size distribution,pH,organic carbon,organic matter and cation exchange capacity(CEC)were determined according to the official methods of soil analysis of the Italian legislation issued in 1999(Ministerial Decree,1999)using the following procedures: Esenwein’s pipette method for particle size distribution;a1:2.5 soil–1M KCl suspension for pH measurements;the Walkley–Black method for organic carbon and organic matter content;the barium chloride method for CEC.2.3.1.Total metal contentFor the determination of the total metal concentrations acid digestion in a microwave oven was chosen as the dissolution procedure.Sample aliquots of500mg were treated with a mixture of 10mL of aqua regia and4mL of hydrofluoric acid in PTFE bombs. Four heating steps of5min each(250,400,600,250W respec-tively),followed by a ventilation step of25min,were applied.Then 1.4g of boric acid were added,and the bombs were further heated for5min at250W and again cooled by ventilation for15min.The resulting solutions werefiltered with paperfilters and diluted to 100mL with HPW.The solutions were employed for the ICP-AES analysis.2.3.2.Tessier sequential extraction procedureThis sequential extraction procedure(Tessier et al.,1979,1980) partitions the metals intofive operationally defined chemical frac-tions:extractable and exchangeable(1M MgCl2,agitation for1h), bound to carbonates(1M CH3COONa,plus CH3COOH(pH5),agita-tion for5h),bound to Fe and Mn oxides(0.04M NH2OHÁHCl in25% CH3COOH,agitation for6h at the temperature of96±3°C),bound to organic matter and sulphides(0.02M HNO3and5mL of30% H2O2,agitation for5h at the temperature of85±2°C)and resid-ual.Thefifth fraction was not considered because it is mainly pres-ent as scatter within the crystal lattices of the rocks and minerals that constitute the soil and it may be released only in the long term (Davidson et al.,1998;Abollino et al.,2006).After each extraction the suspension was centrifuged for20min at4000rpm.The solution was separated,while the precipitate was washed with10mL of HPW and centrifuged again for5min.The washing water then was added to the supernatant,while the pre-cipitate was used for the subsequent extractions.The extracts were diluted to25(first fraction),50(second fraction)or100(next two ones)mL,stabilised by addition of25,50or100l L of concentrated nitric acid respectively and analysed.2.4.Vermiculite propertiesVermiculite was supplied by Aldrich.It is a naturally occurring mineral which contains a small amount of crystalline silica in the form of quartz.The main properties of the clay are reported in a previous paper (Malandrino et al.,2006).Altogether it has a good cation exchange capacity(CEC=40.08meq/100g)and a high pH at the point of zero charge(pH zpc=8.63).Potassium is the principal exchangeable ion present in the interlayer of this clay.2.5.Pot experiments with lettuce and spinachThe soil sampled in the centre of the site was put in polyethyl-ene pots(5kg in each pot)and treated by adding vermiculite (500g).At the same time an aliquot of the soil and one of unpol-luted soil were left unamended and used as reference.Each treat-ment was performed in triplicate.L.sativa and S.oleracea were planted in separated pots.The pots were laid out at room temper-ature(25°C)and they were watered three times a week with 500mL of tap water.Plants grown in the control pots were har-vested after1month.The vegetables grown in the potsfilled with polluted soil amended with vermiculite were harvested twice: after1month and after2months.All harvested plants were oven-dried at60°C for16h,then ground in an agate mortar.0.2g of ground plant material were digested with10mL of concen-trated HNO3in a microwave oven,using the following heating pro-gram:5min at250W,5min at400W,5min at600W,5min at 250W and25min of air ventilation.After cooling,the digestion solutions werefiltered with paperfilters and diluted to50mL. The concentrations of Cr,Cu,Mn,Ni,Pb and Zn in the digests were determined by ICP-AES.The transfer capability of heavy metals from soil to the edible part of vegetables was described using the translocation factor,cal-culated according to the following formula:TF=metal concentration in edible plant parts(mg kgÀ1dry weight)/metal concentration in substrate(mg kgÀ1dry weight) (Cui et al.,2004;Greger et al.,2007;Li et al.,2010).At the end of the pot experiments,soil samples were taken out of each pot,air-dried,sieved through a2mm sieve and ground. Sub-samples were used to determine the pH changes and other sub-samples were used to investigate changes in the metal frac-tionation with Tessier’s sequential extraction procedure(Section2.3.2).3.Results and discussion3.1.Soil characterizationTable1reports particle size distribution and some general char-acteristics,namely percentages of organic carbon,organic matter and CEC,of the soils examined in this study.The average percentage of organic matter is higher in the uncontaminated soil than in the contaminated soil;this result was not unexpected since the soil used as reference was chosen to obtain a good growth of vegetables and it hence is rich in humus and other organic substances.As to particle size analysis,the most abundant components are sand andfine sand in the uncontami-nated and in the contaminated soil respectively.Therefore both soils can be considered as‘‘loamy sand”according to the USDA tex-tural triangle(USDA Forest Service,Soil Conservation Service, 1983).The clay percentage in the uncontaminated soil is higher than in the contaminated soil,but this is not sufficient to explain the high CEC evidenced in the former.The most likely explanation of this trend is that part of this capacity is due to the higher humus content of this soil.3.1.1.Total metal contentThe pH and total content of15metals together with the relative standard deviations are reported in Table2.It must be borne in mind that elements such as Cd,Cr,Cu,Fe,Mn,Ni,Pb and Zn are present in unpolluted soils at what can be defined‘‘background level”,both as a result of natural phenomena,such as the contribu-Table1General characteristics of the investigated soils.Contaminated soil Uncontaminated soilOrganic carbon(%w/w)17.1434.00Organic matter(%w/w)29.5558.62CEC(cmol kgÀ1)31.3056.82Particle size distribution%Sand19.3049.03%Fine sand56.8831.37%Silt10.10 5.88%Fine silt8.35 6.00%Clay 5.377.72M.Malandrino et al./Chemosphere82(2011)169–178171tion of the parent material,and of common anthropogenic activi-ties.We can suspect or confirm the presence of pollution when the concentrations are higher than the typical values for soils found in literature and exceed the levels present in the nearby areas.In this study,in order to define the presence and level of con-tamination,the concentrations of elements were compared with the normal ranges in soils(Alloway,1990)and Earth’s crust(Ture-kian and Wedepohl,1961)and with the maximum acceptable lev-els in soils according to the Italian Legislation(Ministerial Decree 2006)for the reclamation of contaminated sites(Table3).Italian limits depend on land use,and are lower for public and private green areas and residential sites(‘‘A”limits)and higher for indus-trial areas(‘‘B”limits).The soil samples considered have low pH values(mean:5.10; range:4.06–6.08),therefore they can be defined as acid(from very strongly acid to moderately acid).Such pH values are however within the range normally found in typical temperate environment (4–8).The pH of the soils investigated can be likely low owing to the low buffering by Al;in fact this element is present at lower concentrations than the mean concentrations in soil and Earth’s crust.High concentrations of Cd,Cr,Cu,Ni,Pb and Zn were found in Borgomanero site.In particular,the contents of Cr,Cu and Ni ex-ceeded Italian‘‘B”limits,and those of Cd,Pb and Zn were higher than‘‘A”limits.The presence of Cu,Cr and Ni could be due to an input from the effluents of electroplating industries.The elements of mainly geochemical origin,such as Al,La,Mn,Y and Zr,are instead present at concentrations lower than the typical values in soil and Earth’s crust.This may be due to a‘‘dilution effect”of the black sludge carried by thefloods in this area on the native lithogenic element content.The contamination is high in the soil samples collected in the core of the site and it seems to decrease in the soil samples col-lected at the border of site,where the spontaneous vegetation is present.As a whole,the investigated metals can be divided into two groups:(1)Cd,Cr,Cu,Ni,Pb and Zn,whose concentrations are heavily affected by anthropogenic inputs,and(2)Al,Fe,La,Mn, Sc,Ti,V,Y and Zr,which are mainly of geochemical origin,even if a contribution from human activities(especially for Fe)cannot be excluded.3.1.2.Metal mobilityWe studied the fractionation of metals with Tessier’s protocol. This procedure has been applied and accepted by a large group of specialists(e.g.LopezSanchez et al.,1996;Irvine et al.,2009;Rico et al.,2009)even if,like all others sequential extraction procedures,Table2Total metal concentrations(mg kgÀ1),standard deviations and pH in soils at Borgomanero site.B1B2B3B4B6B7pH 5.00 4.06 5.17 4.51 5.80 6.08 Al24000±130027840±90423214±98430060±97829542±435220964±2860 Cd 5.93±0.05 5.97±0.09 4.81±0.11 3.37±0.22 1.07±0.04 1.19±0.13 Cr3056±1063332±1723300±183408±204617±2002174±183 Cu4424±1805245±2065340±2874680±1407022±2821576±148 Fe30000±61026504±122529152±44226630±18328390±144025416±1223 La 6.66±0.218.09±1.097.57±0.908.33±0.9014.7±0.8 6.25±0.94 Mn268±8276±16270±5240±4296±16340±8 Ni760±181345±81990±401106±131969±89904±60 Pb847±36648±39641±7620±221017±59345±6 Sc 2.70±0.34 3.08±0.24 2.61±0.24 2.77±0.24 3.45±0.50 2.39±0.31 Ti5737±1204664±2534513±794360±1386873±1734717±254 V31.9±1.827.5±1.629.2±0.226.6±0.730.4±2.120.3±2.1 Y9.20±0.457.32±0.949.02±0.948.07±0.948.34±1.218.34±1.23 Zn379±13552±181112±10573±5951±45545±25 Zr47.1±2.945.3±1.441.5±1.239.1±2.049.5±2.152.3±3.2Table3Mean metal concentrations in soil samples at Borgomanero site,means and typical ranges in soil and earth’s crust,admissible levels in soil according to the Italian Legislation(mg kgÀ1).Borgomanero site Soil a,b Earth’s crust c‘‘A”limit d‘‘B”limit eAl259377200055320;4200–88000Cd 3.720.35;0.01–2.00.20;0.035–0.42215 Cr331554;5–1500204;2–1600150800 Cu471525;2–25052.33;4–250120600 Fe276802600039610;3800–94300La8.603754;10–115Mn282550;20–100001617;390–6700Ni134619;2–750252;2–2000120500 Pb68619;2–30017.80;1–801001000 Sc 2.838.910.50;1–30Ti514429003407;300–13800V26.8080;3–50076.2;20–25090250 Y 6.902538.22;20–90Zn68560;1–90071.5;16–1651501500 Zr103230157;19–500a Sposito(1989).b Alloway(1990).c Turekian and Wedepohl(1961).d Limit established by Italian Legislation for public and private green areas and residential sites.e Limit established by Italian Legislation for industrial areas.172M.Malandrino et al./Chemosphere82(2011)169–178it suffers from several drawbacks,such as lack of selectivity and ele-ment redistribution during extraction,and it provides operationally defined results(Bermond and Yousfi,1997;Gomez-Ariza et al., 1999).In any case the partitioning of the metals into the different fractions is a suitable tool to estimate mobility and plant availabil-ity of many elements in soils(Sager et al.,2007)and gives an indi-cation of their potential harmful effects(Yukselen and Gokyay, 2006).Fig.2a and2b shows the sequential extraction results.The data are expressed as percent fractions of the total concentration.The results obtained clearly show that the samples collected in the centre of the site(B1–B4)are characterised by higher percent-ages of metals extracted into thefirst two fractions,hence they seem to be polluted in a higher extent.This could be the explana-tion for the absence of spontaneous vegetation in the centre of the site.In fact many researchers(Li et al.,1995;Delmas et al.,2002; Lua et al.,2003;Sager et al.,2007)affirm that the exchangeable fraction,or the exchangeable plus bound to carbonates fractions, should be readily available to plant roots.The amounts found in thefirst fraction in B1–B4samples are very high,in particular for Cd,Cu,Ni,Pb and Zn.Also a relatively high percentage of Y was released:generally this element has a geo-logical origin and it is not extracted into thefirst fractions at detect-able levels.Nevertheless it is not possible to ascertain whether this behaviour is due to an anthropogenic origin,since its fractionation with Tessier’s protocol or with other sequential extraction schemes was rarely considered(Abollino et al.,2006).The relatively large MgCl2-extractable fraction of the above-mentioned elements in this soil is also due,at least in part,to the low soil pH.The percentages extracted into the second fraction are lower than in thefirst one for most of the metals considered,even if they are higher than those usually reported for contaminated soils (Abollino et al.,2002a;Lu et al.,2003).Altogether the percentages extracted into thefirst two fractions of Tessier are much higher than the ones obtained for agricultural soils of Piedmont studied in a previous work(Abollino et al.,2002b).In such unpolluted soils, most elements(with the exception of Al,Fe,Mn,Ti)were undetect-able by ICP-AES in thefirst fraction and were typically present at levels below1%in the second one.In particular Cd,Cu,Ni,Pb and Zn,whose total concentrations in B1–B4samples are higher than the Italian‘‘A”limits,were extracted at percentages between 4.62%and32.50%and between3.17%and20.45%respectively into thefirst and second fraction,while the extraction percentages of the same metals from the agricultural soils were lower than0.8% and4%respectively.These results clearly indicate that these met-als can be identified as pollutants in Borgomanero soil.The percentages of metals extracted into the third fraction are usually higher than those present in the previous ones,reaching 77.83%for Cd in B7sample.The main soil pollutants are extracted into this fraction at high percentages with the exception of Cu that, instead,is principally released into the fourth fraction.This behav-iour is in agreement with the generalfindings that this element forms stable complexes with organic matter(Wong et al.,2002). Instead,Mn is extracted at low percentages into the third fraction and it is mainly present in the residual fraction;this probably oc-curs because it derives from the dissolution of crystalline oxides containing this element.The behaviour of Cr is in agreement with its features of inert metal and with the results of many other studies,which reported a low availability for this element both in clean and contaminated soils(e.g.Burt et al.,2003;Abollino et al.,2006).It is interesting however to note that this element is present at high percentages in the third and fourth fraction,while usually it is extracted nearly exclusively in the residual fraction.It is possible that this element was discharged in the soil investigated as Cr(VI).This form is more mobile than Cr(III)and is considered the most toxic form of Cr. Cr(VI)is a strong oxidising agent,having a high positive reduction potential,and in the presence of soil organic matter is reduced to Cr(III)(Bartlett and James,1988;Alloway1990).This reduction is more rapid in acid soils,like that of Borgomanero,than in alkaline ones.Some researchers found that,following reduction of Cr(VI),Cr in soil was present as hydrated oxides of Cr(III)mixed with or oc-cluded in Fe oxides(Cary et al.,1977;McGrath and Smith,1990). This is a possible explanation for the behaviour of Cr in this soil.The other elements(Al,Fe,La,Mn,Sc,Ti,V and Zr)were ex-tracted at low percentages in thefirst four fractions,showing that they are strongly bound to the soil matrix and,hence,can be con-sidered as constituents of the soil.The other elements(Al,Fe,La,Mn,Sc,Ti,V and Zr)were ex-tracted at low percentages in thefirst four fractions,showing that they are strongly bound to the soil matrix and,hence,can be con-sidered as constituents of the soil.In general,a clear differentiation is evident between the two groups of elements evidenced above.In particular the metals iden-tified as pollutants(Cd,Cr,Cu,Ni,Pb and Zn)are characterised by a high mobility and hence they could be released into the environ-ment upon a change in ionic strength,soil pH or redox potential. Instead the elements identified as lithogenic(Al,Fe,La,Mn,Sc, Ti,V,Y and Zr)are mainly associated to the residual fraction and this is a further confirmation of their natural origin.3.2.Pot experiments with lettuce and spinachWe considered two soil samples:a composite sample of Borgo-manero soil and an uncontaminated soil used as control.Our pre-vious studies on synthetic solutions showed that vermiculite is a very efficient sorbent for heavy metals(Malandrino et al.,2006; Abollino et al.,2008).In order to test the behaviour of this clay in a real scenario,we studied its effectiveness as soil amendment in reducing the phytoavailability of the metal pollutants.We eval-uated the effect of the addition of vermiculite by measuring metal uptake by plants,using lettuce and spinach as test crops,and by thefirst two fractions of Tessier’s protocol,that provide assessment of potential metal availability to plants.In this way we also evalu-ated the suitability of the extractants used in such fractions in pre-dicting the phytoavailability of metal pollutants.3.2.1.Effect of amendment on the uptake of metals by lettuce and spinachHeavy metals,when present in excess,disturb plant metabo-lism,affecting respiration,photosynthesis,stomata opening and growth.The extent of assimilation of heavy metals from soil depends on whether they are present in a form that can be absorbed by plants. For example,Pb can be strongly absorbed by soil particles and, thus,it is scarcely translocated to plants,while Cd ions are rela-tively mobile in soil and can be more easily absorbed by vegeta-tion.Plants accumulate heavy metals from soils through different mechanisms such as:absorption,ion exchange,redox reactions, and precipitation–dissolution.In addition to these accumulation mechanisms,the solubility of trace elements in soils depends on the minerals present in them(carbonates,oxides,hydroxides, etc.),on the level of soil organic matter(humic acids,fulvic acids, polysaccharides and organic acids),soil pH,redox potential,tem-perature and humidity(Tarradellas et al.,1996).Only the portions of elements which present availability are transferred into plants (Smical et al.,2008).In order to evaluate the effectiveness of treatment with vermic-ulite for the reduction of the phytoavailability of the pollutants, green salad(L.sativa)and spinach(S.oleracea)were selected as test plants.Thefirst was chosen because it is easily available,it assim-ilates all relevant toxic metals,and common people have some experience in growing it worldwide.As early as1957,lettuce seed-M.Malandrino et al./Chemosphere82(2011)169–178173174M.Malandrino et al./Chemosphere82(2011)169–178lings were proposed as a means to investigate the amount of avail-able nutrients in test soils,as an alternative to chemical extraction methods.In fact,lettuce is a general indicator for heavy metals be-cause it can easily accumulate high metal concentrations per plant biomass.Spinach was chosen because,like lettuce,is a very popu-lar and commonly seen leafy vegetable and,moreover,many researchers showed that it can be easily contaminated by Cd from soil(Zupan et al.,1995;Dheri et al.,2007;Wang et al.,2009).Fig.3a demonstrates that metal uptake by lettuce and spinach is much higher in the contaminated soil than in the control soil,due to the high percentages of available elements present in it(see Sec-tion3.2.2.).Moreover,it is evident that the addition of vermiculite strongly influences the amount of metals assimilated by plants,in particular for Cr,Cu and Ni,which have a higher concentration in Borgomanero site,and for lettuce,known as bioaccumulator plant (Sager et al.,2007).In particular,comparing the metal concentra-tions in the leaf vegetables grown in the untreated polluted soil and in the same amended with vermiculite,a percentage decrease from62%to nearly100%for pollutant(Cd,Cr,Cu,Ni,Pb,Zn)uptake was observed.As soil pH is the most important factor which governs the solid-solution equilibria of metals in soil(Hooda and Alloway,1998),the effect of addition of vermiculite on soil pH was studied.The appli-cation of this clay raised the soil pH by approximately two units, from4.17to5.99.Therefore,the influence of vermiculite on metal availability isfirst of all related to the increase in pH brought about by the addition of this amendment.Many researchers(Hooda and Alloway,1998;Naidu et al.,1994;Paulose et al.,2007)evidenced an increase of metal sorption in soils with increasing pH.The rea-sons advanced for this behaviour are:(1)an increase in negative surface charge,resulting in an increase in cation adsorption;(2)a higher probability of formation of hydroxy species of cation metals that have a greater affinity for adsorption sites than the aqueous metal cations and,finally,(3)a higher possibility of precipitation of metal hydroxides.Moreover,previous studies(Malandrino et al.,2006;Abollino et al.,2008)demonstrated that,in this pH condition,vermiculite presents a high uptake total capacity toward the considered metals.Since the pH zpc of this clay is8.63,at pH$6 most of the silanol and aluminol groups on edges of the clay are protonated,hence the main mechanisms responsible for retention of these metals are sorption by reaction with the planar sites of the clay and consequent formation of outer-sphere complexes and introduction inside the lamellar spaces of this clay.Metal concentrations in lettuce and spinach plants grown in the unpolluted soil decreased in the order Zn>Mn>Cu>-Ni%Cr>Pb%Cd.This behaviour suggests that,in natural condi-tions,these vegetables have a similar trend of assimilation capability for these elements.In the vegetables cultivated in the contaminated soil the order of heavy metal concentrations was dif-ferent:Cu>Cr>Ni>Zn>Pb>Mn>Cd.This probably occurs be-cause Cu,Cr and Ni were present at high concentrations in the contaminated soil and,hence,they were preferentially assimilated by plants even if the vegetables considered do not have higher assimilation capacity towards these elements in comparison to the other ones.The addition of vermiculite caused variation in the concentration order of heavy metals in lettuce and spinach rel-ative to that observed in untreated contaminated soil.In detail,the concentrations in lettuce and spinach decreased,respectively,in the order Mn>Ni>Zn>Cu>Cr>Pb%Cd and Zn>Ni>-Cu>Mn>Cr>Pb%Cd after thefirst harvest,while the sequences observed after the second harvest were respectively Mn>Zn> Cu>Cr>Ni>Pb%Cd and Zn>Mn>Cu>Ni>Cr>Pb%Cd.There-fore,it is evident that the addition of vermiculite caused a decrease in the phytoavailability of the pollutants such as Cr,Cu and Ni and that,increasing the contact time between contaminated soil and clay,the order of metal assimilation for both vegetables verges on that found in control soil,i.e.in natural conditions.Nevertheless the metal concentrations found in vegetables grown in soil treated with vermiculite were higher than the values usually reported for leaf vegetables grown in unpolluted soils(Gaw et al.,2008;Li et al., 2010)and in our control soil.Further studies are necessary tofind out whether,increasing the contact time between polluted soil and vermiculite,the metal concentrations in lettuce and spinach would fall again in the natural ranges for these vegetables.The TF values of heavy metals from soil to vegetables are shown in Fig.3b.These values are higher than the TFs usually reported forfield-grown vegetables(Smical et al.,2008;Li et al.,2010).In fact it must be borne in mind that the uptake of metals from soils is greater in plants grown in pots than in thefield from the same soil.This is probably due to differences in microclimate and soil moisture, and mainly to the fact that the roots of container-cultivated plants grow solely in contaminated soil and more closely near from each other,whereas those offield-cultivated plants may reach down to less contaminated soil layers(Benzarti et al.,2008;Smical et al., 2008).The soil-to-plant TF values decrease in the orderM.Malandrino et al./Chemosphere82(2011)169–178175。
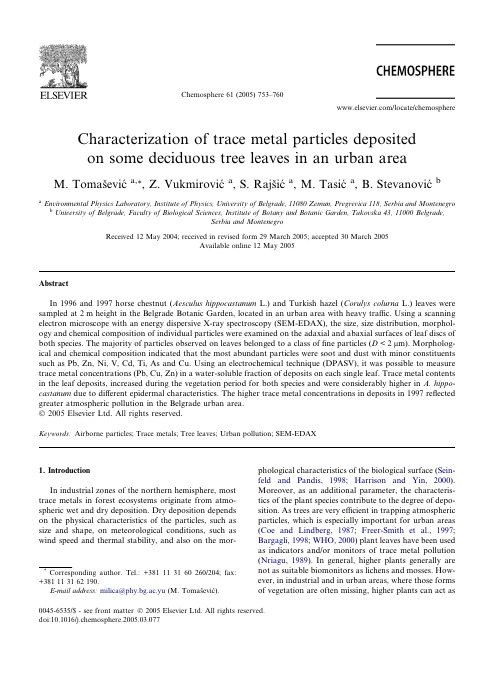
Characterization of trace metal particles deposited on some deciduous tree leaves in an urban areaM.Tomasˇevic ´a,*,Z.Vukmirovic´a ,S.Rajs ˇic ´a ,M.Tasic ´a ,B.Stevanovic ´baEnvironmental Physics Laboratory,Institute of Physics,University of Belgrade,11080Zemun,Pregrevica 118,Serbia and MontenegrobUniversity of Belgrade,Faculty of Biological Sciences,Institute of Botany and Botanic Garden,Takovska 43,11000Belgrade,Serbia and MontenegroReceived 12May 2004;received in revised form 29March 2005;accepted 30March 2005Available online 12May 2005AbstractIn 1996and 1997horse chestnut (Aesculus hippocastanum L.)and Turkish hazel (Corulys colurna L.)leaves were sampled at 2m height in the Belgrade Botanic Garden,located in an urban area with heavy traffiing a scanning electron microscope with an energy dispersive X-ray spectroscopy (SEM-EDAX),the size,size distribution,morphol-ogy and chemical composition of individual particles were examined on the adaxial and abaxial surfaces of leaf discs of both species.The majority of particles observed on leaves belonged to a class of fine particles (D <2l m).Morpholog-ical and chemical composition indicated that the most abundant particles were soot and dust with minor constituents such as Pb,Zn,Ni,V,Cd,Ti,As and ing an electrochemical technique (DPASV),it was possible to measure trace metal concentrations (Pb,Cu,Zn)in a water-soluble fraction of deposits on each single leaf.Trace metal contents in the leaf deposits,increased during the vegetation period for both species and were considerably higher in A.hippo-castanum due to different epidermal characteristics.The higher trace metal concentrations in deposits in 1997reflected greater atmospheric pollution in the Belgrade urban area.Ó2005Elsevier Ltd.All rights reserved.Keywords:Airborne particles;Trace metals;Tree leaves;Urban pollution;SEM-EDAX1.IntroductionIn industrial zones of the northern hemisphere,most trace metals in forest ecosystems originate from atmo-spheric wet and dry deposition.Dry deposition depends on the physical characteristics of the particles,such as size and shape,on meteorological conditions,such as wind speed and thermal stability,and also on the mor-phological characteristics of the biological surface (Sein-feld and Pandis,1998;Harrison and Yin,2000).Moreover,as an additional parameter,the characteris-tics of the plant species contribute to the degree of depo-sition.As trees are very efficient in trapping atmospheric particles,which is especially important for urban areas (Coe and Lindberg,1987;Freer-Smith et al.,1997;Bargagli,1998;WHO,2000)plant leaves have been used as indicators and/or monitors of trace metal pollution (Nriagu,1989).In general,higher plants generally are not as suitable biomonitors as lichens and mosses.How-ever,in industrial and in urban areas,where those forms of vegetation are often missing,higher plants can act as0045-6535/$-see front matter Ó2005Elsevier Ltd.All rights reserved.doi:10.1016/j.chemosphere.2005.03.077*Corresponding author.Tel.:+381113160260/204;fax:+381113162190.E-mail address:milica@phy.bg.ac.yu (M.Tomasˇevic ´).Chemosphere 61(2005)753–760/locate/chemospherebiomonitors.Also,in some cases higher plants may give better quantifications for pollutant concentrations and atmospheric deposition than non-biological samples. Therefore,using plant leaves primarily as accumulative biomonitors of trace metal pollution has attained great ecological importance(Markert,1993;Bargagli,1998; WHO,2000).The aim of this work was to set up a reliable method-ological approach in sampling and analytical procedures for investigation of the material deposited on tree leaves, i.e.to estimate the validity of the use of broad tree leaves of two species(A.hippocastanum and C.colurna)to monitor urban trace metal pollution.It was thefirst step towards later foliar analyses(trace metal contents in sin-gle leaves are to be presented in the following paper). Two sequential experimental years(1996and1997)with very different air quality conditions in an urban area of Belgrade were chosen.The morphological(shape,size, size distribution)and chemical characteristics of depos-ited individual particles were investigated using scanning electron microscopy with energy dispersive X-ray spec-troscopy(SEM-EDAX).The concentrations of trace metals(Pb,Cu,Zn,Cd),in the water-soluble fraction of deposits on single leaves were measured with differen-tial pulse anodic stripping voltammetry(DPASV).2.Experimental2.1.SamplingLeaves were sampled from two deciduous tree spe-cies:horse chestnut(Aesculus hippocastanum L.)and Turkish hazel(Corulys colurna L.)in the Botanic Gar-den,which is located in an urban area of Belgrade with heavy traffic.It is situated within a triangle of busy streets,a lower area of the city.There is a small foundry for arts and crafts about300m in the N–NE direction from the sampling site,as well as a thermal plant about 1500m in the N–NW direction.Samples for DPASV analyses were taken,in a dry period,at the beginning (May and June)and end(September)of the seasonal vegetation cycles in1996and1997and at the end of Sep-tember in1997for SEM-EDAX.Wearing polyethylene gloves,leaves growing at2m height were cut offwith clean scissors.Each leaf was placed horizontally in a polycarbonate Petri dish and transferred to a Class 100clean room,with the specific conditions required for analyses of low concentrations of trace metals (Vukmirovic´et al.,1996),where the samples were pre-pared for trace metal analyses and electron microscopy.2.2.Sample preparation and SEM-EDAX analysesSix leaves from each tree species were picked up from the2m height for SEM-EDAX analysis.Samples were prepared for both adaxial and abaxial leaf surfaces of both tree species.Discs of10mm diameter were cut from unwashed leaves with a sharp device,wearing poly-ethylene gloves.Each leaf disc was mounted on an alu-minum stub,over double-sided stick tape.The stubs were placed on a perforated round Teflon plate,cut to fit in a polycarbonate Petri dish.Leaf samples were dried in air in the clean room.To minimize charge build-up on the samples from exposure to the SEM electron beam the samples were coated with100–150A˚layer of high purity carbon using vacuum evaporator(Balzers/Union FL-9496)prior to analyses.An SEM Philips XL30apparatus equipped with a thin-window EDAX DX4system for energy dispersive X-ray microanalysis was used to analyze the particles deposited on the leaf samples.The SEM observations were carried out at magnifications up to2000·while the electron beam energy wasfixed at20keV,and the working distance in most cases was about10mm and probe current was100pA.Particles were observed by backscattered electron images.Three different leaf discs of the adaxial and abaxial surfaces for both tree species were examined in the same way.Ten photomicrographs were randomly taken of each0.03mm2area at624·magnification and about 1800particles per species were assessed to their mor-phology and about900for X-ray spectra analysis.For each tree species about0.025%of the original leaf sur-face was examined.An energy dispersive X-ray spectrum(EDS)was col-lected from the selected particles in the range between0 and15keV for a preset time(live time)of10–20s.The total X-ray count rate was between1000and 2000counts sÀ1.The elements observed were:Al,Si, C,S,N,Cl,P,K,Ca,Na,Mg,Cr,Fe,Cu,Zn,Ni, Cd,As,Ti and V with detection limit>1wt.%.The rel-ative elemental composition of the particles,were com-puted directly with EDAX software,using the‘‘ZAF’’(atomic number,absorption,fluorescence)correction. As the particles deposited on leaves have complex shapes,quite different from an idealflat sample,there may be over-or underestimation of the actual atomic concentration,but this does not prevent identification of the most important particle types.Periodical checks of the X-ray peak identification,were conducted.EDX spectrometer gain calibration was accomplished by using a gold/copper standard since X-ray lines from these two elements span almost the entire spectral range of the detector.2.3.Determination of trace metal concentration in the water soluble fraction of leaf depositsSix single leaves of each species were analyzed for particular sampling episode.Each leaf was washed in bidistilled,deionized water,using an ultrasonic bath.754M.Tomasˇevic´et al./Chemosphere61(2005)753–760Afterfiltration,water-soluble trace metal concentrations were determined in the washed-offfraction.Prior to analysis,this fraction was stored in a polyethylene bottle with added nitric acid,to0.1N solution.All the chemi-cals and standard solutions used were of ultra pure qual-ity.An electrochemical method,the differential pulse anodic stripping voltammetry with a hanging mercury drop electrode,DPASV was used for determination of trace metal contents.Measurements were performed with an EDT,ECP140Polarograph and the analytical technique was described in detail previously(Vukmi-rovic´et al.,1997;Tomasˇevic´et al.,2004).The detection limits(ng mlÀ1)were0.1,1.0,0.5,and1.0for Cd,Pb,Cu and Zn respectively.3.Results and discussion3.1.Scanning electron microscopy and X-ray microanalysisScanning electron photomicrographs presented in Fig.1show a general appearance of adaxial and abaxial surfaces of hypostomatic leaves of A.hippocastanum and C.colurna sampled in a dry period,at the end of Sep-tember1997.Approximately,10–15%of the leaf surface was covered with deposited particles.A greater density of particles was observed on A.hippocastanum(Fig.1a and b)than on C.colurna(Fig.1c and d).This could be explained by different epidermal characteristic such as surface roughness,which was more prominent in A. hippocastanum than for C.colurna.In both species,a few hairs were present on both,adaxial and abaxial leaf surfaces.Otherwise,epidermal appendages were not expressed.Particles were present at a higher density on the adaxial leaf surfaces of both tree species.They were not homogeneously distributed and mean particle den-sity approximately varied from5000to20000mmÀ2. Thus,heavy loads were observed in some areas,mostly around the main veins(Fig.1d).Particles were present in a wide range of diameters up to50l m,but the analyses of the particle size distribu-tion for both species showed that50–60%of the ana-lyzed particles were of a diameter less than2l m(fine particles)mainly originating from anthropogenic acitiv-ities.Two main particle categories were observed:parti-cles of natural sources include materials of organic origin(pollen,bacteria,fungal spores etc.).This cate-gory also includes suspended soil dust(primarily soil mineral)such as the angular-shaped material.Particles from antropogenic sources mostly emitted from high temperature combustion processes are characterized by their spherical shapes and smooth surfaces.This type of particles occur as individual particles but alsoin Fig.1.Scanning electron micrographs of particles deposited on the adaxial(a)and abaxial(b)leaf surfaces of A.hippocastanum;and the adaxial(c)and abaxial(d)leaf surfaces of C.colurna.M.Tomasˇevic´et al./Chemosphere61(2005)753–760755aggregate form as agglomerates of similar-sized particles and individual large particles caring several smaller attached particles.Fine particles,were often observed around and over the10l m stomatal openings on abaxial leaf surfaces (Fig.2a).Even though entrance offine particles into leaves through the stomata is physically possible,it is not yet clear whether and to what extent this may occur. Both,fine and coarse particles(>2l m),were reported to be responsible for increased leaf temperature and decreased light absorption,thus also affecting photosyn-thesis.Plugging the stomata probably leads to certain physiological disturbances(even in the presence of chemically inert particles)such as decreased stomatal conductance and gas exchange,which may further influ-ence the water regime and photosynthesis(Farmer, 1993;Hirano et al.,1995).Also,the exceedance of nutri-tion elements in stomatal cavities hinders opening and closing stomata and is not physiologically available for tree species(Mankovska et al.,2004).The chemical composition of the particles deposited on both plant species suggested that the most abundant particles were:soot(C)and soil dust with characteristic matrix elements(Si,Al,Fe,Mg,N,S,Ca,K,Cl);fuel oil particles rich in Al,Si,Ca,Ni,Fe,V and Pb;coal ash particles containing C,Al,Si,K,Ca;and particles liber-ated by the local industrial processes(Fe,Zn,Ni,Cu or Pb-rich).Among the particles containing trace metals, the most abundant were particles in aggregates form, where Pb is the major element associated with lower concentrations of S,Fe,Cd,Cu,As and Zn.Classifica-tion rules were based on particle chemistry,typically expressed in terms of EDX peak-to-background values and relative peak ratios for the elements of interest as well as to the particle classification rules described in USEPA(2002).The SEM photomicrographs of some characteristic particles and their X-ray spectra are presented in Fig. 2–5.Thefine particle in a stomatal opening(Fig.2a), was identified as Pb-rich particle according to its X-ray spectrum(Fig.2b).The particle of diameter about 4l m on the left of the stomata had multiangular mor-phology and its X-ray spectrum(Fig.2c)suggesting a zinc sulphide particle.On the right side of thestomata, Fig.2.Scanning electron micrograph of a stomatal area of an abaxial leaf surface of A.hippocastanum(a);EDX-spectrum of a lead-richfine particle in the stomatal opening(b);EDX-spectrum of a particle with multiangular morphology on the left(c);EDX-spectrum of aflake particle on the right(d).756M.Tomasˇevic´et al./Chemosphere61(2005)753–760there was a C-rich flake particle with a surface coating containing Fe,Si,Mg,Cu,Zn,Na,and S and its X-ray spectrum is shown in Fig.2d.This type of parti-cles might be attributed to resuspended road dust.Bright inclusions in BSE images of all three particles provide evidence for the presence of heavy elements.Fig.3shows a fine flake C-rich particle containing Ca,K,Au,Mg,Ni and Na probably originating from oil combustion processes;the presence of Au might be explained as a contribution from the arts and crafts foundry near-by.A spherical cluster (14l m in diameter)consisting of fine Fe-rich particles is presented in Fig.4a and its X-ray spectrum in Fig.4b.This particle was lib-erated from a high temperature process.Details of the complex lead phase particle,of the diameter of about 20l m,consisting of sub particles smaller than 2l m,and the X-ray spectrum are presented in Fig.5.This type of heavy metal particle belongs to the most typical urban aerosols (Pina et al.,2000;Celis et al.,2004;Dabek-Zlotorzynska et al.,2005).Above this agglomerate,two elliptical particles are carbona-ceous and appear to be either pollen or spores.According to the particle morphology and chemical composition indicated by the SEM-EDAX procedure,it may be suggested that particles deposited on leaves mostly originated from the traffic,or from the resus-pended particles and possibly local sources.3.2.Concentrations of water soluble trace metals in leaf depositsTrace metal (Pb,Cu,Zn and Cd)concentrations were measured in water soluble fractions of deposits washed-offfrom the leaves of C.colurna and A.hippocastanum sampled at the beginning and end of the vegetation peri-ods in two sequential years,characterized with differentatmospheric trace metal concentrations (Tomasˇevic ´,2003).Using the DPASV method,it was possible to measure the concentrations of Pb,Cu and Zn at the level of a single leaf.The concentrations of Cd in the deposits were below the detection limit.Trace metal concentrations (l g g À1)in A.hippocasta-num and C.colurna leaf deposits in both vegetation peri-ods and 2years are presented in Table 1.In both plant species,an increase of trace metal concentrationsinFig.3.Scanning electron micrograph of a fine flake particledeposited on the abaxial surface of a C.colurna leaf (a)and its X-ray spectrum(b).Fig. 4.Scanning electron micrograph of a spherical cluster consisting of fine Fe-rich particles (a)and its X-ray spectrum (b).M.Tomas ˇevic ´et al./Chemosphere 61(2005)753–760757the deposits was evident at the end of September com-pared to the May and June.Deposition generally increases with the length of leaf exposure to atmospheric pollutants and their structural surface changes,such as roughness and the appearance of necrotic lesions during their life cycles.Although some deposited particles are washed offor leached by rain,a considerable load remains adhered to leaves at the end of the vegetation period.Due to different amounts of deposits on leaves,the coefficient of variation (C v )was high;for Pb concen-trations was up to 0.62for C.colurna and 1.68for A.hippocastanum .Significant variations between single leaves were obtained,probably in consequence of differ-ences in chemical composition,number,and size of deposited particles.Concentrations of water soluble trace metals in deposits on leaves of A.hippocastanum were much high-er than on C.colurna leaves (Table 1).At the end of September 1997,Zn and Cu concentrations in the water soluble fraction of A.hippocastanum leaf deposits were about 1.5times higher and Pb concentration was morethan double the level found for C.colurna.A.hippocas-tanum leaves are characterized by a rougher surface,which contributed to the higher level of particle trap-ping,as was observed by scanning electron microscopy.Table 1also shows that all trace metals determined in the water-soluble fraction were found at much higher concentrations in 1997in comparison to 1996for both species.For example,for A.hippocastanum ,Zn content was about four times,and Pb content was about seven times higher in September 1997than in the previous year.This finding clearly confirms that the amount of deposits on leaves directly reflects the level of atmo-spheric pollution.During 1996,drastically reduced pollutant emissions were evident due to less traffic and industrial emissions under the conditions of the UN economic sanctions.According to the Annual Report on the Air Quality in Belgrade,published by the Institute of Public Health of Belgrade (1997),concentrations of air pollutants were much higher in the Belgrade urban area in 1997than in ly,Pb and Zn concentrations were more than doubled in the total atmospheric deposition in 1997.In Table 1,data marked with an asterisk,relating to May 1996,represent the soluble-exchangeable form of the trace metals.Trace metal concentrations were much higher in May 1996compared to the results for May 1997.Thus,Cu concentration was about 1.5times higher and Pb concentration was several times higher.The reason was additional extraction of deposited parti-cles on leaves with mild acid.After ultrasonic extraction with bidistilled water and filtration,the residue was dis-solved in 0.1N HNO 3.This labile (soluble-exchange-able)fraction of trace metals in the particles included easily water soluble compounds:sulphates,nitrates,chlorides and also carbonates and some oxides soluble in mild acid.Many authors have investigated the solubility of urban particles in water and mild acid with a great vari-ety of results.Kyotani and Iwatsuki (2002)reported that anthropogenic materials may exist mainly as easily water-soluble forms,suggested that the most of these elements were present as sulphates,nitrates and chlo-rides.Hoffmann et al.(1997)pointed out the remarkable solubility of Zn in water up to 73%.Fernandez et al.(2002)found that the water soluble fraction of trace metals from fine urban particles amounted to 27%for Cu,25%for Cd and only 4%for Pb.However,in mild acid the solubility increased to 37%for Cu,46%for Cd and 37%for Pb.Voutsa and Samara (2002)concluded that the labile fraction of trace metals in urban particles even reached 93%for Zn,90%for Cd and Cu and 70%for Pb.All these authors concluded that atmospheric trace metals,originating from anthro-pogenic sources,were primarily distributed in the fine particle fraction.Almost all the Cd,Cu,Zn and PbinFig.5.Scanning electron micrograph of complex lead phaseparticles of diameter about 20l m,consisting of particles smaller than 2l m (a)and their X-ray spectrum (b).758M.Tomasˇevic ´et al./Chemosphere 61(2005)753–760water soluble components were concentrated in thefine fraction(Park and Kim,2005;Samara and Voutsa, 2005).Coarse particles were presumed to originate from soil,road dust or building material,which are mostly insoluble(Manalis et al.,2005;Duan et al.,2005).It is very difficult to draw a common conclusion about the relative amount of water-soluble trace metals in urban aerosols,because it is very variable and depends on many factors,such as:emission sources, time of the year,meteorological parameters etc.In May1996,the trace metals were mostly in the water insoluble fraction and predominantly soluble in weak acid.In1997traffic increased considerably,changing the conditions drastically.It may be assumed that the water-soluble fraction of trace metals in urban aerosols also followed this trend.4.ConclusionCharacterization of trace metal particles deposited on horse chestnut(Aesculus hippocastanum L.)and Turkish hazel(Corulys colurna L.)leaves in an urban area of Bel-grade,sampled in the Botanic Garden,in1996and1997 was performed.The SEM-EDAX analyses of individual particles deposited on both side of leaves showed that the50–60%belong to a class offine particles (D<2l m)singly or gathered in agglomerates of various shapes(spherical,flakes,irregular).The particles were distributed with higher density on the adaxial leaf sur-faces of both tree species.Fine particles,mainly of anthropogenic origin,were often observed around and over the stomata which may affect the physiological characteristics of leaves.According to their morphology and chemical composition investigated by the SEM-EDAX,the most abundant particles were soot(C)and dust(Si,Al,Fe,Mg,N,S,Ca,K,Cl)with minor constituents such as Pb,Zn,Ni,V,As,Ti,Cu and Cd. Metal-rich particles were frequently observed.The most abundant were particles in aggregates form,where Pb is the major element associated with lower concentrations of S,Fe,Cd,Cu,As and Zn.It may be suggested that the particles deposited on leaves mostly originated from the traffic,or from the resuspended particulate matter.In both plant species and for both years,the concen-trations of trace metals(Pb,Cu,and Zn)in the water-soluble fraction of leaf deposits,analysed by DPASV, increased from the beginning towards the end of the veg-etation period.Much higher concentrations of all mea-sured trace metals in the water-soluble fraction were found in1997compared to1996in both species.In 1997,conditions in the Belgrade atmosphere changed drastically due to increased traffic and industrial activi-ties.It has been shown that the effect of elevated air pol-lution can be reflected in the amount of deposits on leaves,especially on A.hippocastanum.Therefore,A. hippocastanum could be used as a suitable biomonitor of atmospheric pollution in urban areas. AcknowledgmentsThe authors are grateful to Professor Dr.Ivan Grzˇe-tic´,from the Faculty of Mining and Geology for helpTable1Trace metal concentrations in l g gÀ1in leaf deposits in1996and1997vegetation periodsA.hippocastanum C.colurnaX a S a C v X a S a C v Zinc May19969.95a 2.680.27 5.18a 2.630.51 June19960.860.320.37 3.18 2.910.91September1996 4.43 2.950.67 2.090.80.38May1997 5.09 2.00.40 6.45 1.430.22September199716.9 2.10.1211.84 5.250.44 Copper May1996 2.96a 1.890.64 3.1a 1.510.49 June19960.370.120.320.340.160.48September1996 1.520.760.500.730.250.34May1997 1.820.230.13 1.780.60.34September1997 5.14 1.210.23 3.68 1.480.40 Lead May199610.67a9.90.9312.31a7.450.60 June1996 1.480.48 1.68 4.91 3.030.62September1996 2.31 1.560.670.840.510.61May1997 1.070.510.48 3.130.50.16September199716.2 2.80.177.34 1.90.26According to Mage(1984),for the C2v >0.33,the distribution of the data is log-normal or pseudo-lognormal.a The soluble-exchangeable form of metals obtained from the extraction by water+diluted acid(0.1N NHO3):X a—arithmetic mean;S a—standard deviation;C v—coefficient of variation(C v=S a/X a).M.Tomasˇevic´et al./Chemosphere61(2005)753–760759with the SEM–EDAX analyses.This work was sup-ported by the Ministry of Science and Technology of the Republic of Serbia,projects1449and1505. ReferencesBargagli,R.,1998.Trace Elements in Terrestrial Plants:An Ecophysiological Approach to Biomonitoring and Biore-covery.Springer-Verlag,Berlin,Heidelberg,NY.Celis,J.E,Morales,J.R.,Zaror,C.A.,Inzunza,J.C.,2004.A study of the particulate matter PM10composition in the atmosphere of Chilla´n.Chemosphere54,541–550.Coe,J.M.,Lindberg,S.E.,1987.The morphology and size distribution of atmospheric particles deposited on foliage and inert surfaces.Journal of Air Pollution Control Association37,237–243.Dabek-Zlotorzynska,E.,Kelly,M.,Chen,H.,Chakrabarti,C.L.,2005.Application of capillary electrophoresis com-bined with a modified BCRsequential extraction for estimating of distribution of selected trace metals in PM2.5fractions of urban airborne particulate matter.Chemosphere58,1365–1376.Duan,F.,He,K.,Ma,Y.,Jia,Y.,Yang,F.,Lei,Y.,2005.Characteristics of carbonaceous aerosols in Beijing.Chemosphere,in press,doi:10.1016/j.chemosphere.2004.12.035.Farmer, A.M.,1993.The effects of dust on vegetation.A review.Environmental Pollution79,63–75. Fernandez,A.J.,Ternero,M.,Barragan,F.J.,Jiminez,J.C., 2002.A chemical speciation of trace metals forfine urban particles.Atmospheric Environment36,773–780.Freer-Smith,P.H.,Holloway,S.,Goodman, A.,1997.The uptake of particulates by an urban woodland:Site descrip-tion and particulate composition.Environmental Pollution 95,27–35.Harrison,R.M.,Yin,J.,2000.Particulate matter in the atmosphere:Which particle properties are important for its effects on health?The Science of the Total Environment 249,85–101.Hirano,T.,Kiyota,M.,Aiga,I.,1995.Physical effects of dust on leaf physiology of cucumber and kidney bean plants.Environmental Pollution89,255–261.Hoffmann,P.,Dedik,A.N.,Deutsch,F.,Sinner,T.,Weber,S., Eichler,R.,Sterkel,S.,Sastri,C.S.,Ortner,H.M.,1997.Solubility of single chemical compounds from an atmo-spheric aerosol in pure water.Atmospheric Environment31, 2777–2785.Institute of Public Health of Belgrade,1997.Annual Report on the Air Quality in Belgrade.Kyotani,T.,Iwatsuki,M.,2002.Characterization of soluble and insoluble components in PM2.5and PM10fractions of airborne particulate matter in Kofy city,Japan.Atmo-spheric Environment36,639–649.Mage,D.T.,1984.Pseudo-lognormal distributions.Journal of Air Pollution Control Association31,374–377. Manalis,N.,Grivas,G.,Protonotarios,V.,Moutsatsou,A., Samara,C.,Chaloulakou,A.,2005.Toxic metal content of particulate matter(PM10),within the Greater Area of Athens.Chemosphere(available online10February2005). Mankovska,B.,Godzik,B.,Badea,O.,Shiparyk,Y.,Mora-vcik,P.,2004.Chemical and morphological characteristics of key tree species of the Carpathian Mountains.Environ-mental Pollution130,41–54.Markert,B.,1993.Instrumental analysis of plants.In:Markert,B.(Ed.),Plants as Biomonitors.Indicators for HeavyMetals in Terrestrial Environment.VCH,Weinheim,pp.65–103.Nriagu,J.O.,1989.A global assessment of natural sources of atmospheric trace metals.Nature338,47–49.Park,S.S.,Kim,Y.J.,2005.Source contributions tofine particulate matter in an urban atmosphere.Chemosphere 59,217–226.Pina,A.A.,Villasenor,G.T.,Fernandez,M.M.,Kudra,Ramos, R.L.,2000.Scanning electron microscope and statistical analysis of suspended heavy metal particles in San Luis Potosi,Mexico.Atmospheric Environment34,4103–4112. Samara,C.,Voutsa,D.,2005.Size distribution of airborne particulate matter and associated heavy metals in the roadside environment.Chemosphere59,1197–1206. Seinfeld,J.H.,Pandis,S.N.,1998.Atmospheric chemistry and physics.In:From Air Pollution to Climate Change.John Wiley and Sons,Inc.,NY,Chichester,Weinheim,Brisbane, Singapore,Toronto.Tomasˇevic´,M.,2003.Trace metals deposition and accumula-tion on tree leaves,PhD thesis,University of Belgrade. Tomasˇevic´,M.,Rajsˇic´,S.,-D ord-evic´,D.,Tasic´,M.,Krstic´,J., Novakovic´,V.,2004.Heavy metals accumulation in tree leaves from urban areas.Environmental Chemistry Letters 2,151–154.USEPA,2002.Guidelines for the Application of SEM/EDX Analytical Techniques to Particulate Matter Samples.EPA-600/ Environmental Protection Agency. Voutsa, D.,Samara, C.,bile and bioaccessible fractions of heavy metals in the airborne particulate matter from urban and industrial areas.Atmospheric Environment 36,3583–3590.Vukmirovic´,Z.,Rajsˇic´,S,Markovic´, D.,Unkasˇevic´,M., Novakovic´,V.,Tomasˇevic´,M.,1996.Deposition of lead, oxidants and NO2to linden leaves in Belgrade in1993and 1994.Proceedings Of EUROTRAC SymposiumÕ96,pp.367–371.Vukmirovic´,Z.,Marendic´-Miljkovic´,J.,Rajsˇic´,S.,Tasic´,M., Novakovic´,V.,1997.Resuspension of trace metals in Belgrade under conditions of drastically reduced emission levels.Water,Air and Soil Pollution93,137–156. WHO,2000.Air hygiene report no.10.Biomonitoring of Air quality using plants,Geneva.760M.Tomasˇevic´et al./Chemosphere61(2005)753–760。
Pressureless Sintering of Nano-Ag Paste with Low Porosity for High Power Die AttachFen Chen, Sihai Chen, Guangyu Fan, Xue Yan, Chris LaBarbera, Lee Kresge, and Ning-Cheng LeeIndium CorporationIntroduction•For high power devices, high-Pb solder die attach materials run into limitation in service temperature, electrical & thermal conductivity.•Ag-sintering pastes emerged as a solution. But, either high sintering pressure or polymeric binder is needed, thus suffering major constraints at adoption.•A pressureless nano-Ag sintering paste is developed without use of polymer binder. The performance will be presented and discussed.Die Attach Materials & Parts•7 nano-Ag sintering pastes were evaluated, including C1 (C sintered at 250C), C2 (C sintered at 280C), F1, F2, Y1, Y2, Y3, and Y4. •Control -92.5Pb/5Sn/2.5Ag solder paste (T3, 89%).•For all sintering pastes, a pressureless sintering process was used, witha customized sintering profile for each paste.•Parts–Silicon die:•3mmx3mm;•surface finish -750A Ti+ 3kA Ni + 750A Ag–DBC:•12.5mm x 12.5mm•ceramic thickness -0.375mm•Cu -0.12mm on both sides with Ni layer thickness of 3.5 µm, Au200 nmDie Attach Process & Testing •Sintering paste printed onto DBC, then place die•The sandwich was sent through heating profile under air without pressure.•High-Pb solder paste reflowed under N2.•Post sintering treatment(1) Thermal aging: 250C(2) Thermal Shock:–-45°C/+240°C, liquid to liquid/10 min dwell•Testing of Sintered samples(1) Shear Test:(2) Morphology Analysis:–Fracture morphology –OM & SEM (after shear test)–Cross-sectional microstructure –SEM & EDS (with & without shear test).Ag Sintering Paste C before Sintering•Viscosity: Brookfield -Cone & Plate, 25 °C, 10 rpm, mPa·s(cP): 24,900•Thixotropic index: -0.69•Density: 4.5 g/cm3•Metal load: 91%Typical Properties of Sintered Materials•Joint bond line thickness requirement: 50 –100 um•Extractable Ionic Content–Cl -: ≤ 1 ppm–Br -: ≤ 1 ppm–NO 3--: ≤ 1 ppm–SO 42-: ≤ 1 ppm–Na +: ≤ 1 ppm–K +: ≤ 1 ppmProperty Ag sintering Indalloy 151Melting point (o C)961296Density (g/cm 3)4-811Electrical resistivity (µΩ.cm)520Thermal conductivity (W/mK)21825CTE (ppm/C)1929Sintering ProcessThe paste can be sintered under air with standard Pb-free reflow oven, the typical heat profile is as follows:Metallization of Parts:Die with Ag or Au metallization DBC with Ag or Au metallization5010015020025030050100150T e m p e r a t u r e (o C )Time (min)10mm x 10mm 3mm x 3mmHigh Temp Joint Shear Strength •High temperature shear test shows that the service temperature of Ag sintering joint is 470C, while that of high Pb solder is about 230C.010203040500100200300400500600S hearS trengt h(M Pa )Temperature (°C)Relation between Shear Strength andTemperatureAg-sintered92.5Pb5Sn2.5Ag6.1Shear Strength vs Thermal Aging C1 vs C2•The difference in the shearstrength behavior probablycan be attributed to ahigher internal stress of C2caused by a higher sintering temperature.•Although the porosity of C1 is slightly higher than C2,the benefit of a lowerinternal stress appears tooutweigh the higherporosity disadvantage.250C 280CReliability –Shear Strength of 250C Aged Joints92.5Pb5Sn2.5AgC1 & C2 Continue on Sintering upon AgingAg Migrated to DBC Slowly for C1 & C2 & Maintained Good Bonding to Die.Belt structureFor C1 & C2, Ag migrated toward DBC but still bonded well to dieLittle Ag remain on dieFor C1 & C2, plenty Agon both die and DBCside after agingAg Sintered Joint vs High Pb Joint (X-Ray Imaging Analysis)0h, BLT=32um 144h, BLT=82um336h, BLT=76um840h, BLT=25um1608h, BLT=70um3200h, BLT=50umCross-sectional View of Thermally Aged Ag-Sintered JointsLower at Center of Joints•Porosity of Ag joint decrease toward the center of joints, attributable to venting routing factor, where outgassing moving from inside toward outside.5101520253035P o r o s i t y (%)Distance to Die CenterRelation between Joint Location Under Die &Porosity0hr 144hr 336hr 840hr 1608hr 3200hry = -0.2194x + 32.614R² = 0.6578010*******20406080100P o r o s i t y U n d e r D i e (%)Bondline Thickness (microns)Relation between Bondline Thickness &PorosityHigher for Thinner Bondline•Porosity of Ag joint decrease with bondline thickness1.Upon sintering, Ag shrinks in all dimension.2.Die and DBC does not shrink with sintering, thus cause tension on Ag when Ag shrank due to sintering3.The thinner the bondline, the higher the tension on bulk Ag, thus the less shrinkage achievable.DieDCBAgPorosity Did Not Reduce with Thermal Aging Due to Stress Equilobrium•Porosity of Ag joint remain stable with thermal aging, due to stressequilibrium between tension and shrinkage. Equilibrium established at end of sintering.y = -0.0005x + 20.882R² = 0.009101020301000200030004000P o r o s i t y (%)250C Aging Time (hrs)Relation between 250C Aging Time and PorosityReliability of HigPb Joint (92.5Pb5Sn2.5Ag)250C/840hrMechanism of spalling is as follows:-Sn react with Ni, form Ni3Sn4-Cu diffuse thru Ni, react with Sn forming NiCuSn IMC-NiCuSn IMC spall off formed a floating belt-Diffusion of the Ag on the Si surface into solder-Sn react with Ni, form NiSn IMC -Voids form due to the diffusion of Sn -Cracks form starting from the void and extendAg Migration Severe at Thin Bondline1. 3.2Si/2.7Ni/94.1Ag2. 94.7Ag/1.8Cu/2.1Ni3. 95.6Ag/2Cu/2.4Ni4. 91Ag/2.2Cu/4.8Ni/2AuTendency for Ag to migrate to the DBC to form a dense layer is driven by thetendency for Ag to alloy with Ni, Cu, and Au . The supply of Ni and Cu is plenty on the DBC side, while that on the die side is very limited due to the thin layer of Ni on die. Thin bondline may aggravate impact of Ag migration.(thin bondline)Ag Migration Moderate at Thick Bondline1. 0.9Si99.1Ag2. 100Ag3. 100Ag4. 97.84Ag/1.33Cu/0.84NiTendency for Ag to migrate to the DBC to form a dense layer is driven by the tendency for Ag to alloy with Ni, Cu, and Au . The supply of Ni and Cu is plenty on the DBC side, while that on the die side is very limited due to the thin layer of Ni on die.Thick bondline should be more forgiving on Ag migration.(thick bondline)F1 after Thermal Shock 100 cycles (-45/240C)Au and Ni were detected by EDS in the middle of the sintered Ag area on ENIG DBC and the die backside, suggest the sintered joints partially peeled off from the substrate. –root cause of thermal shock failure.Thermal Shock Test Too Severe?•A blank DBC coupon 0.925” x 0.925” was also subject to thermal shock. It was found that the Cu layer delaminated from the ceramic core in less than 100 cycles. This result suggested that this thermal shock test condition was too harsh for a reliability study of the die on the DBC.•Smaller DBC reduce the challenge level.• A novel nano-Ag sintering paste C has been developed for a pressureless sintering process under air. Both C1 and C2 exhibited a microstructure much more stable than the control 92.5Pb5Sn2.5Ag, which suffered both IMC spalling, voiding and cracking after thermal aging.•Ag migrated toward the DBC to form a dense layer of AgCuNi(Au).•Ag migration attributed to tendency of Ag to form alloy with Au, Ni, and Cu at the DBC side, and may be affected by the chemistry of nano-Ag paste.•Porosity of sintered joints was lower toward center of die, due to the venting route factor.•Porosity was also lower with a higher bondline thickness, due to a reduced tension in the joint.•Thermal aging time has negligible effect on porosity, presumably due to balanced stress between tension and sintering shrinkage.•The maximum service temperature of Ag sintered joint is about 470°C, versus 230°C for high-Pb joints.• A liquid to liquid thermal shock test from -45°C to 240°C was attempted, and was considered too harsh for the die/DBC system employed in this study.Thank You。
• 14 •轻金属2020年第12期氧化铝生产过程中金属镓回收现状及展望崔保河(沈阳铝镁设计研究院有限公司,辽宁沈阳110001)摘要:金属镓是战略性金属,氧化铝企业副产品,氧化铝行业提供了全球90%产量。
作为氧化铝生产大国,我国粗镓产量非常大,约占世界80%以上。
最近十年,国际上金属镓的供应和价格变动剧烈,为我国氧化铝企业科学决策造成了极大困扰。
本文对金属镓行业现状进行分析,并对金属镓后期市场进行了初步预测。
关键词:氧化铝;镓;预测中图分类号:TF843.1 文献标识码:A文章编号:1002-1752(2020)12-0014-03DOI:10.13662/j. cnki. qjs. 2020. 12. 004Current situation and prospect of gallium recovery in alumina productionCui Baohe^Shenyang Aluminum and Magnesium Engineering and Research Institute Co;Ltd.,Shenyang 110001, China) Abstract : Gallium is a strategic metal and by - product of alumina enterprises. Alumina industry provides 90% of global output. As a big alumina producer ,the output of crude gallium in China is very large, accounting for more than 80% of the world. In the last decade, the supply and price of gaUium in the world have changed dramatically, which has caused great trouble for the scientific decision - making of alumina enterprises in China. In this paper , the current situation of metal gallium industry is analyzed , and the market of metal gallium in the later stage is preliminarily predicted.Key words : alumina ; gallium ; predicted1综述镓在地壳中的含量为0.0015%。
一个新颖的使用限制烧结确定粘性泊松比致密的材料阿拉汶Mohanram*,李相浩,加里·梅辛,戴维·格林介电研究中心,材料研究所,材料科学与工程系,美国宾夕法尼亚州立大学,大学科技园,PA16802,USA2004年11月17日在2005年2月1日收到;2005年2月1日2005年3月2日摘要本文介绍了一种新技术,常压约束烧结和粘性的比喻概念的基础上,确定粘性烧结材料泊松比。
该方法涉及测量自由烧结烧结率标本,标本由两个非烧结层的约束。
代表数据的低温共烧陶瓷(LTCC)材料的报告。
粘性的泊松比变化在93%,其中同意74%,从0.25密度约为0.45与模型预测。
该方法只适用于在致密的中间阶段,因为是粘性材料在此期间烧结。
2005年金属学报公司出版,由Elsevier公司保留所有权利关键词:粘性泊松比约束烧结;低温共烧陶瓷;烧结1。
介绍仍有新的活动在发展中描述和建模工具来预测烧结过程基于粘性类比[1],连续烧结方法[2]。
主要目标之一是产生实验本构参数,如粘度、粘滞泊松比值(t)支持发展烧结的本构模型。
测量也有价值的计算联合烧结结构应力和失真[3],如低温联合烧结陶瓷(低温共烧陶瓷)电子包裹,在发展中方法可以最小化他们。
很少有人了解如何将这些特性进化在烧结过程中以及它们如何变化与射击条件。
不同的模型提出了预测这些属性的演变与致密化,但这些不同意在他们的预测[1]。
作为反复研究人员指出,有一个明确的需要测量粘滞特性和了解他们的关系以使微观结构。
各种各样的技巧,包括烧结锻造[10],和变化趋势,如热膨胀循环加载[11、12],[13]不连续烧结锻造和弯曲蠕变[14],已经被用来测量轴向粘度。
粘性泊松比一个更富有挑战性的工作参数来衡量,因为这要求较高的预报精度收缩率、密度的测量。
最近,同时高分辨率的测量的缩水在两个轴向速度和横向的方向报道。
例如,左丁晓萍。
[15]测量t在致密氧化铝通过不连续的热锻。
5000t/d水泥熟料预分解窑窑尾(低氮氧化合物排放)工艺设计摘要:水泥是社会经济发展最重要的建筑材料之一,在今后几十年甚至是上百年之内仍然是无可替代的基础材料,对人类生活文明的重要性不言而喻。
以预分解窑为代表的新型干法水泥生产技术已经成为当今水泥工业发展的主导技术和最先进的工艺,它具有生产能力大、自动化程度高、产品质量高、能耗低、有害物排放量低等一系列优点。
但在水泥生产过程中会放出一些有害物质,尤其是氮氧化合物,按照要求本设计采用一系列的方法,以求降低氮氧化合物的排放浓度。
本设计依据当今新型干法水泥生产技术的设计要求进行,主要任务是窑尾部分的工艺设计,包括新型干法水泥生产对原料、燃料的质量要求,配料方案的设计和配料计算,物料平衡计算,主辅机平衡与设备选型,储库计算和窑尾工艺设计。
关键词:5000t/d;预分解窑;低氮排放;工艺设计The Process Design of the Back End of Precalciner Kiln for 5000T/D Cement Clinker(Low Nitrogen OxideEmissions)Abstract:Cement is one of the most important building materials of the social and economic development, within the coming decades or even a century,Cement is still no substitute for basic materials, the importance of human civilization is self-evident.calciner kiln as the representatives has become leading technology and the most advanced technology of the cement industry. It has many advantages, such as high throughput, a high degree of auto mation, high quality products,low energy consumption, low emissions of harmful substances, etc.In the production process of cement will release a number of harmful substances,particularly nitrogen oxides,according to the requirement of this design,the design uses a range of methods to reduce the concentration of nitrogen oxide .Based on the design of new dry cement production technology in today's design requirements, the main task is the back-end part of the process design, including the production of cement raw materials, fuel quality requirements, the design of ingredients and ingredients, the material balance calculation , the main auxiliary balance and equipment selection, calculation and storage back-end process design.Key words: 5000T / D, Low Nitrogen Emissions, Process Precalciner kiln, Design目录第1章绪论........................................................... ..11.1 引言 (1)1.2设计简介 (1)第2章建厂基本资料 (3)2.1设计题目 (3)2.2建厂条件 (3)2.3原料质量要求 (3)2.3.1水泥原料质量要求.......................................... (3)2.3.2石膏和混合材质量要求 (4)2.4燃料品质要求 (5)2.5熟料热耗的选择 (6)2.6生产方法和窑型的选择 (6)第3章配料计算与物料和主机平衡 (8)3.1配料计算 (8)3.1.1原料原始数据 (8)3.1.1.1原燃料化学成分 (8)3.1.1.2原、燃料水分 (8)3.1.1.3烟煤的工业分析 (8)3.1.1.4烟煤的元素分析 (8)3.1.2水泥配料方案 (8)3.1.2.1三个率值的选择 (9)3.1.2.2煤灰掺入量的计算 (10)3.1.2.3干燥原料配合比试配 (10)3.1.2.4干燥原料配合比调整 (12)3.1.2.5生料湿原料配合比的计算 (14)3.1.2.6生料配合比最终确定 (14)3.2物料平衡计算 (15)3.2.1烧成车间生产能力和工厂生产能力的计算 (15)3.2.2原燃料消耗定额计算 (18)3.2.3全厂物料平衡表 (24)3.3主机平衡与选型 (24)3.3.1车间工作制度确定 (24)3.3.2主机选型 (25)3.3.3主机平衡表 (32)第4章储库计算 (33)4.1各种物料储存期的确定 (33)4.2各种原料储存设施的计算 (34)4.2.1石灰石、原煤、联合预均化堆场、石膏、矿渣预均化堆场计算 (34)4.2.1.1石灰石预均化堆场计算 (34)4.2.1.2原煤预均化堆场计算..................... (35)4.2.1.3联合储库计算........................... (36)4.2.1.4石膏、矿渣预均化堆场计算.................. (36)4.3各种物料的储存设施计算 (37)4.3.1生料配料站.............................................. ... .374.3.2生料均化库............................................. .... .394.3.3熟料库.................................................. ... .404.3.4熟料配料站 (40)4.4水泥库计算 (41)4.5储库一览表 (42)第5章物料和热平衡计算......................................... (43)5.1原始资料................................................... . (43)5.2物料平衡与热平衡计算........................................ (44)5.2.1 物料平衡计算............................................. (44)5.2.2 热平衡计算............................................... (50)5.3物料平衡表与热平衡表的编制................................... ..54第6章窑外分解系统的设计计算 (56)6.1原始资料..................................................... ..566.2相关参数的设定 (56)6.3单位烟气的计算 (58)6.4窑尾系统各部位烟气量计算..................................... ..586.5窑尾各部位烟气量汇总表....................................... ..616.6分解炉设计方案选择 (61)6.7分解炉结构尺寸计算........................................... ..636.8旋风筒设计方案选择 (66)6.9旋风筒结构尺寸计算 (68)6.10分解炉与旋风筒尺寸汇总表 (75)第7章窑尾设备的计算及选型...................................... ... (77)7.1窑尾冷却器(喷水装置)的计算及选型....................... . ... (77)7.2窑尾收尘器选型 (77)7.3窑尾高温风机以及窑尾排风机选型 (78)7.4烟囱的计算选型 (78)7.5提升机及喂料装置的选型 (79)第8章低NOX排放技术........................................... .. (86)第9章烧成车间工艺布置........................................... .. (88)第10章全厂工艺平面布置............................................. ..899.1全厂总平面布置基本原则 (89)9.2全厂总平面布置说明.......................................... (90)结语 (91)致谢................................................................. .. .92参考文献.......................................................... .. .. ..93第一章绪论1.1引言我国氮氧化合物的排放量年增长5%-8%,如果不采取进一步的的减排措施,到2030年我国氮氧化合物排放量将达到3540吨,如此巨大的排放量讲给公众健康和生态环境带来灾难性的后果,而水泥行业对氮氧化合物的贡献仅次于电力行业与机动车尾气排放,巨第三。
[文章编号] 10012246X (2003)0420351205[收稿日期]2002-06-07;[修回日期]2002-12-05[作者简介]李 (1963-),男,湖南,教授,博导,从事冶金过程仿真优化与智能控制方面的研究.大型预焙铝电解槽电、热场的有限元计算李 1, 程迎军1, 赖延清1, 周乃君2(11中南大学冶金科学与工程学院,湖南长沙 410083;21中南大学能源与动力工程学院,湖南长沙 410083)[摘 要] 采用加权余量的伽辽金法推导了铝电解槽电、热场计算的有限元方程.利用ANSY S 有限元软件具有的多重单元、多重属性及其能耦合求解电、热场的特点,建立了铝电解槽阳极和熔体大面切片的有限元模型.在合适的边界条件的假定下,对160kA 预焙槽的电、热场进行了仿真计算,分析了槽内的温度分布和电压、电流分布.结果表明:所建有限元模型的仿真结果与设计值吻合较好,证实了采用ANSY S 软件优化铝电解槽设计和开发新型铝电解槽的可行性与准确性.[关键词] ;电场;热场;有限元;ANSY S [中图分类号] TF806125[文献标识码] A0 引言铝电解槽中的“三场”是指在铝电解的生产过程中,存在着相互耦合的物理场,其中包括电流场、磁场、热场、流场和应力场.“三场”分布情况的好坏直接影响到电解槽的电流效率、能量消耗和槽寿命等技术经济指标.国外自60年代起,用数值模拟法先后对“三场”进行了详细的研究,在此基础上形成了一整套完整的技术方案,并将其逐步应用于电解槽的优化设计、技术改造和工艺控制辅助决策支持中,取得了显著的经济效益[1~4].我国自70年代末期起,在吸收和消化了日本轻金属株式会社160kA 中间下料预焙槽技术和经验的基础上,开展了一系列研究,建立了一套相应的数学模型和计算软件包,并在135kA 和160kA 工业槽上进行了验证和改造试验,取得了良好的效果[5~8].但是,这些模型大都是采用有限差分法进行计算的,其缺点是不能很好地适应铝电解槽的复杂区域和边界条件,计算结果精度不够.随着现代数学物理理论、数值模拟方法、计算机技术的发展,有限元法以其适用于求解具有复杂几何形状和复杂边界条件的问题而得到迅速发展,国际上相继出现了几百种面向工程的有限元通用软件,如ANSY S ,M ARC ,NASTRAN ,ASK A ,ADI NA ,S AP 等.本文采用ANSY S 对铝电解槽的稳态电、热场进行有限元计算,由此对槽体内的温度、电压分布及其变化规律做定量分析,为电解槽的优化设计和改造以及新型电解槽的开发提供依据.1 电、热场的有限元方程铝电解槽电、热场有限元计算的基本方程可以从泛函出发经变分求得,也可从微分方程出发用权余法求得.下面以稳态热场为例,说明利用加权余量的伽辽金法建立有限元问题求解的一般格式.铝电解槽稳态热场可用泊松方程来表示,即D [T (x ,y ,z )]=k x 92T 9x 2+k y 92T9y2+k z 92T 9z2+q v =0,(1)取插值函数T (x ,y ,z )= T (x ,y ,z ,T 1,T 2,…,T n ),(2)式中T 1,T 2,…,T n 为n 个待定系数.根据权余法的定义,可得µVWlk x 92T 9x 2+k y 92T 9y 2+k z 92T9z2+q v d x d y d z =0, l =1,2,…,n .(3)式中V 为三维热场的定义域,W l 为权函数.根据伽辽金法对权函数的选取方式,得W l =9 T9T l, l =1,2,…,n .(4) 为了引入边界条件,利用数学中的高斯公式把第20卷第4期2003年7月计 算 物 理 CHI NESE JOURNA L OF C OMPUT ATI ONA L PHY SICS V ol.20,N o.4Jul.,2003区域内的体积分与边界上的曲面积分联系起来,经变换可得9J9T l =µVk x 9W l 9x 9T 9x +k y 9W l 9y 9T 9y +k z9W l 9z 9T9z-q v W l d x d y d z -λΣW l k x 9T 9x cos α+k y 9T 9ycos β+k z9T 9zcos γd S =0, l =1,2,…,n .(5)一般不在整体区域对方程(5)进行计算,而是先在每一个局部的网格单元中计算,最后合成为整体的线性方程组求解.如果将区域划分为E 个单元和n 个结点,则热场T (x ,y ,z )离散为T 1,T 2,…,T n 等n 个结点的待定温度值,得到的合成的总体方程为9J 9T l =∑E e =19Je9T l =0, l =1,2,…,n .(6)方程(6)有n 个,相应可求得n 个结点的温度.同样地,铝电解槽中电场的拉普拉斯方程也可以采用上述方法进行求解.而且由于方程(1)中的内热源q v 指的是电流产生的焦耳热,所以应该将电场和热场进行耦合求解.2 铝电解槽电、热模型目前国内外对铝电解槽阴极部分的电、热场(尤其是槽膛内形)的研究已经很成熟[7,8],但对于阳极和熔体的电、热场,由于二者接触面的导电边界条件难于确定,研究还很不完善.本文利用ANSY S 有限元软件的多重单元与属性以及能耦合求解电热场的特点,对阳极和熔体的电热场进行整体计算,避免了确定阳极与熔体接触面的电流边界条件,可提高计算结果的准确性.根据铝电解槽的对称性,沿小面的中心线呈对称形截开,将阳极、覆盖在阳极上的氧化铝、电解质、铝液沿大面取半个阳极宽的切片,并假定槽膛内形使铝液镜面收缩在阳极投影下(通过阴极优化设计),形成三维解析对象,以代表阳极、电解质、铝液的电、热分布情况.图1为模型及其网格划分图.模型的边界条件如下:①假定碳块的对称面无电、热流通过;②阳极碳块和边部结壳接触处视为绝缘和绝热;③覆盖的氧化铝视为绝缘体,只导热不导电;④电解质和铝液视为等温区;图1 模型网格划分图Fig 11 Sketch of m odel mesh ⑤浸入电解质中的阳极部分和阳极底部视为对流换热面,其换热系数采用文献中的经验数据[10];⑥覆盖氧化铝的上表面、钢爪和铝导杆的表面与周围空气为对流和辐射散热,其散热系数取文[5]中的数据;⑦铝液底部视为等位面;⑧导杆上部电流流入为纽曼(Neumann )边界;⑨计算中不考虑反电势(分解电压和阳极过电压),分析时阳极和熔体单独进行.首先进入ANSY S 一般前置处理器(general PRE 2Process or ),通过点、线、面、体积建立实体模型,并指定体积的属性(单元类型和材料特性)和边界的网格划分大小,ANSY S 的内建程序能自动产生网格,即自动产生节点和单元,同时完成有限元模型.对于阳极、钢爪和铝导杆,采用具有电压和温度两个自由度的S O LI D69单元;对于覆盖氧化铝,采用只具有温度一个自由度的S O LI D70单元;对于电解质和铝液,采用只具有电压一个自由度的S O LI D5(KEY OPT (1)=9)单元.材料的导热系数、比电阻的数据均取自文[9,11];然后进入ANSY S 的求解处理器(S olution Process or ),由命令SFA (对流)、SF (辐射)、DA (等位面)、F (电流)施加模型的边界条件,并由命令S O LVE 进行求解;最后进入ANSY S 的一般后处理器(general POST Process or )分析温度、电压和电流分布.3 计算实例表1为某铝厂160kA 预焙槽所采用的相关参数.本文应用上述模型对该厂槽内的电压、电流分布253计 算 物 理第20卷 和温度分布进行了计算.图2和图3分别为计算所得的阳极的等电位图和等温度图,图4和图5分别为电解质和铝液的等电位图.表1 某厂160kA 预焙槽的相关参数T able 1 R elative p arameters of 160kA preb aked cellParameter Value of parameter ParameterValue of parameterAnode dimension Πmm 1450×660×540Distance between studs Πmm 375S tud dimension Πmm 132×132×286(4)C onduct length of aluminum leader Πmm 1900Number of anodes 24Section dimension of aluminum leader Πmm130×130Current ΠkA 160Thickness of covered alumina Πcm 16Depth of stud Πmm 100Distance between anodes Πmm 250Height of steel beam Πmm 150Distance between anode and side wall Πmm475Height of aluminum Πcm 17T em perature of electrolyte Π℃955Heightof electrolyte Πcm 22T em perature of atm osphere Π℃35Interpolar distance Πcm4图2 阳极的等电位图Fig 12 Equipotentials of anode图3 阳极的等温度图Fig13 Is otherms of anode图4 电解质的等电位图Fig 14 Equipotentials of electrolyte图5 铝液的等电位图Fig 15 Equipotentials of aluminum353 第4期李 等:大型预焙铝电解槽电、热场的有限元计算 从图中可以看出,阳极底部的温度为954℃,阳极上部的温度为546℃,导杆的温度为38℃;阳极部分的电压降(包括铝导杆、钢爪、阳极碳块和钢碳接触压降)为358mV ,电解质的电压降为1331mV ,铝液的电压降为5mV.其结果与该电解槽的设计值[13](阳极电压降:33814mV ;电解质电压降:1334mV )相差不大,所以验证了该模型的正确性.图6为电解质的垂直电流密度分布图.可以看出因为电解质熔体的电阻比较大,所以在阳极投影下边电解质中的电流密度基本一致,为016564A ・cm -2.阳极侧面电解质的电流密度比较小,并随着到阳极边缘的距离增加而迅速减少.图7为铝液中的水平电流密度分布图.可以看出在铝液中存在较大的水平电流,在与槽膛内形相接的地方达到最大值016806A ・cm -2.图6 电解质的垂直电流密度分布图Fig 16 Vertical current density distribution of electrolyte图7 铝液中的水平电流密度分布图Fig 17 H orizontal current density distribution of aluminum4 结论从上述分析可以看出,该模型的有限元计算结果与设计值吻合较好,较真实地反应了铝电解槽内阳极和熔体的电、热状况.利用该模型可以为现行电解槽的优化设计和改造以及新型电解槽的开发提供依据.主要在于:①计算指定电解槽参数下,阳极的电压降、温度分布以及热平衡;电解质和铝液的电压降和电流分布状况,并综合其他因素分析参数的选取是否合理;②分析电解槽技术经济指标和结构参数的改变对阳极、电解质、铝液电热状况的影响,以此来寻求最优的参数设计;③为铝电解槽其他物理场的计算提供重要的数据源,是铝电解槽的全息仿真与优化的重要组成部分.[参 考 文 献][1] Marc Dupuis.C omputation of aluminum reduction cellenergy balance using ANSY S finite element m odels [J ].Light Metals ,1998,409-417.[2] K aseb S ,Ahmed H A ,et al.Thermal behavior of prebakedaluminum reduction cells :M odeling and experimental analy 2sis [J ].Light Metals ,1997,395-401.[3] Z oric J ,R ousar I ,Thonstad J.Mathematical m odelling ofcurrent distribution and anode shape in industrial aluminum cells with prebaked anodes [J ].Light Metals ,1997,449-456.[4] Dupuis M ,T absh I.Therm o 2electric coupled field analysisof aluminum reduction cells using the ANSY S parametric design language [A ].Proceeding of the ANSY S Fifth International C on ference ,1991(3):1780-1792.[5] 梅炽,汤洪清,孟柏庭.铝电解槽电、热解析数学模型及数学仿真试验[J ].中南工业大学学报,1986,6(12):29-37.[6] 梅炽,王前普,等.有色冶金窑炉仿真与优化[J ].中国有色金属学报,1996,6(4):19-23.[7] 梅炽,游旺,王前普,等.铝电解槽槽膛内形在线显示仿真软件的研究与开发[J ].中南工业大学学报,1997,28(2):138-141.[8] 游旺,王前普,等.铝电解槽槽膛内形在线动态仿真理论研究[J ].中国有色金属学报,1998,8(4):695-699.[9] 梅炽.有色冶金炉设计手册[M].北京:冶金工业出版社,2000.[10] 梅炽,王前普.铝电解槽热场研究[J ].轻金属,1992(1):29-32.[11] 李景江,邱竹贤.工业铝电解槽内衬材料的导热系数[J ].轻金属,1987(11):20-25.[12] 王国强.实用工程数值模拟技术及其在ANSY S 上的实践[M].西安:西北工业大学出版社,2001.[13] 殷恩生.160kA 中心下料预焙铝电解槽生产工艺及管理[M].长沙:中南工业大学出版社,1997.453计 算 物 理第20卷 Numerical Simulation of Current and Temperature Fieldsof Aluminum R eduction Cells B ased on ANSYSLI Jie 1, CHE NG Y ing 2jun 1, LAI Y an 2qing 1, ZH OU Nai 2jun2(1.School o f Metallurgical Science and Engineering ,Central South Univer sity ,Changsha 410083,China ;2.School o f Energy and Power Engineering ,Central South Univer sity ,Changsha 410083,China )Abstract : Finite element equations to calculate current and temperature fields of aluminum reduction cells are deduced using G alerkin meth 2od.The finite element m odel of anode and m olten electrolyte is built according to multiple elements and multiple properties of ANSY S s oftware.With reas onable assumption of boundary conditions ,the current and temperature fields of 160K A prebaked reduction cells are computed and the temperature ,v oltage and electric current distributions of the cells are analyzed.The simulation results of the m odel well coincide with the design data ,and therefore provide foundations for optimizing current aluminum electrolysis cells and developing new type cells.K ey w ords : electrolysis cell ;current field ;temperature field ;finite element ;ANSY SR eceived d ate : 2002-06-07;R evised d ate : 2002-12-05553 第4期李 等:大型预焙铝电解槽电、热场的有限元计算。
Solar Energy Materials&Solar Cells74(2002)65–70Ni/Cu metallization for low-cost high-efficiencyPERC cellsE.J.Lee*,D.S.Kim,S.H.LeeNational Research Laboratory for Si Photovoltaics,Corporate R&D Center,Samsung SDI Co.Ltd.,P.O.Box111,Suwon,440-600,South KoreaAbstractLow-cost metallization process with excellent performance for high-efficiency passivated emitter and rear cell(PERC)is described.The fabrication processes of the high-efficiency silicon solar cell are too expensive and complicated to be commercialized widely.It is necessary to develop inexpensive metallization technique without degradation of the cell performance.In this paper,Ni/Cu contact system was used to fabricate low-cost high-efficiency solar cells instead of traditional solution that are based on evaporated Ti/Pd/Ag. The electroless plated Ni is utilized as the contact to silicon and the electroplated Cu served as the primary conductor layer.This metallization scheme has proven to be successful.r2002 Elsevier Science B.V.All rights reserved.Keywords:Metallization;Electroless plated Ni;Electroplated Cu;Contact;Solar cell1.IntroductionEvaporated Ti/Pd/Ag contact system is most widely used to make the high-efficiency silicon solar cells.However,the system is not cost effective due to expensive materials and vacuum techniques.It is necessary to develop inexpensive metallization technique without degradation of the cell performance.Electroless plated Ni/electroplated Cu metallization of silicon solar cells offers a relatively inexpensive method of making electrical contact.*Corresponding author.Present address:Frontier Technology Development Team,Corporate R&D Center,Samsung SDI Co.Ltd.,428-5,Gongse-Ri,Kiheung-Eup,Yongin-City,Kyonggi-Do,449-902, South Korea.0927-0248/02/$-see front matter r2002Elsevier Science B.V.All rights reserved.PII:S0927-0248(02)00049-1The contact system of silicon solar cell must have several properties,such as low contact resistance,easy application and good adhesion.Ni is shown to be a suitable barrier to Cu diffusion as well as desirable contact metal to silicon.Nickel silicide can be accomplished at low temperature (400–6001C),which provides the desired contact mechanical adherence and low contact resistance.The resistivity of NiSi thin films has been reported to be 14mO cm which is a comparable value to that of TiSi 2(13–16mO cm)[1,2].Electroless plating is based on chemical reduction reactions and does not require an external potential.The substrate is simply immersed into a plating solution containing reducing agents and metal ions.Electroless plated Ni contact of silicon solar cells offers a relatively inexpensive method of making electrical contact with the surface of silicon.In the case of electroless Ni plating on silicon,the adhesion is dependent upon the surface morphology of the silicon surface and mechanical properties of the plated nickel.In electroless plating,which is fully chemical process,there are many parameters that affect the deposition characteristics and plating rate.Parameters,such as pH,temperature,and concentration should be optimized to control the plating process.As a primary conductor,Cu was electroplated on the electroless plated Ni layer.The electroplating technique is a preferred method for commercial solar cell fabrication because it is a low-temperature process with high growth rates and reasonable method for mass production.In many structures of the high-efficiency silicon solar cells,the passivated emitter and rear cell (PERC)structure is a well-known cell concept that combines a fairly simple process sequence with high efficiencies.The PERC structure is to use the method of contacting the rear of cell by a large number of contact holes through a passivating oxide layer.The well-passivated surfaces and high bulk life times contribute to the high open circuit voltage (V oc )and short circuit current (J sc )[3].Fig.1shows schematic diagram of the conventional Ti/Pd/Ag contact system and new electroless plated Ni/electroplated Cu contact system for low-cost PERCcell.Fig.1.Schematic diagram of the conventional Ti/Pd/Ag contact system and new electroless plated Ni/electroplated Cu contact system for PERC cell.E.J.Lee et al./Solar Energy Materials &Solar Cells 74(2002)65–70662.ExperimentalNi/Cu contact system was applied for front metallization process of PERC cell.Solar cells were fabricated on0.5O cm,p-type,(100),500m m thick FZ silicon wafers.The major steps in fabricating the PERC cells began by forming inverted pyramids.After forming inverted pyramids on top surface,a masking oxide was grown.First,stripes were etched in this oxide where the metal–silicon contact was to be made.These regions were given quite a heavy phosphorus diffusion.Next, lighter phosphorous diffusion was performed to form selective emitter on an active area defined by silicon oxide.After phosphorous diffusion for emitter,the passivating oxide was grown.The local contact holes at the rear side are generated by defining by a photomasking step and etching SiO2.These contact holes were of 200m m diameter on a2mmÂ2mm matrix.This is followed by the vacuum evaporation of metal onto the entire rear surface.The front metal grid is defined by aligned photolithography.Before electroless Ni plating,the patterned wafers were dipped in HF solution and rinsed in deionized water in order to remove the silicon oxide on the surface.Ni was electroless plated on the front grid pattern.After Ni electroless plating,the cells were annealed by tube furnace at4001C to allow formation of a nickel silicide. Cu was electroplated on the Ni layer using light induced plating method.Cu electroplating solution was made up with commercially available acid sulfate bath and additives to reduce the stress of the copper layer.Contact resistance of nickel silicide on a n+Si layer for a PERC cell was measured using the transmission line model(TLM)method.Test samples were prepared by electroless plated Ni on single crystal silicon substrate.Before electroless plating,the wafers were dipped in HF solution and rinsed in deionized water in order to remove the surface native oxide.3.ResultsSurface morphology of the PERC cell with Ni/Cu contact system is shown in Fig.2(a)shows electroless plated Ni layer on the front grid pattern and Fig.2(b) shows electroplated Cufilm on the Ni layer.Ni was electroless plated on the activated silicon surface.The Ni plating solution is composed of a mixture of NiCl2as the main nickel source,NaH2PO2as the reducing agent,and(NH4)3C6H5O7as a buffer and a mild complexing agent for nickel.The nickel plating process is based on a catalytic oxidation–reduction reaction between nickel and hypophosphite ions.The chemical reaction can be viewed as the sum of two steps which occur simultaneouslyH2POÀ2þH2O-HPO2À3þ2HþþHÀ;2HÀþNi2þ-NiþH2;2H2POÀ2þ2H2OþNi2þ-NiþH2þ4Hþþ2HPO2À3:E.J.Lee et al./Solar Energy Materials&Solar Cells74(2002)65–7067Hydride ions (H À)are produced at the catalytic surfaces via the dehydration of the hypophosphite (HPO 32À).These surface hydride ions then react with the nickel ions (Ni +)in solution reducing them to neutral nickel atoms bonded to the surface.As in Fig.2(a),Ni was electroplated on the patterned Si substrate only.Then Cu was electroplated on the electroless plated Ni layer [Fig.2(b)].Performance of solar cell with Ni/Cu contact system were investigated by monitoring solar cell parameters as revealed by measurement of light I 2V curves (Fig.3).Cell parameters of the PERC cell with Ni/Cu contact system are V oc ¼664:4mV,J sc ¼38:1mA/cm 2,fill factor (FF)=79.8%,and efficiency (E ff )=20.19%.The series resistance (R s )of the cell with Ni/Cu contact system is 0.16O and the cell with Ti/Pd/Ag is 0.15O .As seen from the Fig.3,Ni/Cu contact system is equivalent to the conventional Ti/Pd/Ag contact system.The TLM is commonly used to model the planar metal–semiconductor contact,allowing important contact parameters such as contact resistance R c (O ),specific contact resistivity r c (O cm 2)and the semiconductor sheet resistance beneath the contact R s (O /&).The transmission line consists of three sets of resistors representing the metal,diffusion,and interfacial layers of a contact [4,5].The contact resistance between NiSi and n +Si can be extrapolated by the formulaR T ¼r c d =z þ2R c ;where R T is the total resistance,and R c is the contact resistance.The total resistance is measured for various contact spacings d and R T is plotted as function of d :The intercept at d ¼0is R T ¼2R c giving the contact resistance.Ni films were electroless plated on the silicon substrate to prepare test structure.Contact resistance of Cu/Ni/Si and Ag/Pd/Ti/Si were measured by the TLM method (Fig.4).Contact resistivity of Cu/Ni/Si system was characterized to be 3.5Â10À5O cm 2which is even lower than that of Ag/Pd/Ti/Si system (7.3Â10À5O cm 2).A contactresistivityFig.2.SEM images of the Ni/Cu contact system for solar cell.(a)Electroless plated Ni layer and (b)electroplated Cu film on the Ni layer.E.J.Lee et al./Solar Energy Materials &Solar Cells 74(2002)65–7068o 1Â10À3O cm 2was found to give sufficiently low power loss for one sun applications [6].It was found that NiSi was suitable for high-efficiency solar cell application.In this work,the contact resistance of NiSi and the device performance of solar cell using Ni/Cu contact system were investigated.Contact resistivity of Ni/Cu system was measured even lower than that of Ti/Pd/Ag system without degradation (b)Voltage (Volts)C u r r e n t (A m p s )(a)Voltage (Volts)C u r r e n t (A m p s )Fig.3.Light I 2V curves of a solar cell.(a)Electroless plated Ni/electroplated Cu contact system and (b)Ti/Pd/Ag contact system.E.J.Lee et al./Solar Energy Materials &Solar Cells 74(2002)65–7069of the cell performance.Electroless plated Ni/electroplated Cu metallization scheme has proven to be successful.This metallization scheme is an important process in the direction of cost reduction for solar cells of high efficiency.AcknowledgementsThis work was supported by the National Research Laboratory Project of Korean Ministry of Science and Technology under Contract No.2000-N-NL-01-C-090.References[1]S.P.Murarka,Silicides for VLSI Applications,Academic Press,New York,1983.[2]Yaozhi Hu,Sing Pin Tay,Spectroscopic ellipsometry investigation of nickel silicide formation by rapidthermal process,J.Vac.Sci.Technol.A 16(3)(1998)1820.[3]A.W.Blaker,Aihua Wang,ne,Jianhua Zhao,M.A.Green,22.8%efficient silion solar cell,Appl.Phys.Lett.55(13)(1989)1363.[4]G.K.Reeves,H.B.Harrison,Obtaining the specific contact resistance from transmission line modelmeasurements,IEEE Electron Device Lett.EDL-3(5)(1982)111.[5]D.K.Schroder,D.L.Meier,Solar cell contact resistance—a review,IEEE Trans.Electron Dev.ED31(5)(1984)637.[6]H.H.Berger,Models for contacts to planar devices,Solid State Electron.15(1972)145.024681012200406080100Distance between pads [µm]T o t a l r e s i s t a n c e [O h m ]Fig.4.Total resistance measurement of Cu/Ni/Si and Ag/Pd/Ti/Si contact.E.J.Lee et al./Solar Energy Materials &Solar Cells 74(2002)65–7070。