18-同位素地球化学知识讲解
- 格式:ppt
- 大小:2.27 MB
- 文档页数:48
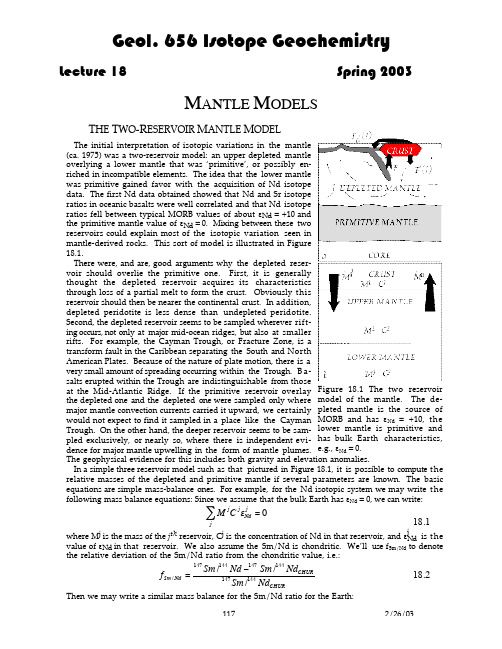
M ANTLE M ODELST HE T WO -R ESERVOIR M ANTLE M ODELThe initial interpretation of isotopic variations in the mantle(ca. 1975) was a two-reservoir model: an upper depleted mantleoverlying a lower mantle that was ‘primitive’, or possibly en-riched in incompatible elements. The idea that the lower mantlewas primitive gained favor with the acquisition of Nd isotopedata. The first Nd data obtained showed that Nd and Sr isotoperatios in oceanic basalts were well correlated and that Nd isotoperatios fell between typical MORB values of about e Nd = +10 andthe primitive mantle value of e Nd = 0. Mixing between these tworeservoirs could explain most of the isotopic variation seen inmantle-derived rocks. This sort of model is illustrated in Figure18.1.There were, and are, good arguments why the depleted reser-voir should overlie the primitive one. First, it is generallythought the depleted reservoir acquires its characteristicsthrough loss of a partial melt to form the crust. Obviously thisreservoir should then be nearer the continental crust. In addition,depleted peridotite is less dense than undepleted peridotite.Second, the depleted reservoir seems to be sampled wherever rift-ing occurs, not only at major mid-ocean ridges, but also at smallerrifts. For example, the Cayman Trough, or Fracture Zone, is atransform fault in the Caribbean separating the South and NorthAmerican Plates. Because of the nature of plate motion, there is avery small amount of spreading occurring within the Trough. B a -salts erupted within the Trough are indistinguishable from thoseat the Mid-Atlantic Ridge. If the primitive reservoir overlay the depleted one and the depleted one were sampled only where major mantle convection currents carried it upward, we certainly would not expect to find it sampled in a place like the Cayman Trough. On the other hand, the deeper reservoir seems to be sam-pled exclusively, or nearly so, where there is independent evi-dence for major mantle upwelling in the form of mantle plumes.The geophysical evidence for this includes both gravity and elevation anomalies.In a simple three reservoir model such as that pictured in Figure 18.1, it is possible to compute the relative masses of the depleted and primitive mantle if several parameters are known. The basic equations are simple mass-balance ones. For example, for the Nd isotopic system we may write the following mass balance equations: Since we assume that the bulk Earth has e Nd = 0, we can write:Mj C j e Nd j =0j Â18.1where M j is the mass of the j th reservoir, C j is the concentration of Nd in that reservoir, and e j Nd is thevalue of e Nd in that reservoir. We also assume the Sm/Nd is chondritic. We’ll use f Sm/Nd to denote the relative deviation of the Sm/Nd ratio from the chondritic value, i.e.:f Sm /Nd =147Sm /144Nd -147Sm /144Nd CHUR147Sm /144Nd CHUR18.2Then we may write a similar mass balance for the Sm/Nd ratio for the Earth:Figure 18.1 The two reservoir model of the mantle. The de-pleted mantle is the source of MORB and has e Nd = +10, the lower mantle is primitive and has bulk Earth characteristics,e.g., e Nd = 0.Mj C j f Sm /Nd j =0j Â18.3The mass balance for the Nd concentration is:Mj C Nd j =M o C Nd o j Â18.4where M o is the mass of the silicate Earth and C oNd in the concentration of Nd in the silicate Earth.Finally, the masses of our three reservoirs must sum to the mass of the silicate Earth:Mj =M o j Â18.5The first equation simply states that the bulk-earth e Nd = 0, the second that the Sm/Nd ratio is equal to the chondritic one, the third is the mass balance equation for Nd concentration (C Nd ), the fourth states that the masses of the three reservoirs must equal the total mass of the silicate earth (denoted by the superscript 0). We have implicitly assumed there is no Nd or Sm in the core. Assuming t h a t the crust has grown from primitive mantle, then *e Nd c =f Sm /Nd c QT c 18.6where T C is the average age of the crust. If the Earth consists of only three reservoirs for Nd, namely the continental crust, depleted mantle, and primitive mantle, and if the depleted mantle and crust evolved from a reservoir initially identical to ‘primitive mantle’ then the mass balance equations 18.1, 18.3, and 18.4 must hold for crust and depleted mantle alone. In this case, equations 18.1, 18.4and 18.6 can be combined to derived a relationship between the mass of the crust and the mass of the depleted mantle:M dm M c =C Nd c C Nd o -1Ê Ë Á ˆ ¯ ˜ -C Nd c C Nd o Ê Ë Á ˆ ¯ ˜ f Sm /Nd c QT ce Nd dm 18.7Thus the mass ratio of depleted mantle to crust can be calculated if we know the Sm/Nd ratio of the crust, the e Nd of the depleted mantle, and the concentration of Nd in the crust and in primitive man-tle. Figure 18.2 shows a plot that shows the solutions of 18.7 as a function of T C for various values of e dm obtained by DePaolo (1980). Most estimates of the average age of the crust are between 2 and 2.5Ga, and e dm is about +10. Possible solutions for the ratio of depleted mantle to whole mantle are in the range of 0.3 to 0.5. A number of such mass balance calculations that included other isotopic sys-tems as well were published between 1979 and 1980, all of which obtained rather similar results. In-terestingly, the fraction of the mantle above the 650 km seismic discontinuity is roughly 0.33. The mass balance calculations suggested the seismic discontinuity was the chemical boundary between upper and lower mantle.* A note on notation:The growth equation for 143Nd/144Nd is:143Nd/144Nd = 143Nd/144N d 0 + 147Sm/144Nd(e l t – 1)Since the half-live of 147Sm is long compared to the age of the Earth, we may use the approximation:e l t ≈ l t + 1and hence:143Nd/144Nd = 143Nd/144Nd i + 147Sm/144Nd l tThe equation may be transformed into epsilon notation, in which case it becomes:e Nd @e Nd i+Q Nd f Sm /Nd twhere e iNd is the initial value of e Nd (i.e., at t = 0), and Q are defined as:Q Nd=104l 147Sm /144Nd CHUR 143Nd /144Nd CHURQ Nd is a constant with a value of 25.13 Ga -1.This simple model of the mantle began to unravelas additional Nd isotopic data were acquired. Inparticular, it is now clear that the Sr and Nd isotopedata do not form a simple linear array, and that thee Nd = 0 point is not the minimum value observed in ba-salts (Figure 16.1). It is apparent then that thevariation observed in Sr and Nd isotope ratios is notsimply a result of mixing between depleted andprimitive mantle, and that reservoirs with time-in-tegrated LRE enrichment must exist in the mantle.Furthermore, Pb isotopic data never had been consis-tent with such a model. Many investigators had ig-nored the Pb isotope system because they felt it mayhave been disturbed by loss of Pb to the core.Mixing Lines on Isotope Ratio PlotsBefore going further, it should be pointed out thatscatter of the data from a linear array does not pre-clude a two-component model. This is because mixinglines on a plot of one isotope ratio against the an-other need not be straight. Indeed in the general casewhere one ratio is plotted against another, mixinglines will be curved. The degree of curvature is de-pendent of the ratio r :r =X 2/Y 2X 1/Y 118.8where X and Y are the denominators of the two ratios and subscripts 1 and 2 denote the two end mem-bers. The more this r deviates from 1, the higher the curvature of the mixing line. In the specific case of isotope ratios, the denominators are non-radiogenic isotopes whose abundance is essentially pro-portional to the abundance of the element. So for Sr and Nd isotope ratios in a mixture of components 1 and 2, the mixing line has a curvature given by:r =Sr 2/Nd 2Sr 1/Nd 118.9where Sr 1 is the concentration of Sr in component 1, etc. Only in the case where the Sr/Nd concentra-tion ratios are the same will the line be straight (r=1).Thus the scatter observed in Figure 16.3 could be due to variable Sr/Nd ratios. However, we must ask whether it is reasonable that the reservoirs could have variable Sr/Nd ratios but constant and uniform Sr and Nd isotopic compositions? The answer would seem to be no.M ULTI -R ESERVOIR M ANTLE M ODELSDePaolo and Wasserburg (1976) termed the linear correlation originally observed between Sr and Nd isotope ratios the "mantle array". Even though it is now clear that mantle does not always plot on the “mantle array”, the term has survived, and is useful for reference. In the subsequent discussion,we will use “mantle array” to refer to those data that plot close to a line passing through 143Nd/144Nd = 0.51315 (e Nd = +10) and 87Sr/86Sr = 0.7025 (typical depleted mantle) and 143Nd/144Nd = 0.51264 (e Nd =+0) and 87Sr/86Sr = 0.705 (hypothetical primitive mantle).If we consider where individual oceanic islands or island chains plot on various isotope ratio plots,we can see that there are some systematic features. For example, several islands, including St. He-lena Island in the Atlantic and the Austral Chain in the Pacific, plot slightly below the Sr-Nd man-tle array with87Sr/86Sr about 0.7029, only slightly higher than MORB. Basalts from these same is-Figure 18.2 The relationship between ratio of mass of the depleted mantle to mass of the continental crust as a function of mean age of the crust calculated from equation 18.6 using various values of e Nd for the depleted mantle.The arrows at the bottom enclose the range of probable values for the mean age of the crust.lands also plot below the Hf-Nd isotope correlation. In addition, they have remarkably radiogenic Pb, with 206Pb/204Pb > 20. Following this kind of procedure, I found that oceanic basalts fall into 5 or so groups (White, 1985). It is reasonable to suppose that this reflects the existence of 5 reservoirs, or perhaps more accurately, 5 types of reservoirs within the mantle. Although this need not necessarily be the case, the idea has been accepted as a sort of working hypothesis by mantle geochemists (al-though it is unclear exactly how many classes there are, some prefer 4 or 6).The next question to ask is what processes have lead to the distinct identities of these reservoirs.For the MORB reservoir, this question is relatively easy to answer: removal of a partial melt ac-counts for the principal isotopic characteristics. Two of the reservoirs types, called Kerguelen and Society by White (1985) but subsequently termed EM I and EM II (‘enriched mantles 1 and 2’) by Zin-dler and Hart (1986), have some characteristics of continental crust and sediment, and hence it is sus-pected that recycling of crustal material, via subduction, has been the principal process in the evolu-tion of these reservoirs. It is not clear, however, why recycling should lead to two apparently dis-tinct reservoirs. Numerous authors have suggested the St. Helena reservoir type,whose most distinc-Figure 18.3. Five reservoir types of White (1985) and the components of Zindler andHart (1986). They are essentially identical, except for Hawaii and PREMA (prevalentmantle). Other Zindler and Hart acronyms stand for high-µ (HIMU), enriched mantleI and II (EM I and EM II), and depleted MORB mantle (DMM). The main difference ininterpretation is that whereas White argued that each reservoir type many consist ofmany reservoirs, but all had evolved through similar processes, Zindler and Hart(1986) argued that five distinct reservoirs exist, and that variations in isotope ratiosresult from mixing of these reservoirs.tive characteristic is high Pb isotope ratios, and which Zindler and Hart (1986) called HIMU (for high-µ), has acquired its distinctive isotopic characteristics through recycling of the oceanic crust. The basis for this argument is the effects of ridge-crest hydrothermal activity, which apparently removes Pb from the oceanic crust, but transfers seawater U (which is ultimately of continental crustal derivation) to the oceanic crust, effectively increasing its µ. For the most part, it must be admitted that we do not yet understand the evolution of the OIB source reservoirs. It does seem, however, t h a t a number of processes have operated over geologic time to produce reservoirs in the mantle that are distinct from both depleted mantle and primitive mantle. The reservoir types of White (1985) and components of Zindler and Hart (1986) are shown in Figures 18.3 and 18.4.We should note that the existence of multiple reservoirs in the mantle does not necessarily invali-date the mass balance models discussed above if the mass of the various OIB reservoirs is insignifi-cant. Since the volume of OIB is small compared to MORB, this is certainly a possibility. However, these mass balance models also neglect the mass of the continental lithosphere, significant parts of which appear highly incompatible element enriched.Figure 18.4. Five reservoir types of White (1985) and the components of Zindler and Hart (1986)in a plot of e Nd vs. 87Sr/86Sr.O PEN S YSTEM M ODELS OF M ANTLE E VOLUTIONA radically different view of the mantle has been taken in papers by Galer and O’Nions (1985) and White (1993). The models we have discussed thus far assume that isotope ratios in mantle reservoirs reflect the time-integrated values of parent-daughter ratios in those reservoirs. Indeed, we devoted some time to the concept of time-integrated parent-daughter ratios in Lecture 16. Wasn’t this, after all, what Gast said, that (among other things) an isotope ratios reflects the time-integrated parent-daughter ratio?Indeed, what did Gast say? He said “The isotopic composition of a particular sample of stron-tium... may be the result of time spent in a number of such environments. In any case, the isotopic com-position is the time-integrated result of the Rb/Sr ratios in all past such environments.” If for exam-ple, a sample of Sr from the depleted upper mantle (we’ll adopt the acronym DUM * for this reser-voir) had spent the past 4.55 Ga in that reservoir, its isotopic composition should indeed reflect the time-integrated Rb/Sr in that reservoir. But suppose that sample of Sr had spend only the last few hundred million years in the DUM? Its isotopic composition will be more of a reflection of the Rb/Sr ratios in the previous environments than in DUM. This is exactly the point made by Galer and O’Nions.We have seen in previous lectures that the time integrated Th/U ratio is recorded by the 208Pb*/206Pb* ratio. Galer and O’Nions (1985) found that the average 208Pb*/206Pb* in MORB corre-sponded to a time-integrated Th/U ratio of about 3.75. The chondritic Th/U ratio, according to sev-eral compilations, is about 3.9. Since Th and U are both highly refractory elements, this should be the ratio of the bulk earth as well. The present-day Th/U ratio of the mantle source of a basalt can be deduced from Th isotope systematics, as we have seen. According to the compilation made by Galer and O’Nions, the Th/U ratio in DUM, based on Th isotope ratios in MORB, is about 2.5. That the present ratio is lower than the chondritic one makes perfect sense because Th is more incompatiblethan U, so we would expect thisratio to be low in DUM. Assumingthe upper mantle started out witha chondritic Th/U ratio of 3.9 a t4.55 Ga, and has decreasedthrough time to 2.5, the time-integrated ratio should be some-where in between these two val-ues. Indeed, it is. However, thetime-integrated value of 3.75 issurprisingly close to the initialvalue. This would imply in a sim-ple evolutionary model of themantle that the depletion in Threlative to U must have occurredrelatively recently. Indeed, as il-lustrated in Figure 18.5, this de-pletion must have occurred only 600 Ma ago. This is a surprising re-sult, and one that is inconsistent with other evidence. For example,Nd isotope ratios in ancient man-tle-derived volcanic rocks suggests depletion of the upper mantle be-* You may get the impression that to really succeed in mantle isotope geochemistry you need to be good at thinking upacronyms. As near as I can tell, this is true. This acronym is due to Claude Allegre.Figure 18.5. Evolution of 208Pb*/206Pb* is a system with Th/U =2.5 assuming a starting Th/U of 3.9. k – Pb is the time-integrated value of k . Lines indicate various values of µ ranging from 4 to 16. Histogram on the right shows the values of k – Pb in parison of these values with the evolution lines suggests a residence time for Pb in the upper mantle of 600 ±200 Ma. From Galer and O’Nions (1985).gan early in Earth’s history, as we shall see. Furthermore, the average age of the continental crust appears to be about 2-2.5 Ga. If the depleted mantle is the complimentary reservoir to the continen-tal crust, time-integrated parent-daughter ratios should indicate a depletion age of about 2-2.5 Ga. Galer and O’Nions (1985) concluded that something was very wrong with conventional views of the mantle. They suggested that Pb now in the upper mantle had not resided there for long, that it was ultimately derived from a lower mantle reservoir that had a primitive (i.e., chondritic) Th/U ratio. In other words, the upper mantle had not evolved simply by losing melt fractions to the continental crust, but was a completely open system, with fluxes into it as well as out of it. The argued that the apparent depletion time of 600 Ma was in reality simply the residence time‡ of Pb in the upper man-tle.Subsequently, most geochemists would now agree that the Th/U ratio for the bulk Earth is higher than 3.9, probably in the range of 4.0 to 4.2 (but perhaps as high as 4.3). However, additional Th iso-tope data on MORB indicates a lower present-day k for the depleted mantle than estimated by Galer and O’Nions in 1985 (2.3 vs. 2.5), so the dilemma posed by Galer and O’Nions remains.I (White, 1993) found that a similar problem arose with U/Pb ratios and came to similar conclu-sions as those of Galer and O’Nions. As we have seen, Pb isotope ratios in MORB rather surprisingly record a time-integrated value of µ that is higher than the bulk earth ratio (because they plot to the right of the geochron). However, I concluded from several lines of evidence that present value of µ in the upper mantle must be lower than bulk Earth. One of these lines of evidence involves solving a mass balance equation for the crust and upper mantle for U, Th, Pb and Ce. As we have seen, Pb is a volatile element, so its concentration in the bulk earth is not a priori known. It turns out, however, that the Pb/Ce ratio in MORB is constant. Since the other three elements are refractory, their con-centrations in the bulk Earth can be assumed to be chondritic, the following relation can then derived: mDM=18.10where M BSE = M C + M DM, and the subscripts DM, C, and BSE denote depleted mantle, continental crust, and bulk silicate Earth respectively. The constant arises from terms for the fractional abundance of 204Pb and conversion from ppm to molar units. When reasonable estimates for the various parameters are substituted into the right hand side of 18.10, one derives a value for µDM of 6 or less, whereas the best estimates for bulk silicate earth are around 8.Thus the depleted mantle does appear to have a µ that is lower than bulk Earth, just as we would expect. But this low ratio has not been recorded by Pb isotope ratios. The obvious conclusion is that Pb in MORB could not have be present in the depleted mantle, and that it must be some flux of Pb to the upper mantle as well as out of it. I found that Pb isotope systematics were not consistent with this Pb being derived from some primitive mantle reservoir, as suggested by Galer and O’Nions. Using Galer and O’Nions estimate of the residence time of Pb in the upper mantle, I calculated the necessary flux using equation 18.11. It turns out that this flux can easily be supplied by mantle plumes, which clearly penetrate the upper mantle, and as we shall see, mix with it. Thus it appears to be mantle plumes that supply Pb, and probably other highly incompatible elements to the upper mantle, per-haps maintaining their concentrations in near steady-state. Figure 18.6 is a box model and schematic that illustrates some of the possible important fluxes through the mantle.‡Residence time of some element i in a reservoir is defined as:t=CiMi¶i18.11where t is the residence time, C i is the concentration of element i in the reservoir, M i is the mass i in the reservoir, and ƒi is the flux of i into or out of the reservoir. The residence time of Pb in the depleted mantle is the average time an atom of Pb will spend there between entering and leaving.Figure 18.6. Box Model and corresponding schematic Earth illustrating the flow of U, Th and Pb through the Earth. Oceanic crust is created at mid-ocean ridges by partial melting of the de-pleted mantle. Th and U are partitioned into the melt to a greater extent than Pb. Hydrother-mal exchange removes Pb from the oceanic crust, depositing it in sediment, and also deposits seawater U in the oceanic crust, resulting in an oceanic crust with a high µ. Some U, Th, and Pb are removed from the oceanic crust in subduction zones, but most remains and sinks to the bound-ary layer below the depleted mantle. Most marine sediment, which has a low µ, is accreted to continents or purged of U, Th and Pb in subduction zones. New continental crust, consisting of ac-creted sediment and juvenile island arc magma, has a low µ, but intracrustal differentiation produces an upper crust of high µ. Plumes form from the boundary layer of high-µ subducted oceanic crust. They mix with the depleted mantle, resupplying the depleted mantle with in-compatible elements. Some flux of undegassed primitive mantle to the plume-source seems nec-essary to supply noble gases, but this has a trivial effect on the U-Th-Pb balance. The role of the subcontinental mantle lithosphere, as well as it’s Pb isotopic systematics, is uncertain. Size of the boxes does not correspond to the size of the reservoir.G EOGRAPHIC V ARIATION IN M ANTLE I SOTOPIC C OMPOSITIONAn interesting question is whether geographic variations in mantle chemistry can be identified on a larger scale that that of individual volcanic island chains. The answer turns out to be yes. The first such geographic variation observed was on the Mid-Atlantic Ridge. Sr and Pb isotope ratios in MORB were observed to decrease with distance from Iceland and the Azores. Figure 18.7 illustrates Sr isotopic variations along the Mid-Atlantic Ridge. These variations were interpreted as 'contam-ination' of the asthenosphere by the Azores and Iceland mantle plumes. Somehow, the rising mantle plume mixes with asthenosphere through which it ascends, with the effect on isotopic compositions being noticeable up to 1000 km from the center of the plume. Similar effects have also been noted where even a ridge is located in proximity to a hot spot or mantle plume, including Easter Island, the Galapagos, and several of the islands in the South Atlantic and Indian Oceans.These geographic variations are, however, recently imposed features of mantle plume dynamics.The do not necessarily imply mantle geochemical provinces. Is there evidence for such provinces,comparable to say tectonic provinces of the continents? The answer is again yes. Perhaps the first such 'province' to be identified was the Indian Ocean geochemical province. Data published as early as the early 1970's suggested MORB from the Indian Ocean were distinct from those of the Pacific and the Atlantic, having higher 87Sr/86Sr ratios. However, the scarcity and poor quality of data on In-dian Ocean MORB left the issue in doubt for more than a decade. It was resolved with a flood of data on Indian Ocean MORB, beginning with a paper by Dupré and Allègre (1983). Dupré and Allègre found Indian Ocean MORB has higher 87Sr/86Sr ratios but lower 206Pb/204Pb ratios compared to MORB from other oceans. They also have high 207Pb/204Pb and 208Pb/204Pb ratios for a given value of 206Pb/204Pb than other MORB. This is illustrated in Figure 17.1. Furthermore, these characteristics seem to be shared by many of the oceanic islands in the Indian Ocean. Subsequent work showed Indian Ocean MORB have low 143Nd/144Nd as well.Hart (1984) noticed that oceanic basalts with high 207Pb/204Pb and 208Pb/204Pb ratios for a given value of 206Pb/204Pb come mainly from a belt centered at about 30° S. Hart named this feature the DUPAL anomaly (after Dupré and Allègre). He defined the DUPAL isotopic signature as having higher ∆Sr (∆Sr = [87Sr/86Sr – 0.7030] ¥ 104) and high ∆8/4 and ∆7/4. The value of ∆8/4 and ∆7/4 are percent deviations from what Hart defined as the Northern Hemisphere Regression Line, regression lines through the 208Pb/204Pb—206Pb/204Pb and 207Pb/204Pb —206Pb/204Pb arrays for northern hemisphere data:∆8/4 = [208Pb/204Pb – 208Pb/204Pb NHRL ] ¥ 10018.12∆7/4 = [207Pb/204Pb – 207Pb/204Pb NHRL ] ¥ 10018.13Figure 18.7. Variation of 87Sr/86Sr in MORB along the Mid-Atlantic Ridge. FromWhite et al. (1976).where 207Pb/204Pb NHRL = 15.627 + 1.209 207Pb/204Pb18.14and208Pb/204Pb NHRL = 13.491 + 0.1804 208Pb/204Pb 18.15Subsequently, Castillo (1989) suggested that Hart’s “DUPAL anomaly” actually consisted of two separate regions: the DUPAL in the Indian Ocean, and the “SOPITA” (South Pacific Isotope andThermal Anomaly) inthe South Pacific andpointed out they corre-spond to regions of slowmantle seismic veloci-ties, which in turn im-ply high mantle tem-peratures. Castillo’smap is shown in Figure18.8.Interestingly, theDUPAL characteristicis shared by both In-dian Ocean OIB andMORB, but this doesnot seem to be the casein the Atlantic and Pa-cific. The DUPAL sig-nature has not been ob-served in Atlantic or Pacific MORB, exceptin the immediate vicin-ity of the Tristan da Cunhamantle plume in the southAtlantic. An additionalquestion relates to samplingcoverage. Nearly two-thirds of oceanic island oc-cur in this belt, so it is notsurprising that a particularchemistry in often foundthere. Nevertheless, it isclear that there is some-thing anomalous about thisregion.The Galapagos Archi-pelago provides another re-cent example of geographicvariation of isotope compo-sition in the mantle. TheGalapagos provide an un-usually favorable opportu-nity for producing a geo-chemical map of the man-tle because they consist of 20 or so volcanoes t h a t have all been activeover Figure 18.8. Map showing the distribution of mantle plumes (triangles), P-wave velocity anomalies (m/sec) averaged over the whole lower mantle (red lines), and location of the DUPAL and SOPITA isotope anomalies (pale red regions). Mantle plumes are located in regions of slow lower mantle seismic velocities, implying high temperatures. After Castillo(1989).Figure 18.9. Contour map of e Nd variation in the mantle beneath the Galapagos. Contouring is based on average e Nd from 21 volcanos, whoselocations are shown by solid dots (Locations were corrected for plate motion since time of eruption).the past 2 or 3 million years. Combining Nd isotope ratio determined on basalts from these volcanoes as well as data from previous geochemical studies of the Galapagos Spreading Center (GSC) just to the north, White et al. (1993) produced the contour map of Nd isotope ratios shown in Figure 18.9.The contours reflect regional geochemical variations in the mantle below.The contouring reveals a horseshoe-shaped region around the western, northern, and southern pe-riphery of the archipelago in which low e Nd values occur, and a region in the center of the archipel-ago in which high e Nd values occur. The high e Nd values are more typical of MORB than of oceanic is-land basalts. This pattern was unexpected. From what was observed along the MAR (Figure 18.7),one might expect e Nd to decrease radially from the center of the archipelago.The pattern in the Galapagos may reflect the fluid dynamics of plume-asthenosphere boratory experiments have shown that a thermal plume (i.e., one that rises because it is thermal buoyant rather than chemically buoyant) will entrain surrounding asthenosphere if it is bent by as-thenospheric motion. This is because the surrounding asthenosphere is heated by the plume, as a re-sult, it also begins to rise. This interpretation is illustrated in a Figure 18.10.R EFERENCES AND S UGGESTIONS FOR F URTHER R EADINGCastillo, P. 1989. The Dupal anomaly as a trace of the upwelling lower mantle. Nature . 336: 667-670.Hart, S. R. 1984. The DUPAL anomaly: A large scale isotopic mantle anomaly in the Southern Hemi-sphere. Nature . 309: 753-757.Galer, S. J. G. and R. K. O'Nions, 1985. Residence time of thorium, uranium and lead in the mantle with implications for mantle convection., Nature , 316, 778-782.DePaolo, D. J. 1980. Crustal growth and mantle evolution: inferences from models of element transport and Nd and Sr isotopes. Geochim Cosmochim Acta . 44: 1185-1196.Wasserburg, G. J. and D. J. DePaolo. 1977. Models of earth structure inferred from neodymium and strontium isotopic abundances. Proc. Natl. Acad. Sci. USA . 76: 3594-3598.White, W. M., 1985. Sources of oceanic basalts: radiogenic isotope evidence, Geology , 13: 115-118.White, W. M., 1993 238U/204Pb in MORB and open system evolution of the depleted mantle, Earth Planet. Sci. Lett., 115, 211-226.White, W. M., A. R. McBirney and R. A. Duncan. 1993. Petrology and Geochemistry of the Galapa-gos: Portrait of a Pathological Mantle Plume. J. Geophys. Res. 93: 19533-19563.Figure 18.10. Cartoon illustrating the sheared plume model. Stippled pattern represents litho-sphere, cross-hatched pattern is original plume material, grayed patterned is asthenosphere,darker gray is thermally buoyant asthenosphere. a.) East-west cross section beneath the center of the archipelago, b.) North-south cross section at the longitude of Isabela.。


分馏系数分馏系数表示同位素的分馏程度,反映了两种物质或两种物相之间同位素相对富集或亏损程度。
在自然界,分馏系数是指两种矿物或两种物相之间的同位素比值之商。
其表达式为:□ A-B=RA/RB式中A和B表示两种物质(物相),R代表重同位素对轻同位素的比值,如18O/16O,13C/12C等。
□ 值偏离1愈大,说明两种物质之间的同位素分馏程度也就愈大;□=1时,物质间没有同位素分馏。
δ值稳定同位素组成常用δ值表示,δ值指样品中某元素的稳定同位素比值相对标准(标样)相应比值的千分偏差。
其公式为□δ值能清楚地反映同位素组成的变化,样品的δ值愈高,反映重同位素愈富集。
样品的δ值总是相对于某个标准而言的,同一个样品,对比的标准不同得出的δ值各异。
所以必须采用同一标准;或者将各实验室的数据换算成国际公认的统一标准,这样获得的δ值才有实际应用价值。
比较普遍的国际公认标准为:①SMOW,即标准平均海洋水,作为氢和氧的同位素的国际统一标准;② PDB,是美国南卡罗来纳州白垩系皮狄组地层内的似箭石,一种碳酸钙样品,用作碳同位素的国际统一标准,有时也作为沉积碳酸盐氧同位素的标准;③CDT,是美国亚利桑纳州迪亚布洛峡谷铁陨石中的陨硫铁,用作硫同位素的国际统一标准。
稳定同位素实验研究表明,大多数矿物对体系(矿物-矿物)或矿物-水体系,在有地质意义的温度范围内,103ln□ 值与T 2成反比,T为绝对温度。
103ln□ 值可以近似地用两种物质的δ差值表示,即δ-δB=ΔA-B≈103ln□A-B。
因此,只要测得样品的δ值,就可直接计算出103ln□值。
它同样表示物质间同位素分馏程度的大小,利用它可绘制同位素分馏曲线,拟合同位素分馏方程式和计算同位素平衡温度(见地质温度计)。
在稳定同位素地球化学研究中,H、C、O、S等研究较深入。
它们在天然物质中分布广泛,可形成多种化合物,由于它们的同位素质量数都比较小,相对质量差别大,因而同位素分馏更明显,这对确定地质体的成因及其物质来源和判明地质作用特征具有重要意义。


第五章同位素地球化学第一节基本概念与原理一、同位素的定义:核素:是由一定数量的质子(P)和中子(N)构成的原子核。
核素具有质量、电荷、能量、放射性和丰度5中主要性质。
元素:具有相同质子数和中子数的核素。
同位素:原子核内质子数相同而中子数不同的一类原子叫做同位素(isotope),他们处在周期表上的同一位置二、同位素的分类放射性同位素(radioactive isotope):原子核是不稳定的,它们能够自发地衰变成其他核素的同位素。
最终衰变为稳定的放射性成因同位素。
目前已知的放射性同位素达1200种左右,由于大部分放射性同位素的半衰期较短,目前已知自然界中存在的天然放射性同位素只有60种左右。
放射性同位素例子:238U→234Th+4He(α)+Q→ 206Pb;235U→ 207Pb;232Th→ 208Pb稳定同位素(stable isotope):原子核是稳定的,迄今还未发现它们能够自发衰变形成其他的同位素。
稳定同位素又可以分为轻稳定同位素和重稳定同位素。
轻稳定同位素,又称天然的稳定同位素,是核合成以来就保持稳定。
其特点是①原子量小,同—元素的各同位素间的相对质量差异较大;②轻稳定同位素变化主要原因是同位素分馏作用所造成的,其反应是可逆的。
如氢同位素(1H和2H)、氧同位素(16O和18O)、碳同位素(12C和13C)等。
重稳定同位素,又称放射成因同位素(radiogenic isotope):稳定同位素中部分是由放射性同位素通过衰变后形成的稳定产物。
其特点是①原子量大,同—元素的各同位素间的相对质量差异小(0.7%~1.2%)环境的物理和化学条件的变化通常不导致重稳定同位素组成改变;②重稳定同位素变化主要原因是放射性同位素衰败引起,这种变化是单向的不可逆的。
如87Sr是由放射性同位素87Rb衰变而来的;三、同位素的丰度的表示方法同位素丰度(isotope abundance) :可分为绝对丰度和相对丰度。
生物地球化学中的氧同位素氧同位素是氧原子核内所含的中子数不同而导致的同种元素的不同形态。
氧同位素主要有三种,分别是氧-16、氧-17和氧-18,其中氧-16占自然界中绝大部分的氧元素,占99.76%,氧-17和氧-18占剩下的0.24%。
在生物地球化学中,氧同位素主要应用于研究水、大气和生物界的循环过程,具有很广泛的应用前景。
氧同位素的分布氧同位素存在于大气层、海洋和陆地水体中的水分子中,同时还存在于生物体内的骨骼、齿齒、组织和营养物中。
氧同位素的分布与地理环境、生物区系、气象和地质过程密切相关。
对于自然界中的水分子,它们的氧同位素比值在不同的水体中是有差异的。
比如,冰雪中氧-18比例较高,而热带和亚热带降雨中氧-18比例偏低。
这是由于水分子的蒸发和降雨过程受到气温、大气压力、风向风速等因素的影响而导致的。
生物界中的氧同位素也表现出某些可观测规律。
例如,在不同海域中的浮游植物或浮游动物体内氧同位素组成的比值存在一定的差异,这是由于生物体内水分子的氧同位素组成差异而导致的。
氧同位素的应用氧同位素在地质、大气、海洋和生命科学等领域中都有广泛的应用。
地质领域研究氧同位素比率可以揭示出不同地质时期的环境变化,也可以对化石植物、矿物、沉积物等进行年代和来源的判别。
例如,有关地球历史上海洋水温度变化的研究表明,温度升高时海水中氧-18的比例将增加,而温度降低时氧-18的比例将降低。
因此,通过样品中氧同位素比率的变化可以反映出相对海洋表层温度的变化。
大气领域氧同位素可以用来追踪和识别大气中气体的来源和去向。
例如,通过大气中O2分子和CO2分子氧同位素的比率,可以识别出植物的光合作用贡献情况。
通过观测化石气泡等物料中的氧同位素,也可以重建太古时代的大气气候和气体成分的变化。
海洋领域氧同位素在海洋领域中有着丰富的应用前景。
例如,研究海洋沉积物中氧同位素比率的变化可以揭示出水文循环的变化、冰期和间冰期之间海平面变化的状况。