mahoupao_空冷器计算软件
- 格式:xls
- 大小:2.09 MB
- 文档页数:1
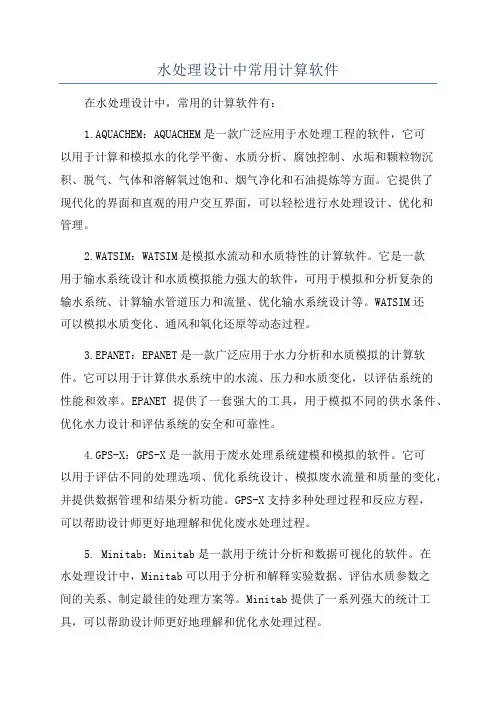
水处理设计中常用计算软件在水处理设计中,常用的计算软件有:1.AQUACHEM:AQUACHEM是一款广泛应用于水处理工程的软件,它可以用于计算和模拟水的化学平衡、水质分析、腐蚀控制、水垢和颗粒物沉积、脱气、气体和溶解氧过饱和、烟气净化和石油提炼等方面。
它提供了现代化的界面和直观的用户交互界面,可以轻松进行水处理设计、优化和管理。
2.WATSIM:WATSIM是模拟水流动和水质特性的计算软件。
它是一款用于输水系统设计和水质模拟能力强大的软件,可用于模拟和分析复杂的输水系统、计算输水管道压力和流量、优化输水系统设计等。
WATSIM还可以模拟水质变化、通风和氧化还原等动态过程。
3.EPANET:EPANET是一款广泛应用于水力分析和水质模拟的计算软件。
它可以用于计算供水系统中的水流、压力和水质变化,以评估系统的性能和效率。
EPANET提供了一套强大的工具,用于模拟不同的供水条件、优化水力设计和评估系统的安全和可靠性。
4.GPS-X:GPS-X是一款用于废水处理系统建模和模拟的软件。
它可以用于评估不同的处理选项、优化系统设计、模拟废水流量和质量的变化,并提供数据管理和结果分析功能。
GPS-X支持多种处理过程和反应方程,可以帮助设计师更好地理解和优化废水处理过程。
5. Minitab:Minitab是一款用于统计分析和数据可视化的软件。
在水处理设计中,Minitab可以用于分析和解释实验数据、评估水质参数之间的关系、制定最佳的处理方案等。
Minitab提供了一系列强大的统计工具,可以帮助设计师更好地理解和优化水处理过程。
总的来说,在水处理设计中,计算软件是设计过程中不可或缺的工具。
这些软件提供了强大的计算、模拟和分析功能,可以帮助设计师更好地理解和优化水处理系统的性能和效率。
通过使用这些软件,设计师可以更准确地估计处理器件的尺寸、流量和水质要求,提高系统的可靠性和效率。

焓湿图在线计算软件作为一位暖通人,无论在学习还是工作的过程中都免不了要使用焓湿图。
为了不负我“愿做暖通领域最牛程序员”的大志,今天给大家放个大招,一款简单实用、超级无敌吊炸天的网页版焓湿图计算软件!该软件使学生或研究人员能够快速确定湿空气的参数并计算一次和二次回风,并能在焓湿图上准确显示处理过程!与市场上现有的焓湿图计算软件相比,它有以下三个突出之处:1.该软件无需安装,只需要在浏览器中打开即可使用,不仅跨平台支持MAC、Windows等系统,设置可以在移动设备上使用;(建议使用谷歌浏览器访问)2.该软件界面交互方便,只需简单输入室内外状态参数、热湿负荷以及处理方式即可立即完成计算并将处理过程绘制出来;3.该软件输出数据翔实,可以方便的查询每个处理过程的所有参数,例如:焓差、湿差、风量、热量等,并用不同的单位显示,避免手工换算;其实我在本科期间就打算完成这个软件,只是一直没有机会提上日程。
整个寒假下来,终于完成了软件的初级版本,高级版本正在开发中,把价值和可用性提升了一个档次!为了实现该软件,我参考了HVAC-ID.exe这款伴随过我大学生涯的免费软件,在此向的慷慨表示感谢!我将在保留版权的前提下,免费公开该软件(初级版),供各位学子及工程师使用!若是该软件对您的学习或工作起到帮助,我将深感荣幸!若对该软件有意见或建议请通过(icaoyanbin)或反馈,我将逐一回复!在后台回复:焓湿图,即可获取该软件网址,复制到电脑中即可使用,推荐是使用谷歌浏览器!(之所以不在原文中放入链接,原因是现在还未申请域名,所以以后网址会有更换,届时请在后台回复“焓湿图”,即可获得最新网址!)网页版焓湿图使用教程_腾讯视频焓湿图视频教程请在WIFI网络下观看,土豪可以打赏我后在WIFI网络观看。
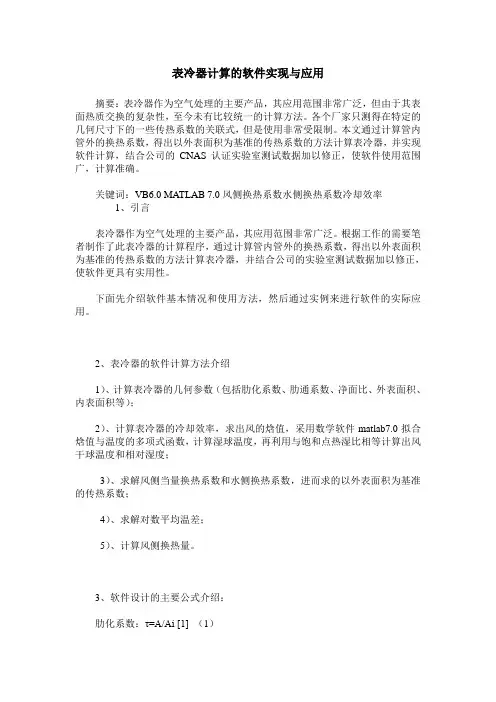
表冷器计算的软件实现与应用摘要:表冷器作为空气处理的主要产品,其应用范围非常广泛,但由于其表面热质交换的复杂性,至今未有比较统一的计算方法。
各个厂家只测得在特定的几何尺寸下的一些传热系数的关联式,但是使用非常受限制。
本文通过计算管内管外的换热系数,得出以外表面积为基准的传热系数的方法计算表冷器,并实现软件计算,结合公司的CNAS认证实验室测试数据加以修正,使软件使用范围广,计算准确。
关键词:VB6.0 MATLAB 7.0风侧换热系数水侧换热系数冷却效率1、引言表冷器作为空气处理的主要产品,其应用范围非常广泛。
根据工作的需要笔者制作了此表冷器的计算程序,通过计算管内管外的换热系数,得出以外表面积为基准的传热系数的方法计算表冷器,并结合公司的实验室测试数据加以修正,使软件更具有实用性。
下面先介绍软件基本情况和使用方法,然后通过实例来进行软件的实际应用。
2、表冷器的软件计算方法介绍1)、计算表冷器的几何参数(包括肋化系数、肋通系数、净面比、外表面积、内表面积等);2)、计算表冷器的冷却效率,求出风的焓值,采用数学软件matlab7.0拟合焓值与温度的多项式函数,计算湿球温度,再利用与饱和点热湿比相等计算出风干球温度和相对湿度;3)、求解风侧当量换热系数和水侧换热系数,进而求的以外表面积为基准的传热系数;4)、求解对数平均温差;5)、计算风侧换热量。
3、软件设计的主要公式介绍:肋化系数:τ=A/Ai [1] (1)肋通系数:a=A/fa[1] (2)净面比:ε=(S1-d0)(e-δf)/S1e [1](3)空气侧对流换热系数:aa=1.1C1C2(λ/de)(L/de)nRem[1](4)冷却效率1:η=1-exp(-aa a N/ CpρVa) [1](5)冷却效率2:η=( h1- h2)/( h1- hs) [1] (6)水侧换热系数:aw=(1430+22t)Vw0.8/di0.2[1](7)式中:A—每米管长总外表面积,㎡;Ai—每米管长内表面积,㎡;S1—管中心距,m;d0—基管外径,m;h1、h2、hs—空气进出口焓,kJ/kg ;aa—空气侧对流换热系数w/ ㎡k ;Va—迎面风速,m/s ;N—排数;Cp—空气定压比热容,kJ/kg℃;ρ—空气密度,kg/m³ ;Re —雷诺数;Vw—水流速,m/s;di—管内径,m;λ—导热系数,w/m k;L —沿气流方向肋片长度,m;e —翅片间距,m;δf —翅片厚度,m。
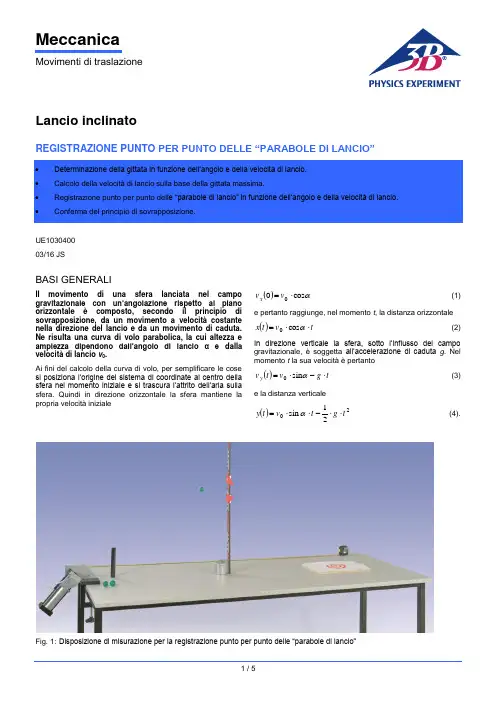
MeccanicaMovimenti di traslazioneLancio inclinatoREGISTRAZIONE PUNTO PER PUNTO DELLE “PARABOLE DI LANCIO”UE1030400 03/16 JSBASI GENERALIIl movimento di una sfera lanciata nel campo gravitazionale con un’angolazione rispetto al piano orizzontale è composto, secondo il principio di sovrapposizione, da un movimento a velocità costante nella direzione del lancio e da un movimento di caduta. Ne risulta una curva di volo parabolica, la cui altezza e ampiezza dipendono dall’angolo di lancio α e dalla velocità di lancio v 0.Ai fini del calcolo della curva di volo, per semplificare le cose si posiziona l’origine del sistema di coordinate al centro della sfera nel momento iniziale e si trascura l’attrito dell’aria sulla sfera. Quindi in direzione orizzontale la sfera mantiene la propria velocità iniziale()αcos 00⋅=v v x (1)e pertanto raggiunge, nel momento t , la distanza orizzontale()t v t x ⋅⋅=αcos 0(2)In direzione verticale la sfera, sotto l’influsso del campo gravitazionale, è soggetta all’accelerazione di caduta g . Nel momento t la sua velocità è pertanto()t g v tv y ⋅-⋅=αsin 0(3)e la distanza verticale()2021sin t g t v t y ⋅⋅-⋅⋅=α (4).Fig. 1: Disposizione di misurazione per la registrazione punto per punto delle “parabole di lancio”ELENCO DEGLI STRUMENTI1 Apparecchio di lancio1002654 (U10360) 1 Supporto per apparecchio di lancio1002655 (U10361) 1 Scala per altezza, 1 m 1000743 (U8401560) 1 Set indicatori per scale 1006494 (U8401570) 1 Piede a barilotto, 1 kg 1002834 (U13265) 1 Metro a nastro tascabile, 2 m1002603 (U10073)La curva di volo della sfera ha forma parabolica in quanto soddisfa l’equazione()()220cos 21tan xv g x x y ⋅⋅⋅-⋅=αα (5)Nel momentogv t αsin 01⋅=(6).la sfera raggiunge il punto più elevato della parabola e nel momentogv t αsin 202⋅⋅= (7).ritorna nuovamente all’altezza di partenza 0. L’altezza della parabola è quindi()α2201sin 2⋅⋅==gv t y h(8).e l’ampiezza()ααcos sin 2202⋅⋅⋅==gv t x s(9).Nell’esperimento si misurano punto per punto le curve di volo di una sfera di legno in funzione dell’angolo e della velocità di lancio con l’impiego di una scala per altezza con due indicatori (ved. fig. 3). La componente orizzontale x della curva di volo si ricava dalla distanza X orizzontale rispetto al bordo destro del supporto determinata con un metro a nastro:mm 110+=X x(10).La componente verticale y si calcola a partire dalle posizioni Y 1 e Y 2 dei due indicatori con l'assunzione che la sfera voli esattamente in mezzo. A questo proposito si deve considerare che il punto zero della misurazione dell'altezza corrisponde all'altezza del bordo superiore del tavolo, mentre la sfera parte 37,5 mm al di sopra dello stesso:mm 5,37212-+=Y Y y (11).Lo scostamento massimo del valore calcolato dal valore reale è pari amm 5,12212--=∆Y Y y (12).MONTAGGIO∙Bloccare il supporto per l'apparecchio di lancio sulla parte frontale di un tavolo lungo almeno 2 m e montare l'apparecchio di lancio secondo le istruzioni per l'uso ∙ Srotolare il metro a nastro - a partire dal bordo destro del supporto per l'apparecchio di lancio - e fissarlo sul tavolo. ∙Disporre sul tavolo il bersaglio di figura 2 su una base di 25 mm di spessore a una certa distanza dall'apparecchio di lancio.∙ Montare posteriormente una parete "di raccolta" per la sfera che rimbalza.Fig. 2: Bersaglio per l'atterraggio della sferaFig. 3: Rappresentazione schematicaAVVERTENZE PER LA SICUREZZAAnche se l'energia di lancio della sfera è molto bassa, la sfera non deve in nessun caso colpire gli occhi.∙Non guardare mai nella canna dell'apparecchio di lancio!∙Si deve controllare la posizione della sfera soltanto attraverso i fori laterali dell'apparecchio di lancio.∙Prima del lancio accertarsi che non si trovino persone nella traiettoria.ESECUZIONEDeterminazione della gittata in funzione dell'angolo di lancio∙Impostare l'angolo di lancio α = 30°.∙Disporre il bersaglio a circa 1 m di distanza.∙Caricare l'apparecchio di lancio secondo le istruzioni per l'uso fino al tensionamento minimo.∙Lanciare la sfera e seguire la traiettoria della sfera.∙Spostare il bersaglio verso il punto di impatto della sfera.∙Ripetere il lancio della sfera e correggere la posizione del bersaglio finché la sfera non atterra nel centro del bersaglio.∙Determinare la distanza X del centro del bersaglio e inserirla nella tab. 1.∙Effettuare in successione la misurazione anche per gli angoli di lancio α = 45°, 60° e 75°.∙Nella Tab. dalle distanze X secondo (10) calcolare le gittate s.Determinazione della gittata massima in funzione della velocità di lancio:∙Impostare l'angolo di lancio α = 45°.∙Caricare l'apparecchio di lancio secondo le istruzioni per l'uso fino al tensionamento medio.∙Lanciare la sfera e seguire la traiettoria della sfera.∙Spostare il bersaglio verso il punto di impatto della sfera.∙Ripetere il lancio della sfera e correggere la posizione del bersaglio finché la sfera non atterra nel centro del bersaglio.∙Determinare la distanza X del centro del bersaglio e inserirla nella tab. 2.∙Effettuare la misurazione anche per il massimo tensionamento della molla.∙Nella tab. 2 dalle distanze X secondo (10) calcolare le gittate massime s max.Registrazione punto per punto delle “parabole di lancio” in funzione dell’angolo di lancio.∙Impostare l'angolo di lancio α= 30° e posizionare il bersaglio in modo che la sfera atterri nel centro con tensionamento minimo della molla.∙Montare la scala per altezza nel piede a barilotto e disporla a X = 100 mm∙Disporre la coppia di indicatori a Y1 = 110 mm e Y2 = 140 mm.∙Lanciare la sfere con il minimo tensionamento della mollae verificare se atterra senza impedimenti nel centro delbersaglio.∙Correggere eventualmente la posizione dell'indicatore finché la sfera non atterra nel centro del bersaglio.∙Inserire i valori X, Y1 e Y2 nella tab. 3 e in base ad essi calcolare x, y e ∆y.∙Aumentare le distanze X in stadi da 50 mm e correggere rispettivamente la posizione dell'indicatore finché la sfera con tensionamento minimo della molla atterra nel centro del bersaglio.∙Effettuare le misurazioni anche per gli angoli di lancio α = 45°, 60° e 75° e riportare i risultati nelle tab. 4, 5 e 6.∙Se è disponibile sufficiente spazio per gli esperimenti eseguire misurazioni anche per altri tensionamenti della molla.ESEMPIO DI MISURAZIONEDeterminazione della gittata in funzione dell'angolo di lancioTab. 1: Gittata in funzione dell'angolo di lancio alla minima velocità di lancioTab. 2: Gittata massima in funzione della velocità di lancioRegistrazione punt o per punto delle “parabole di lancio” in funzione dell’angolo di lancio.Tab. 3: coordinate della curva di volo rispetto all'angolo di lancio α = 30°:Tab. 4: coordinate della curva di volo rispetto all'angolo di lancio α = 45°:Tab. 5: coordinate della curva di volo rispetto all'angolo di lancio α = 60°:Tab. 6: coordinate della curva di volo rispetto all'angolo di lancio α = 75°:3B Scientific GmbH, Rudorffweg 8, 21031 Amburgo, Germania, ANALISIDeterminazione della gittata in funzione dell'angolo di lancioLa figura 4 rappresenta graficamente la dipendenza della gittata s dall'angolo di lancio α sulla base dei valori di misura della tab.1. La curva disegnata attraverso i punti di misura è stata calcolata per v 0 =3,42 m/s secondo (9).α°s / mFig. 4: Gittata in funzione dell'angolo di lancioIn corrispondenza dell’angolo di lancio α = 45° viene raggiunta l’ampiezza s max di tutte le curve di volo.Determinazione della gittata massima s max in funzione della velocità di lancio v 0:Dalla gittata massima s max ottenuta a 45° può essere calcolata la velocità di lancio v 0. Grazie all’equazione 9, valemax 0s g v ⋅=I risultati sono riportati nella tab. 2.Registr azione punto per punto delle “parabole di lancio” in funzione dell’angolo di lancio.La fig. 5 mostra le curve elencate nelle tab. da 3 a 6 in rappresentazione grafica. Un'analisi precisa mostra che le curve di volo si scostano leggermente dalla forma parabolica, perché si deve considerare l'attrito dell'aria della sfera.x / c m y / c m5Fig. 5: Parabole di lancio misurate e calcolate tenendoconto dell’attrito dell’aria a velocità di lancio minima e a diversi angoli di lancio.。
Seoul National UniversityChemical Process Modeling & Simulation Process Modeling Using Aspen Plus (User Interface & Basic Inputs)TA : Ikhyun Kim Instructor : En Sup Y oon Spring Semester, 2012•What is flowsheet simulation?–Use of a computer program to quantitatively model thecharacteristic equations of a chemical process•Uses underlying physical relationships–Mass and energy balance–Equilibrium relationships–Rate correlations (reaction and mass/heat transfer)•Predicts–Stream flowrates, compositions, and properties–Operating conditionsFlowsheet SimulationSeoul National University Chemical Process Modeling & Simulation (3/39)•Build large flowsheets a few blocks at a time –This facilitates troubleshooting if error occur•Not necessarily a one-to-one correspondence between pieces of equipment in the plant and Aspen plus blocks •Ensure flowsheet inputs are reasonable•Check that result are consistent and realistic Good Flowsheeting Practice•Rigorous electrolyte simulation•Solid handing•Petroleum handling•Data regression•Data fit•Optimization•User routinesSome Important Features of Aspen+Seoul National University Chemical Process Modeling & Simulation (5/39)The User Interface (Flowsheet)Next button Detherminternet NIST/TDE Pure propertyProcessFlowDiagramSelectModeButton Model Library Tabs ModelLibraryStatusAreaThe User Interface (Data browser)DatabrowserSpecification& Resultdata menu treeSub-specificationtab StatusAreaDescriptionSeoul National UniversityChemical Process Modeling & Simulation (7/39)The User Interface (Run control panel)RunControlPanel Summaryof errorsCalculationSequenceDescription ofsequential calculationStatusAreaGraphic Flowsheet Operations -Blocks•To place a block on the flowsheet:1.Click a model category tab in the Model Library2.Select a unit operation model; click the drop-down arrow toselect an icon for the model3.Click the model and then click the flowsheet to place the block;you can also click the model icon and drag it onto the flowsheet4.Click the right mouse button to stop placing blocksSeoul National University Chemical Process Modeling & Simulation (9/39)Graphic Flowsheet Operations -Streams •To place a stream on the flowsheet:1.Click the STREAMS icon in the Model Library2.If you want to select a different stream type (Material, Heat or Work), click the down arrow next to the icon and choose a different type3.Click a highlighted port to make the connection4.Repeat step 3 to connect the other end of the stream5.To place one end of the stream as either a process flowsheet feed or product, click a blank part of the Process Flowsheet6.Click the right mouse button to stop creating streamsAutomatic Naming of Streams and Blocks •Stream and block names can be assignedautomatically by Aspen Plus or entered by the user when the object is created•To modify the naming options:1.Select Options from the Tools menu2.Click the Flowsheet tab3.Check or uncheck the naming options desired •Stream and block names can be displayed or hidden1.Select object, right-click, and choose Hide from the menuSeoul National University Chemical Process Modeling & Simulation (11/39)Modifying Blocks and Streams •To display Input and Results forms in the Data Browser:1.Double-click the object of interest, orSelect the block or stream, right-click, and select Input… from the menu•To change the appearance of a block or stream:1.Select object by clicking it with the left mouse button2.Click the right mouse button while the pointer is over the selected object icon to bring up the menu for that object3.Choose appropriate menu itemBreaking and Splicing Streams •To break a stream on the Process Flowsheet:1.Select the stream on the flowsheet and right mouse click2.Select “Break Stream” for the stream menu3.If results exist, you will be asked if you want to reconcile the stream4.Enter the name of the new product stream created•To splice two streams:1.Select the two streams to be spliced (using the Shift or Ctrl key)2.Right mouse click on one of the streams, select “Splice Streams”bined stream will have the name of the former feed streamSeoul National University Chemical Process Modeling & Simulation (13/39)Inserting Blocks•To insert a block on the Process Flowsheet:1.Select the stream where you want to insert the block2.Right-click and select “Insert Block”3.If results exist, you will be asked if you want to reconcile the stream4.Select the new block ID and type5.The old stream is connected to the first inlet and outlet port for the new block6.Additional streams may need to be added to complete flowsheet connectivity depending on the modelUsing the Mouse Buttons•Left-click❝Selects a block, stream, object ID, or annotation •Right-click ❝Brings up menu for the selected stream, block, or flowsheet❝Cancels placement of streams or blocks on the flowsheet•Double-left-click ❝Opens the Data Browser to the stream or block Input form, or Results form for intermediate streams❝Edits textSeoul National University Chemical Process Modeling & Simulation (15/39)Saving an Aspen Plus Simulation •To save a file:1.Select Save As from the File menu2.Choose a File name3.Choose an appropriate Save As TypeFile TypeExtension Format Description Document*.apw Binary File containing simulation input, results and intermediate convergence information Backup*.bkp ASCII Archive file containing simulation input and results Compound *.apwz Binary Compressed file which contains the model (theBKP or APW file) and external files referenced bythe model. You can add additional files such assupporting documentation to the APWZ file.See Maintaining Aspen Plus Simulations section for information on other file formats Functionality of Forms•When you click the left mouse button to select a field on a form, the Description area gives you information about that field. Use this content to help with data entry •Click the drop-down arrow in a field to bring up a list of possible input values for that field–Typing a letter will bring up the next selection on the list that begins with that letter•The Tab key will take you to the next field on a form •In tables, Aspen Plus always adds a single row below the last entrySeoul National University Chemical Process Modeling & Simulation (17/39)Help•Help Topics–Select Help Topics from the Help menu to launch online help:•Contents : Browse through the documentation, including User Guides and Reference Manuals•Index : Search for help on a specific topic using the index entries •Search : Search for a help on a topic that includes any word or words•“What’s This?” Help–Click the “What’s This?” toolbar button and then click any area to get help for that item•F1 Help–With the cursor in the desired field, press the <F1> function key to bring up help for field and/or sheet•The minimum required inputs to run a simulation are:–Setup –Components –Properties –Streams –Blocks•Enter data on the input forms in the above order by clicking the Next Button•Or, these input folders can be located quickly using the Data menu or the Data Browser toolbar buttons Basic InputSeoul National University Chemical Process Modeling & Simulation (19/39)•Colors and shapes are used to describe the current status of input and results:Status IndicatorsSymbol StatusInput for the form is incompleteInput for the form is completeNo input for the form has been entered. It is optional .Results for the form existResults for the form exist, but there were calculation errors.Results for the form exist, but there were calculation warnings .Results for the form exist, but input has changed since theresults were generated.Cumene Flowsheet DefinitionRStoicModel Heater Model REACTORFEED RECYCLEREAC-OUT COOLCOOL-OUT Flash2ModelSEP PRODUCT •Which Aspen Plus block would you use for each unit?Seoul National UniversityChemical Process Modeling & Simulation(21/39)•Most of the commonly used Setup information is entered on the Setup Specifications Global sheet–Flowsheet title to be used on reports –Run type–Input and output units–Valid phases (i.e., vapor-liquid or vapor-liquid-liquid)–Ambient pressure•Stream report options are located on the Setup Report Options Stream sheetSetupSetup Specification FormSeoul National UniversityChemical Process Modeling & Simulation(23/39)Flowsheet Standard Aspen Plus flowsheet run . Flowsheet runs can contain property estimation, assay data analysis, and/or property analysis calculationsAssay Data Analysis A standalone Assay Data Analysis and pseudocomponent generation run . Use Assay Data Analysis to analyze assay data when you do not want to perform a flowsheet simulation in the same runDataRegressionA standalone Data Regression run . Use Data Regression to fit physical propertymodel parameters required by Aspen Plus to measure pure component, VLE, LLE, and other mixture data. Data Regression can contain property estimation and property analysis calculations. Aspen Plus cannot perform data regression in a flowsheet run Properties PlusProperties Plus setup run . Use Properties Plus to prepare a property package for use with Aspen Custom Modeler or Aspen Pinch, with third-party commercial engineering programs, or with your company's in-house programs. You must be licensed to use Properties PlusProperty Analysis A standalone Property Analysis run . Use Property Analysis to generate property tables, PT-envelopes, residue curve maps, and other property reports when you do not want to perform a flowsheet simulation in the same run. Property Analysis can contain property estimation and assay data analysis calculat ionsProperty EstimationStandalone Property Constant Estimation run . Use Property Estimation to estimate property parameters when you do not want to perform a flowsheet simulation in the same runSetup Run T ype•Units in Aspen Plus can be defined at three different levels:–Global Level (“Input Data” and “Output Results” fields on the Setup Specifications Global sheet)–Object level (“Units” field in the tip of any input form of an object such as a block or stream)–Field level•Users can create their own units sets using the Setup Units-Sets Object Manager . Units can be copied from an existing set and then modified.Setup UnitsSeoul National UniversityChemical Process Modeling & Simulation(25/39)•Use the Components Specifications form to specify all the components required for the simulation•If available, physical property parameters for each component are retrieved from databanks•Pure component databanks contain parameters such as molecular weight, critical properties, etc. The databank search order is specified on the Databanks sheet•The Find button can be used to search for components •The Electrolyte Wizard can be used to set up an electrolyte simulationComponentsComponentsSeoul National UniversityChemical Process Modeling & Simulation(27/39)•Use the Properties Specifications form to specify the physical property methods to be used in the simulation•Property methods are a collection of models and methods used to describe pure component and mixture behavior•Choosing the correct physical properties is critical for obtaining reliable simulation results•Selecting a Process Type will narrow the number of methods availablePropertiesLiquid Mole Fraction METHANOLV a p o r M o l e F r a c t i o n M E T H A N O LLiquid Mole Fraction METHANOLV a p o r M o l e F r a c t i o n M E T H A N O LLiquid Mole Fraction METHANOLV a p o r M o l e F r a c t i o n M E T H A N O LRaoult’s LawRK-SoaveNRTLPropertiesSeoul National UniversityChemical Process Modeling & Simulation(29/39)•Use Stream Input forms to specify feed stream conditions, including two of the following:–Temperature –Pressure–Vapor Fraction•Plus, for stream composition either:–Total stream flow and component fractions –Individual component flows•Specifications for streams that are not feeds to the flowsheet are used as estimatesStreamsStreams Input FormSeoul National UniversityChemical Process Modeling & Simulation(31/39)•Each Block Input or Block Setup form specifies operating conditions and equipment specifications for the unit operation model •Some unit operation models require additional specification forms•All unit operation models have optional information forms (e.g., Block Options form)BlocksBlocks FormSeoul National UniversityChemical Process Modeling & Simulation(33/39)•Select Control Panel from the View menu or press the Next button to be prompted–Execute the simulation when all required forms are complete. If you are unsure, use the Next button to take you to any incomplete formsStarting the Run•The Control Panel consists of a:–Message window showing the progress of the simulation by displaying the most recent messages from the calculations–Status area showing the hierarchy and order of simulation blocks and convergence loops executed–Toolbar that you can use to control the simulationControl PanelRun Start or continue calculationsStep Step through the flowsheet one block at a time Stop Pause simulation calculations Reinitialize Purge simulation results ResultsCheck simulation resultsSeoul National UniversityChemical Process Modeling & Simulation(35/39)•History file or Control Panel Messages–Contains any generated errors or warnings (Select History or Control Panel on the View menu to display the History file or the Control Panel)•Stream Results–Contains stream conditions and compositions (For all streams, click Results Summary/Streams; for individual streams, click the stream name in the Streams folder, then select the Results form)•Block Results–Contains calculated block operating conditions (In the Blocks folder, click the block, then select the Result form)Reviewing ResultsCumene Production ConditionsSeoul National UniversityChemical Process Modeling & Simulation(37/39)•Objective : Add the process and feed stream conditions to a flowsheetExercise) Benzene Workshop•Results–What is the heat duty of the COOLER block? ___________–What is the temperature in the FL2 block? ___________Exercise) Benzene WorkshopSeoul National UniversityChemical Process Modeling & Simulation(39/39)(Exercise) Benzene Workshop ResultsFEED COOL VAP1LIQ1VAP2LIQ2Temperature, F 100020010010099.899.8Pressure, psi 55055050050014.714.7Vapor Frac10.8691010Mole Flow, lbmol/hr 600600501.72498.276 2.76295.514Mass Flow, lb/hr 10221.9910221.992628.6687593.32471.7867521.538Volume Flow, cuft/hr 17271.526905.6336098.248143.3541123.627140.415Enthalpy, MMBtu/hr 7.3610.17-2.776 2.015-0.0232.037Mole Flow, lbmol/hr HYDROGEN 405405404.2390.7610.7540.007METHANE 959593.477 1.523 1.3980.125BENZENE 9595 3.93591.0650.690.464TOLUENE550.0734.9270.014.917COOL heat duty-7.19 MMBtu/hrFL2 outlet temperature 99.83ºF。
文章编号:1009-9425(2005)03-0019-03收稿日期:2004-10-22作者简介:马金亮,男,1997毕业于西安交通大学制冷设备及低温技术专业,现为杭州福斯达气体设备有限公司副总工程师。
AspenPlus 软件模拟计算空分设备流程的修正马 金 亮(杭州福斯达气体设备有限公司,杭州临平东湖北路159号 311100)摘要:简介了AspenPlus 软件,详细介绍了使用AspenPlus 流程模拟软件进行空分设备流程模拟计算时应注意的问题及修正的方法。
关键词:空分设备;AspenPlus 软件;流程;模拟;修正中图分类号:TB65717 文献标识码:AAmending the process analog computation of an air separationplant simu lated by software AspenPlusMa Jin -liang(Hangzhou Fortune Gas Equipment Co 1,Ltd 1,159Hubei Road (E ),Linping 311100,Hangzhou,Zhejiang,P 1R 1China)Abstract:The software AspenPlus is described in brief.The paper highlights the points needing attention when calculating the process data for an air separation plant simulated by AspenPlus and measures for a mendment.Keywords:Air separation plant;Software AspenPlus;Process;Simulation;Amendment1 AspenPlus 软件简介AspenPlus 软件是大型通用流程模拟系统,20世纪70年代后期,美国能源部开发的新型第三代流程模拟软件。
目前我们使用的Aspen plus 是英文版本,大家在使用过程中难免遇到一些不常见或不清楚意思的英文单词,为此我们编制了叙词表方便大家查阅azeotropic 共沸 cryogenic低温环境atm 1atm为一个标准大气压压力单位Bar 巴包含了一系列物性方程BaseMethod 基本方法Batch 批量处理BatchFrac 用于两相或三相间歇式精馏的精确计算Benzene 苯Blocks 模型所涉及的塔设备的各个参数Block-V ar 模块变量ChemV ar 化学变量Columns 塔Columnspecifications 塔规格CompattrV ar 组分变量Components 输入模型的各个组成ComponentsId 组分代号Componentsname 组分名称Composition 组成Condenser 冷凝器Condenserspecifications 冷凝器规格Constraint 约束条件Conventional 常规的Convergence 模型计算收敛时所涉及到的参数设置Databrowser 数据浏览窗口Displayplot 显示所做的图对精馏塔进行操作型的简捷计算Distl 使用Edmister方法对精馏塔进行设计型的简捷计算DSTWU 使用Winn-Underwood-Gilliland 方法DV:D 精馏物气相摩尔分率ELECNRTL 物性方程适用于中压下任意电解质溶液体系Extract 对液体采用萃取剂进行逆流萃取的精确计算Find 根据用户提供的信息查找到所要的物质Flowsheetingoptions 流程模拟选项Formula 分子式Gasproc 气化Heat Duty 热负荷HeatExchangers 热交换器Heavy key 重关键组分IDEAL 物性方程适用于理想体系Input summary 输入梗概Key component recoveries 关键组分回收率kg/sqcm 千克每平方厘米Lightkey 轻关键组分Manipulated variable 操作变量Manipulators 流股调节器Mass 质量流量Mass-Conc 质量浓度Mass-Flow 质量流量Mass-Frac 质量分率热和material 物料heatMaterialstreams 绘制流程图时的流股包括work(功)mbar 毫巴Mixers/splitters 混合器/分流器Mmhg 毫米汞柱mmwater 毫米水柱Model analysis tools 模型分析工具Model library 模型库Mole 摩尔流量Mole-Conc 摩尔浓度Mole-Flow 摩尔流量Mole-Frac 摩尔分率如吸收/汽提耦合塔MultiFrac 用于复杂塔分馏的精确计算N/sqm 牛顿每平方米NSTAGE 塔板数Number of stages 塔板数Gas 油气化OilOptimization 最优化Overallrange 灵敏度分析时变量变化范围Pa 国际标准压力单位PACKHEIGHT 填料高度Partial condenser with all vapor distillate 产品全部是气相的部分冷凝器Partial condenser with vapor and liquid distillate 有气液两相产品的部分冷凝器PBOT 塔底压力PENG-ROB 物性方程适用于所有温度及压力下的非极性或极性较弱的混合物体系Petchem 聚酯化合物如预闪蒸塔PetroFrac 用于石油精炼中的分馏精确计算Plot 图表PR-BM 物性方程适用于所有温度及压力下非极性或者极性较弱的体系Pressure 压力PressureChangers 压力转换设备PRMHV2 物性方程适用于较高温度及压力下极性或非极性的化合物混合体系Process type 处理类型Properties 输入各物质的物性Property methods & models 物性方法和模型psi 英制压力单位psig 磅/平方英寸(表压)PSRK 物性方程适用于较高温度及压力下极性或非极性的轻组分气体化合物体系PTOP 塔顶压力RadFrac 用于简单塔两相或三相分馏的精确计算RateFrac 用于基于非平衡模型的操作型分馏精确计算Reactions 模型中各种设备所涉及的反应Reactors 反应器ReactV ar 反应变量Reboiler 再沸器RECOVH 重关键组分回收率RECOVL 轻关键组分回收率Refinery 精炼Reflux ratio 回流比Reinitialize 重新初始化Result summary 结果梗概Retrieve parameter results 结果参数检索RKS-BM 物性方程适用于所有温度及压力下非极性或者极性较弱的体系RKSMHV2 物性方程适用于较高温度及压力下极性或非极性的轻组分气体化合物体系RK-SOA VE 物性方程适用于所有温度及压力下的非极性或极性较弱的混合物体系RKSWS 物性方程适用于较高温度及压力下极性或非极性的轻组分气体化合物体系RR 回流比Run status 运行状态如常减压蒸馏塔和真空蒸馏塔SCFrac 复杂塔的精馏简捷计算Sensitivity 灵敏度Separators 分离器Solids 固体操作设备SR-POLAR 物性方程适用于较高温度及压力下极性或非极性的轻组分气体化合物体系State variables 状态变量Stdvol 标准体积流量Stdvol-Flow 标准体积流量Stdvol-Frac 标准体积分率Stream 各个输入输出组分的流股StreamV ar 流股变量Substream name 分流股类型Temperature 温度Toluene 甲苯真空度单位Torr 托Total condenser 全凝器Total flow 总流量UNIQUAC 物性方程适用于极性和非极性强非理想体系UtilityVar 公用工程变量V aiable number 变量数V aporfraction 汽相分率V olume 体积流量Axisvariable 作图时的横坐标变量XAxisvariable 作图时的纵坐标变量Y。
June2008化肥设计Chem ical Fertilizer Design 第46卷 第3期2008年6月设计技术基于A spen Pl us的粉煤气化模拟张宗飞,汤连英,吕庆元,章卫星,何正兆,毕东煌(中国五环化学工程公司,湖北武汉 430223)摘 要:以A s pen Plus为模拟工具,选择反应平衡模型,并应用Gibbs自由能最小化方法建立了Shell粉煤气化模型;通过对神华、沾化和天碱煤种的气化模拟,对建立的模型进行了检验,结果表明:用N2输送粉煤的气化过程能够很好地模拟,而用CO2输送粉煤的气化过程模拟偏差较大。
以沾化煤种为例,检验了气化炉散热损失取煤总热值约2%的合理性;研究了不同操作条件下的气化性能,结果表明:提高温度和压力可使气化过程得到强化。
关键词:A s pen Plus软件;粉煤气化;模拟中图分类号:T Q422.6 文献标识码:A 文章编号:1004-8901(2008)03-0014-06Pulver i zed Coa l Ga si f i ca ti on S im ul a ti on Ba sed on A spen Plus SoftwareZHANG ZongΟfei,T ANG L ianΟying,LU Q ingΟyuan,Zhang W eiΟxing,HE ZhengΟzhao,B IDongΟhuang(China W uhuan Che m ical Engineering Corporation,W uhai Hubei 430223 China)Abstract:Taking the A s pen Plus s oft w are as the si m ulati on t ool,by selecting the reacti on balance model and using the m ini m izing method of the Gibbs free energy the Shell pulverized coal gasificati on model was established;thr ough the si m ulati on f or the coal kinds used in the Shen Hua Coal Gasifi2 cati on Plant,Zhangyi Chem ical Fertilizer Plant and Tianjing alkali p lants the established model has been ins pected,the result indicates that the gasifica2 ti on p r ocess for using the nitr ogen gas t o trans port the pulverized coal can be s moothly si m ulated,but for using the CO2gas t o trans port the pulverized coal the si m ulati on deviati on f or gasificati on p r ocess is relatively bigger.Taking the coal kind used in Zhangyi Che m ical Fertilizer p lant as the exa mp le,the reas onableness,taking about2%of the t otal heat value of coal as the heat dis persal l oss,was ins pected;the gasificati on p r operty under different operating conditi ons was studied,the result indicates that increasing the te mperature and the p ressure can make the gasificati on p r ocess t o be strengthened.Key words:A s pen Plus s oft w are;pulverized coal gasificati on;si m ulati on 煤气化技术是实现煤清洁利用的最有效途径,同传统的直接燃烧相比,它提高了煤的利用率,降低了污染物的排放。
航空能源技术使用的一些常用工具与软件推荐航空能源技术是航空工程领域的一个重要分支,涉及到航空发动机、燃料系统、动力管理等方面。
为了有效地进行航空能源技术的研究和应用,研究人员需要使用一些工具和软件来辅助他们的工作。
本文将介绍一些常用的航空能源技术工具和软件,以帮助研究人员在其工作中取得更好的效果。
1. MatLabMatLab是一种广泛使用的科学计算软件,可在航空能源技术研究中发挥重要作用。
MatLab提供了丰富的工具箱,包括数值计算、信号处理、图像处理、优化等方面的功能。
航空能源技术研究可以利用MatLab进行数值模拟、数据分析、算法开发等工作。
例如,研究人员可以使用MatLab来建立发动机模型、分析燃料效率、进行燃烧过程模拟等。
MatLab的强大功能和灵活性使其成为航空能源技术研究的首选工具之一。
2. ANSYSANSYS是一种流行的工程仿真软件,广泛应用于航空能源技术领域。
它提供了强大的有限元分析和计算流体力学功能,可以用于模拟和分析航空发动机的结构强度、燃烧过程、气动特性等。
通过使用ANSYS,研究人员可以定量评估设计参数对发动机性能的影响,优化设计并提高效率。
此外,ANSYS还可以进行燃烧过程模拟、热力学分析等,有助于航空能源技术的研究和开发。
3. GT-SUITEGT-SUITE是一种多物理场仿真软件,用于模拟和分析发动机、车辆和系统的性能。
在航空能源技术领域,GT-SUITE被广泛应用于发动机研发、燃料系统优化和动力管理等方面。
它提供了建模、仿真和优化工具,可以对航空能源系统进行全面的仿真和优化。
研究人员可以使用GT-SUITE来研究发动机的燃烧过程、气体流动特性、燃料喷射和燃烧室设计等,从而改进发动机的性能和效率。
4. CFD软件计算流体力学(CFD)软件是航空能源技术研究中不可或缺的工具之一。
CFD软件可以模拟航空发动机的内部流动,通过求解流体动力学方程来预测流体的速度、温度和压力分布。
技术·创新/浅谈湿空气物性计算软件CoolProp的应用李文博 莫善军(中山大学 广州 510000)摘要:本文通过介绍湿空气计算软件CoolProp,建立一种简单的调用CoolProp的方法,编程实现一款能够计算湿空气物性的软件,能够满足日常仿真计算的精度要求。
关键词:空调;湿空气Abstract:Air conditioning manufacturing industry is moving towards intelligence, simulation, in the simulation of refrigeration and air conditioning system, the physical properties of moist air calculation has very important applica-tion, Traditional methods are using look-up table or using the fitting formula, due to the simulation accuracy prob-lems, unable to meet the design requirements. By introducing the moist air calculation software CoolProp, provide a simple method of invoking CoolProp to solve and compare the standard data. The calculation data deviation of Cool-Prop is within 1%, which can meet the requirements of daily simulation calculation.Key words:air conditioner; moist airIntroduction of CoolProp Formoist Air Calculation前言在制冷空调领域,获取湿空气的物性数据是系统实验、热力学计算、仿真计算以及新型材料(如:亲水涂层)开发的过程中必须解决的一个问题。