英语图表作文写作方法及范文分析
- 格式:ppt
- 大小:688.00 KB
- 文档页数:20
高考英语指导写作专题:图表说明文一,图表说明1,分类:数字表、函数关系图、曲线图(graph);表格(table);几何图形(figure);图形表、饼状图(pie chart);条状图、柱状图(bar chart);平面图、示意图、外形图(diagram)。
2,一般可分三个层次来写:按照题目要求描述图表反映的总情况,即概括大意。
对数字进行仔细的比较,抓住特点进行分析、归纳并找出产生变化的原因。
读图表后的想法、结论、评论或针对反映出的问题采取的解决措施。
二.表达方式:1,常用的描述句型The table/chart/diagram/graph shows that ...According to the table/chart/diagram/graph...As is shown in the table/chart/diagram/graph...As can be seen from the table/chart/diagram/graph/figures...We can see from the figures/statistics...It is clear/ apparent from the figures/statistics...2.图表中数据(data)的具体表达法数据(data)在某一个时间段固定不变:fixed in time在一系列的时间段中转变:changes over time增加:increase/raise/rise/...减少:decrease/grow down/drop/fall/decline稳定:remain stable3.描写变化的形容词及副词rapid/rapidly,dramatic/dramatically,significant/significantly,sharp/sharplysteep/steeply,steady/steadily,gradual/gradually,slow/slowly,slight/slightly三、写作模板As (is) shown/indicated by the figure/in the table/graph/pie chart/chart,_____ has been increased/decreased significantly/steadily from _____ to_____. From the sharp decline/rise in the chart,it goes without saying that_____.There are at least two reasons accounting for / contributing to ____. On the one hand, _____ On the other hand, _____. _____is due to the fact that_____. In addition,_____is responsible for_____. Maybe there are other reasons to show. But it is generally believed that the above mentioned reasons are commonlyconvincing/persuasive.As far as I am concerned,I hold the view that_____. I am sure my opinion is both sound and well-grounded.四,作文范例1,最近你校对中学生的消费情况进行了调查。
英语图表作文写作方法一、图表作文写作模式图表作文是一种以图表的形式出现,提示的信息隐含在图表之中。
考生必须先仔细研读图表,使图表中的数据、曲线、图形等成为与短文标题相关并能为我所用的有意义的信息。
读图时务必要把握表层信息和深层含义这两方面的内容,主要考的是考生对图表深层次信息(原因、根源、可能导致的后果等)的挖掘和阐述。
1. 图表的类型1)泛指一份数据图表:a data graph/chart/diagram/illustration/table2)饼图:pie chart3)直方图或柱形图:bar chart / histogram4)趋势曲线图:line chart / curve diagram5)表格图:table6)流程图或过程图:flow chart / sequence diagram7)程序图:processing/procedures diagram8)统计表格:table2. 图表作文的一般要求性A.通常采用下列统一的标准提纲:1) 现状——图表揭示的表面变化2) 原因分析/导致问题——引起变化的深层次社会根源/该变化带来的种种问题3) 启示/建议——从图表所体现的变化趋势中得到的启示/提出个人建议B.解析图表步骤:在图表作文审题的时候,关键是拿起笔来圈定上面的重要信息、重要规律、重要数据、重要分配,描述图表并不意味着要把整个图表的一切信息包含在你的文章中,要传达的信息一定是最重要的信息。
C. 图表解析段落的内容结构:1)开头,可用笼统的一句话来交代,根据图表所示某个方面在某个时间段内发生了某种变化。
2)中间,可用两到三句话具体分析图表中显示的变化,描述单方面趋势(分支观点),数据分析(论证)。
抓住主要的显著的变化进行描述,相近的类别归为一类进行描述。
独特的类别要交代,以免漏掉重要信息;不是每个数据都要写,重要数据一定要提到;不要在所有数据间来回对照对比;3)结论,可用一句话简单再概括图表体现的变化趋势;不要涉及个人看法。


雅思英语图表作文范文第1篇A类雅思各类图表作文要点及范文一.曲线图解题关键1曲线图和柱状图都是动态图,解题的切入点在于描述趋势。
2在第二段的开头部分对整个曲线进行一个阶段式的总分类,使写作层次清晰,同时也方便考官阅卷。
接下来再分类描述每个阶段的specifictrend,同时导入数据作为分类的依据。
3趋势说明。
即,对曲线的连续变化进行说明,如上升、下降、波动、持平。
以时间为比较基础的应抓住“变化”:上升、下降、或是波动。
题中对两个或两个以上的变量进行描述时应在此基础上进行比较,如变量多于两个应进行分类或有侧重的比较。
4极点说明。
即对图表中最高的、最低的点单独进行说明。
不以时间为比较基础的应注意对极点的描述。
5交点说明。
即对图表当中多根曲线的交点进行对比说明。
6不要不做任何说明就机械地导入数据,这不符合雅思的考试目的。
曲线图常用词汇动词—九大运动趋势一:表示向上:increase,rise,improve,grow,ascend,mount,aggrandize,goup,climb, take off, jump,shoot up暴涨,soar,rocket, skyrocket雅思英语图表作文范文第2篇It is said that countries are becoming similar to each other because of the global spread of the same products, which are now available for purchase almost anywhere. I strongly believe that this modern development is largely detrimental to culture and traditions worldwide.A country’s history, language and ethos are all inextricably bound up in its manufactured artefacts. If the relentless advance of international brands into every corner of the world continues, these bland packages might one day completely oust the traditional objects of a nation, which would be a loss of richness and diversity in the world, as well as the sad disappearance of t he manifestations of a place’s character. What would a Japanese tea ceremony be without its specially crafted teapot, or a Fijian kava ritual without its bowl made from a certain type of tree bark?Let us not forget either that traditional products, whether these be medicines, cosmetics, toy, clothes, utensils or food, provide employment for local people. The spread of multinational products can often bring in its wake a loss of jobs, as people urn to buying the new brand,perhaps thinking it more glamorous than the one they are used to. This eventually puts old-school craftspeople out of work.Finally, tourism numbers may also be affected, as travelers become disillusioned with finding every place just the same as the one they visited previously. To see the same products in shops the world over is boring, and does not impel visitors to open their wallets in the same way that trinkets or souvenirs unique to the particular area too.Some may argue that all people are entitled to have access to the same products, but I say that local objects suit local conditions best, and that faceless uniformity worldwide is an unwelcome and dreary prospect.Heres my full answer:The line graphs show the average monthly amount that parents in Britain spent on their children’s s porting activities and the number of British children who took part in three different sports from 2008 to is clear that parents spent more money each year on their children’s participation in sports over the six-year period. In terms of the number of children taking part, football was significantly more popular than athletics and 2008, British parents spent an average of around £20 per month on their children’s sporting activities. Parents’ spending on children’s sports increased gradually over the followi ng six years, and by 2014 the average monthly amount had risen to just over £ at participation numbers, in 2008 approximately 8 million British children played football, while only 2 million children were enrolled in swimming clubs and less than 1 million practised athletics. The figures for football participation remained relatively stable over the following 6 years. By contrast, participation in swimming almost doubled, to nearly 4 million children, and there was a near fivefold increase in the number of children doing athletics.剑桥雅思6test1大作文范文,剑桥雅思6test1大作文task2高分范文+真题答案实感。

英语作文图表作文(五篇范文)第一篇:英语作文图表作文图表分析作文1As is clearly shown in the table/ figure/ graph / chart, 图表总体描述 between 年代 and 年代.Especially, 突出的数据变化.There are three reasons for 具体表示急剧上升、下降或特殊现象的词.To begin with, 原因一.In addition / Moreover, 原因二.For example, 具体例证.Last but no least, 原因三.In short,总结上文.As far as I am concerned, / For my part, / As for me,作者自己的观点.On the one hand, 理由一.On the other hand, 理由二.In brief,总结上文.图表分析作文2The table / figure / graph / chart shows that 图表总述from 年代to年代.It is self-evident that突出的数据变化.Three possible reasons contribute to 具体表示急剧上升、下降或特殊现象的词或代词代替上文内容.One reason is that原因一.Another reason is that 原因二.For instance,举例证.What’s more原因三.As a result, 重述上文之趋势.However, in my opinion 作者观点.For one thing,理由一.For another, 理由二.T o sum up,总结上文.图表分析作文3It can be seen from the table / figure / graph / chart that图表总述between年代and年代.Especially,突出的数据变化.Why are there such great changes during 图表涉及的年头数years? There are mainly two reasons explaining具体表示急剧上升、下降或特殊现象的词或代词代替上文内容.First,原因一.In the old days,比较法说明过去的情况.But now,说明现在的情况.Second,原因二.As a result,总结上文.In my viewpoint,作者自己的观点.On the one hand,论点一.On the other hand,论点二.图表分析作文4As the table / figure / graph / chart shows,图表总述in the past years年代.Obviously,突出的数据变化.Why are there suchsharp contrasts during 图表涉及的年头 years?Two main factors contribute to具体表示急剧上升、下降或特殊现象的词或代词代替上文内容.First of all,原因一.In the past,比较法说明过去的情况.But now 说明现在的情况.Moreover,原因二.Therefore,总结上文.As I see it,作者自己的观点.For one thing,论点一.For another,论点二.图表作文补充句型• As is shown in the graph…如图所示…•The graph shows that…图表显示…•As can be seen from the table,…从表格中可以看出…•From the chart, we know that…从这张表中,我们可知…• All these data clearly prove the fact that… 所有这些数据明显证明这一事实,即…• The increase of ….In the ci ty has reached to 20%.….在这个城市的增长已达到20%.• In 1985, the number remained the same.1985年,这个数字保持不变.• There was a gradual decline in 1989.1989年,出现了逐渐下降的情况.第二篇:英语图表作文图表描述专题训练(一)这类作文时,注意以下几点:第一,审题时,除了要把握好图表的表层信息外,还要分析图标的深层含义,如原因、根源、可能的发展趋势等。

高考英语书面表达练习——图表作文(格式与范例)作文一假如你是李华,在最近的研究性学习当中,受《21世纪中学生英语报》(The 21st Century)之邀,你对你所在的班60名同学(男女各半)进行了上网目的的调查。
现将调查结果(如下表所示)用英语给报社的编辑写一封信,报道此事,以引起舆论的关注,并提出你的观点和建议。
注意:1、报道应包括图表所示全部内容,可适度发挥。
2、文章的开头与结尾已给出,不计入总词数。
3、词数: 1504、参考词汇:调查: make a surveyDear editor,I have recently made a survey among 30 boys and 30 girls in my CLASs about their purpose of getting on the Internet. ______________________________________________作文二下列表格为某市1996年与2006年人们度假方式的情况比较,请按表格内容写一篇150词左右的短文,并对度假方式变化原因加以简要评析。
年度1996 2006 原因境外旅游11% 22% 收入增加海边度假38% 31% 海水污染爬山野营11% 34% 回归自然The way people spend their holidays changed a lot from 1996 to 2006.[思路点拨]题材:书信;说明+议论时态:一般现在时人称:第三人称要点提示:(1)上网的目的;(2)读新闻;(3)发送邮件;(4)聊天;(5)学习;(6)玩游戏;(7)评语篇章结构:文章可分两段[文采修饰]连接词的选用:but, both…, and, moreover, otherwise高级词汇的选用:keep in touch with, as for…, use… as …, benefit from, pay attention to, altogether, in one’s opinion.复杂句型的选用:what…most 引导的主语从句;as 引导的让步状语从句;倒装语序等。
您目前旳位置: 首页 > 英语四级 > 英语四级作文 > 英语四级作文综合辅导 > 正文英语四级图表作文旳类型及参照范文图表作文也是四(六)级考试中常见, 并且被认为是一种较难旳作文形式。
图表作文就是把非文字信息(一般为多种图表表达旳数字信息等)转换成文字信息旳一种作文。
它规定我们用文字来描述非文字性旳图表或对图表显示旳关系作解释阐明。
下面我们先来看一看图表作文旳类型。
第一节图表作文旳类型图表作文可分为两大类: 表作文和图作文。
表作文表格(Table)可以使大量数据系统化, 便于阅读、比较。
表格常由标题(Title)、表头(Boxhead)(表格旳第一行)、侧目(Stub)(表格左边旳第一列)和主体(Body)部分(表格旳其他部分)等部分构成。
如下表:用表格体现旳信息详细精确, 并且表格中旳各项均按一定规律排列。
阅读表格时要注意找出表格中各个项目旳互相关系, 表格中各个项目旳变化规律。
例如, 上面旳表格中旳数字阐明, 和1978年相比, 1983年大学入学旳人数在增长, 而小学旳入学人数在减少。
弄清晰这些变化规律也就读懂了表格旳内容。
图作文图作文又可分为三种: 圆形图作文、曲线图作文和条状图作文。
(1) 圆形图作文圆形图(Pie chart)也称为饼状图或圆面分割图。
圆形图由于比较形象和直观, 各部分空间大小差异轻易辨别, 因此常用来表达总量和各分量之间旳比例关系。
整个圆表达总量, 楔形块表达分量。
有时圆形图尚有数值表, 两者结合可把各分量表达得更精确、清晰。
例如:Thi.i..pi.char.o.th.averag.weekl.expenditur.o..famil.i.Grea.Britain.A.ca.b.se.fr o.th.chart.th.mai.expenditur.o.a.averag.Britis.famil.i.spen.o.food.whic.account. fo.25.o.it.tota.expenditure.Th.nex.tw.significan.expendin.item.ar.transpor.an.ho using.whic.ar.15.an.12.respectively.I.w.tak.int.accoun.clothin.an.footwear.whic. make.u.10%.th.fou.essential.o.life.tha.is.food.transport.housing.an.clothin.an.f ootwear.amoun.t.62.o.th.tota.expenditure.(2) 曲线图作文曲线图(Line graph)也称为线性图或坐标图。
高考英语图画型作文写作技巧及范文导语:图画型作文更能考察学生的分析问题的才能,因此深受命题者的青睐。
考生应注意认真审题,一旦审题有所偏颇,不容易得到高分。
此类作文首先要描绘图画,然后对图画进展适当的阐释(解释、说明和分析),介绍图画背后所反映的问题,最后联络实际发表自己的观点,给出自己的建议、原因等等,一般写三段。
以下是为大家精心的英语图画型作文写作技巧及范文,欢迎大家参考!1、As can be seen from the chart, …;From thechart/picture /table we can see(The chart shows) that ..;As is vividly shown in the picture( 假设两个的话用pictures,也可以用drawing,同样的假设两个的话用drawings,假设是图表那么用table ,两个图表那么用 table s) above, 图画的内容。
The picture( 假设两个的话用pictures,也可以用drawing,同样的假设两个的话用drawings,假设是图表那么用table ,两个图表那么用 table s) tells ( 注意,假设是前面的图画是复数,那么用tell) us that 这个图片的大致反映的意思。
2、 Recent years people in 地名(比方中国、北京、美国等等) have witnessed the fact that 描绘图片里的现象,And it is very mon/usual to see that in recent years.1、The implied meaning of the picture(注意,同上进展单复数的处理) should be taken into aount seriously. First/To begin with, 提醒涵义/原因/结果1,Second/What’s more, 提醒涵义/原因/结果2。

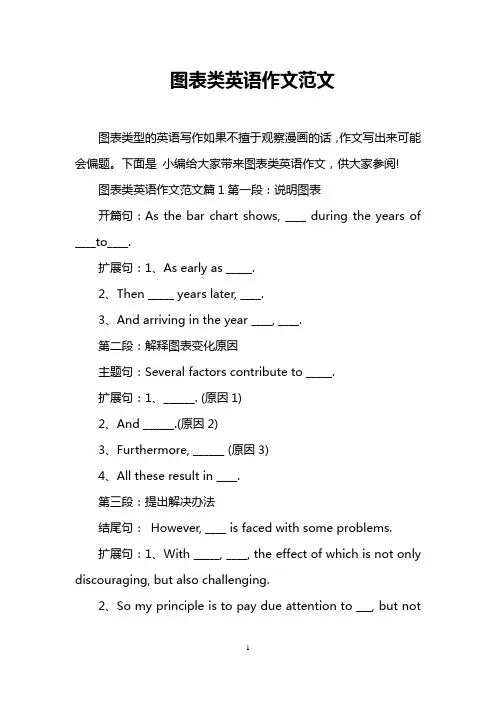
图表类英语作文范文图表类型的英语写作如果不擅于观察漫画的话,作文写出来可能会偏题。
下面是小编给大家带来图表类英语作文,供大家参阅!图表类英语作文范文篇1第一段:说明图表开篇句:As the bar chart shows, ____ during the years of ____to____.扩展句:1、As early as _____.2、Then _____ years later, ____.3、And arriving in the year ____, ____.第二段:解释图表变化原因主题句:Several factors contribute to _____.扩展句:1、______. (原因1)2、And ______.(原因2)3、Furthermore, ______ (原因3)4、All these result in ____.第三段:提出解决办法结尾句:However, ____ is faced with some problems.扩展句:1、With _____, ____, the effect of which is not only discouraging, but also challenging.2、So my principle is to pay due attention to ___, but notjustto____.示范第一段:说明图表开篇句:As the bar chart shows, the number of people below the poverty line decreased dramatically during the years of 1978 to1997.扩展句:1、As early as 1978, about 250 million people were under the poverty line.2、Then seven years later, the number became three fifths thatof1978.3、And arriving in the year 1997, the number was reduced to50millions.第二段:解释图表变化原因主题句:Several factors contribute to the sharp decrease of the below-poverty population.扩展句:1、The reform and opening following 1978 enabled the peasants to become much better off. (原因1)2、And with the development of Chinese economy, that policy also improved city dwellers lives greatly. (原因2)3、Furthermore, the high-tech introduced made it possible for the countrys economy as a whole to take off. (原因3)4、All these result in the great fall of theChinesepopulationbelow the poverty line.第三段:提出解决办法结尾句:However, a further decrease in the number of poverty-stricken people is faced with some problems.扩展句:1、With quite few employees being laid off, the effect of which is not only discouraging, but also challenging.2、So my principle is to pay due attention to the newcomers, but not just to care for the poor, say, in remote mountain areas.范文As the bar chart shows, the number of people below the poverty line decreased dramatically during the years of 1978 to 1997. Asearly as 1978, about 250 million people were under the poverty line.Then seven years later, the number became three fifths that of 1978.And arriving in the year 1997, the number was reduced to 50 millions.Several factors contribute to the sharp decrease of the below-poverty population. The reform and opening following 1978 enabled the peasants to become much better off. And with the development of Chinese economy, that policy also improved city dwellers lives greatly. Furthermore, the high-tech introduced made it possible for the countryseconomy as a whole to take off. All these result in the great fall of the Chinese population below the poverty line.However, a further decrease in the number of poverty-stricken people is faced with some problems. With quite few employees being laid off, the effect of which is not only discouraging, but also challenging. So my principle is to pay due attention to the newcomers, but not just to care for the poor, say, in remote mountain areas.图表类英语作文范文篇2The past years have witnessed a mounting number of Chinese scholars returning from overseas. As is lively illustrated by the column chart, the number of returnees climbed from a mere 69.3 thousand in 2008 to over 272.9 thousand in 2012, at an annual increase rate of around 50%.A multitude of factors may have led to the tendency revealed by the chart, but the following are the critical ones from my perspective. First and foremost, along with the development of Chinese economy and society, the number of Chinese studying abroad has been soaring in the past years, which has provided an expanding base for the number of returnees. In the second place, the government has enacted a series of preferential policies to attract overseas Chinesescholars back home. Last but not least, the booming economy, science and technology in this country have generated more attative job opportunites for scholars returning from overseas.The waves of returnees will definitely contribute to this nation’s development, since they have brought back not only advanced science and technology but also pioneering concepts of education and management. With more scholars coming back from overseas, and with the concerted efforts of the whole nation, we have reasons to expect a faster rejuvenation of this country.图表类英语作文范文篇3一、图表类型基本单词图表类型:table(表格)、chart(图表)、diagram(图标)、graph(多指曲线图)、column chart(柱状图)、pie graph(饼图)、tree diagram(树形图)、饼图:pie chart、直方图或柱形图:bar chart/histogram、趋势曲线图:line chart/curve diagram、表格图:table、流程图或过程图:flow chart/sequence diagram、程序图:processing/procedures diagram二、图表描述基本词语1、描述:show、describe、illustrate、can be seen from、clear、apparent、reveal、represent2、内容:figure、statistic、number、percentage、proportion三、常用的描述句型The table/chart diagram/graph shows (that)According to the table/chart diagram/graphAs (is) shown in the table/chart diagram/graphAs can be seen from the table/chart/diagram/graph/figures,figures/statistics shows (that)……It can be seen from the figures/statisticsWe can see from the figures/statisticsIt is clear from the figures/statisticsIt is apparent from the figures/statisticstable/chart/diagram/graph figures (that) ……table/chart/diagram/graph shows/describes/illustrates看过图表类英语范文的人还。
英文图表作文分析1.图表分析作文的种类图表就是数字、图像传达信息的一种形式,图表分析作文就是将这些数字、图像所包含的信息转换成传神表意的说明文字。
图表的种类很多,一般把各种数字资料,按照一定的顺序,通过表格形式表现出来的叫表(table),利用点、线、图等把信息资料通过图像表现出来的叫图(graph或chart),常用的图形有柱形图(bar graph),曲线图(line graph),圆形图(circular graph),图解图(diagram),饼形或百分比图(pie or percentage graph),象形图(pictorial graph),流程图(flow chart)等等。
2.图表分析作文的写作要领2.1. 读懂标题,然后根据主题进行分析。
虽然文章的中心思想和细节是通过图表来表示的,但同一张图表,如果命题不同,作者观察、分析问题的角度就有所不同,写出的短文也可能完全不同。
请看下面两个圆形图:上面两张图如果命题为“The Similarities and Differences of the Two Marketing Concepts”,本文可以首先对两张图分别进行说明,对两种观念的异同进行比较,然后得出结论;如果命题为“The Development of Marketing Concept”,本文的重点则偏重于市场营销观念的变化及其变化的原因。
写作时可首先指出两种观念的重点虽然明显不同,但后者显然脱胎于前者,然后再分析这种观念变化的原因。
请比较下面两篇文章:例文①:The Similarities and Differences of the Two Marketing ConceptsLet us take a look at the two circular graphs and compare the similarities and differences of the two marketing concepts.The concepts illustrated in Fig.1and Fig.2 are roughly the same in their main business mentality and tactics.Both are new and advanced concepts in business administration.Moreover,both lay stress on an orientation predominated by market demand.The latter,however,is also quite different from the former.First,the marketing focal point in Fig.1 is not the same as the in Fig.2.In the former,meeting consumers' needs and making a profit form the basis of business operations,while in the latter social long-term interests are also taken into account.Second,the former only considers two aspects of the problem in supplying products and services. But in contrast,the latter has to achieve a better balance between the three aspects—business profit,consumer demand and public social interests.Therefore,the latter is more advanced and more beneficial to social development.In addition,it has a more practical and revolutionary significance.例文②:The Developm ent of Marketing ConceptLet us take a look at the two circular graphs and analyze the causes for the development of marketing concepts.Fig.2 is quite different from Fig.1,but is obviously born out of Fig.1.The former refers to the concept predominated by market demand,whose stress is laid on the link between consumer demand and business profit,while the latter stands for the one led by society and market demand,which emphasizes the balance between social public interests,consumer demand and business profit.Some reasons may account for the development of marketing concept.First,consumer demand is not always in agreement with social long-term interests.For example,when household appliances with great power consumption do not accord with the demands of economy on electricity,companies should consider improving on the product from social long-term interests.Second,meeting consumer demand on short-term basis is no longer business standard of conduct.A company,which can meet bothconsumers current demands and social long-term interests is more welcomed.Finally,in commodity production,companies should pay attention to environmental protection and ecological balance,because they are closely related to consumers and society.It is just because of these that comes the development of marketing concept.2.2.仔细分析图表,尽可能正确理解图表的真正含义。
英语图表作文模板及范文(通用12篇)英语图表作文模板及范文第1篇The table/chart diagram/graph shows (that)According to the table/chart diagram/graphAs (is) shown in the table/chart diagram/graphAs can be seen from the table/chart/diagram/graph/figures,figures/statistics shows (that)……It can be seen from the figures/statisticsWe can see from the figures/statisticsIt is clear from the figures/statisticsIt is apparent from the figures/statisticstable/chart/diagram/graph figures (that) ……table/chart/diagram/graph shows/describes/illustrates图表类英语作文范文The past years have witnessed a mounting number of Chinese scholars returning from overseas. As is lively illustrated by the column chart, the number of returnees climbed from a mere thousand in 2023 to over thousand in 2023, at an annual increase rate of around 50%.A multitude of factors may have led to the tendency revealed by the chart, but the following are the critical ones from my perspective. First and foremost, along with the development of Chinese economy andsociety, the number of Chinese studying abroad has been soaring in the past years, which has provided an expanding base for the number of returnees. In the second place, the government has enacted a series of preferential policies to attract overseas Chinese scholars back home. Last but not least, the booming economy, science and technology in this country have generated more attative job opportunites for scholars returning from overseas.The waves of returnees will definitely contribute to this nation’s development, since they have brought back not only advanced science and technology but also pioneering concepts of education and management. With more scholars coming back from overseas, and with the concerted efforts of the whole nation, we have reasons to expect a faster rejuvenation of this country.更多培训课程:苏州个人提升英语更多学校信息:苏州虎丘区朗阁教育机构咨询电话:英语图表作文模板及范文第2篇Students tend to use computers more and more frequently nowadays. Reading this chart, we can find that the average number of hours a student spends on the computer per week has increased sharply. In 1990, it was less than 2 hours; and in 1995, it increased to almost 4 hours, and in 2000, the number soared to 20 hours.Obviously computers are becoming increasingly popular. There areseveral reasons for this change. First, computers facilitate us in more aspects of life. Also, the fast development of the Internet enlarges our demands for using computers. We can easily contact with friends in remote places through the Internet. Besides, the prices of computers are getting lower and lower, which enables more students to purchase them. However, there still exist some problems, such as poor quality, out-of-date designs and so on. And how to balance the time between using computers and studying is also a serious problem. Anyhow, we will benefit a lot from computers as long as we use them properly.英语图表作文模板及范文第3篇As can be clearly seen from the graph/table/chart (As is shown in the table/figure), great changed have taken place in_______, The_________ have/has skyrocketed/jumped from _____ to _____. When it comes to the reasons for the changes, different people give different explanations. Here I shall just give a begin with, ______What’s more,___________, Last but not least, ________. While it is desirable that ___________, there are still some problems and difficulties for __________ Firstly, __________ ,In addition, __________ ,In a word, __________ .以上就是为大家整理的英语专四图表作文范文模板,希望能够对大家有所帮助。
图表作文(一)第一节图表作文的类型图表作文可分为两大类:表作文和图作文。
表作文表格(Table)可以使大量数据系统化,便于阅读、比较。
表格常由标题(Title)、表头(Boxhead)(表格的第一行)、侧目(Stub)(表格左边的第一列)和主体(Body)部分(表格的其余部分)等部分组成。
如下表:用表格表达的信息具体准确,而且表格中的各项均按一定规律排列。
阅读表格时要注意找出表格中各个项目的相互关系,表格中各个项目的变化规律。
例如,上面的表格中的数字说明,和1978年相比,1983年大学入学的人数在增加,而小学的入学人数在减少。
搞清楚这些变化规律也就读懂了表格的内容。
图作文图作文又可分为三种:圆形图作文、曲线图作文和条状图作文。
(1) 圆形图作文圆形图(Pie chart)也称为饼状图或圆面分割图。
圆形图因为比较形象和直观,各部分空间大小差别容易分辨,所以常用来表示总量和各分量之间的百分比关系。
整个圆表示总量,楔形块表示分量。
有时圆形图还有数值表,两者结合可把各分量表示得更准确、清楚。
例如:This is a pie chart of the average weekly expenditure of a family in Great Britain. As can be see from the chart, the main expenditure of an average British family is spent on food, which accounts for 25% of its total expenditure. The next two significant expending items are transport and housing, which are 15% and 12%respectively. If we take into account clothing and footwear, which makes up 10%, the four essentials of life, that is, food, transport, housing, and clothing and footwear, amount to 62% of the total expenditure.(2) 曲线图作文曲线图(Line graph)也称为线性图或坐标图。