瑞幸咖啡PPT精选文档
- 格式:ppt
- 大小:2.58 MB
- 文档页数:22

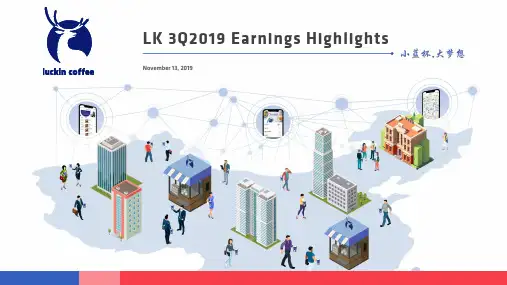
LK 3Q2019 Earnings Highlights November 13,2019DISCLAIMERThis presentation contains certain financial measures that are not recognized under generally accepted accounting principles in the United States(“GAAP”),including non-GAAP operating loss,non-GAAP net loss,non-GAAP basic and diluted net loss per ADS.For a reconciliation of these non-GAAP financial measures to the most directly comparable GAAP measures,please see the table captioned “Reconciliation of Non-GAAP Measures to the Most Directly Comparable GAAP Measures”in the earnings release.This presentation contains forward-looking statements.These statements are made under the“safe harbor”provisions of the U.S. Private Securities Litigation Reform Act of1995.These forward-looking statements can be identified by terminology such as“will,”“expects,”“anticipates,”“future,”“intends,”“plans,”“believes,”“estimates,”“potential,”“continue,”“ongoing,”“targets,”“guidance”and similar statements.Among other things,statements that are not historical facts,including statements about Luckin’s strategies and business plans,Luckin’s beliefs,expectations and guidance regarding the growth of its business and its revenue,the business outlook and quotations from management in this presentation,as well as Luckin’s strategic and operational plans,are or contain forward-looking statements.Luckin may also make forward-looking statements in its periodic reports to the U.S.Securities and Exchange Commission(the “SEC”),in press releases and other written materials and in oral statements made by its officers,directors or employees to third parties. Forward-looking statements involve inherent risks and uncertainties.A number of factors could cause actual results to differ materially from those contained in any forward-looking statement,including but not limited to the following:Luckin’s expected revenue growth; Luckin’s goals and strategies;Luckin’s future business development;Luckin’s ability to maintain the its reputation and brand;risks associated with increased investments in Luckin’s business and new business initiatives;risks associated with strategic acquisitions and investments;Luckin’s ability to retain or increase engagement of customers;Luckin’s ability to maintain or grow its revenue or business; changes in laws,regulations and regulatory environment that affect Luckin’s business operations;privacy and regulatory concerns; competition;security breaches;the continued growth of the coffee market in China and globally;risks associated with the performance of our business partners;and fluctuations in general economic and business conditions in China and globally and assumptions underlying or related to any of the foregoing.Further information regarding these and other risks is included in Luckin’s filings with the SEC.All information provided in this results announcement is as of the date of this results announcement and are based on assumptions that we believe to be reasonable as of this date,and Luckin does not undertake any obligation to update any forward-looking statement,except as required under applicable law.Business OverviewStore level operating profit (2)+12.5%store level profit margin (3)RMB186.3mnStore footprint3,680 stores (4)+717 net new stores QoQCumulative transacting customers (5)~30.7mn+7.9mn new customers QoQFinancial MetricsOperational MetricsQ3earnings highlights: strong performance across all key metricsAverage monthly total items sold (6)~44.2mn items+470.1% YoY increaseTotal net revenues from products (1)RMB1,493.2mn+557.6%YoY increaseNotes:(1)Calculated as the sum of net revenues from freshly brewed drinks and net revenues from other products(2)Calculated by deducting cost of materials, store rental & other operating costs and depreciation expenses from net revenues from freshly brewed drinks and from other products (3)Calculated by dividing store level operating profit by total net revenues from products (4)Number of stores as of September 30th , 2019Average monthly transacting customers (7)~9.3mn+397.5% YoY increaseHigh growth with significant improvement in efficiencyNotes:(1)The number of average monthly transacting customers in the three months during the quarter(2)Calculated by dividing the total number of items sold during the quarter by three+209.5%YoYNumber of stores+397.5%YoYAverage monthlytransacting customers (1)+470.1%YoYAverage monthly totalitems sold (2)+557.6%YoYTotal net revenues fromproducts (3)More customersper storeMore items percustomerHigher net effectiveselling price per itemContinued strategic investments in brandingBranding initiatives forLuckin TeaContinued investments inLuckinCoffeeNew spokesperson forLuckinCoffeeBrandadvertisingNew spokespersonfor Luckin TeaFor Luckin Tea storesand partnership modelFor Luckin TeaproductsNASAstoreChinaOpenLuckin Tea has seen strong growth since launchMilk & milk teaseriesBoBo tea seriesTea macchiatoseriesFruit tea seriesCalpis fruit teaseriesNo. of cups sold grew~8.8x in the past 5months (2)Tested in April 2019in 2 cities Launched in July 2019 nationwide28products 5categories (1)Luckin’s AdvantagesCustomer base Store footprintSupply chainBenefits to LuckinProfitabilityCustomer retention Storethroughput High qualityHigh affordability High convenienceIntroducing Luckin Tea storesSupported by the sametechnology & supplychain networkWe aim to become China’s largest freshly made tea playerFirst store opened in Oct 2019Product focus Geographic focus Store operationTea focused(fewer coffee SKUs)Coffee focused(fewer tea SKUs)More economicallyvibrant regionsNationwide(incl. lower-tier cities)Mainly self-operatedstoresMainly viapartnership modelUser accountslinked acrossapps Expand coverage and deepen penetration in lower-tier citiesOffer more products to serve more consumption scenariosCultivate consumption habit for coffee in lower-tier citiesIntroducing our New Retail Partnership modelResponsibilitiesCustomersSupply chain ProductsTechnologyResponsibilitiesRenovationStore staffSite rentalDaily operationFasterexpansionMore customers,more coverageRevenue &profitabilityBenefitsTech-empowered easystore managementBrandingsupportCustomers trafficBenefitsNew retailpartnerNo initial fee to LuckinHow revenue sharing worksStore revenueTo new retail partnerTo LuckinRevenueTiered revenue sharingLower risksLower capex &opexFaster expansion More customers Asset-light approachContinue to enrich product offerings……Selected non-coffee product categoriesNutsJuicesJuice bottling plantjoint venture with LDCCupsHigh quality spill proofstraw tumblersPercentage of non-coffee items sold30.9%34.8%44.9%20181H20193Q2019Sustainable advantages creates a virtuous cycleLower costsLower pricesMore customersMore data and More storesMore productsHigher convenienceHigher frequency Sustainable advantagesOperationsTechnologyCapitalHigh entry barriersFirst-mover advantagesCost structureCustomer experienceStore networkFinancial Results OverviewStrong momentum across all key metricsAverage monthly items sold (2)4884,0017,76017,64516,27627,59344,2451Q20182Q20183Q20184Q20181Q20192Q20193Q2019(thousands)Number of stores2906241,189 2,0732,3702,9633,680As of 1Q2018As of 2Q2018As of 3Q2018As of 4Q2018As of 1Q2019As of 2Q2019As of 3Q2019Cumulative number of transacting customers (1)(thousands)4852,9185,98412,53016,87222,77730,724As of 1Q2018As of 2Q2018As of 3Q2018As of 4Q2018As of 1Q2019As of 2Q2019As of 3Q2019+24%+60%+35%Non-GAAP net profit margin (2)(274.1%)(201.0%)(139.8%)(113.6%)(67.2%)(31.9%)1Q20182Q20183Q20184Q20181Q20192Q20193Q2019(1,020.8%)Store level profit margin (1)(75.0%)(55.5%)(45.5%)(44.3%)(6.4%)12.5%1Q20182Q20183Q20184Q20181Q20192Q20193Q2019(206.1%)Store level profit ahead of guidanceStore level break-even pointProduct revenue beat our Q3 guidance as a result of strong business fundamentals10 101 193 347 361 6591,145183********34821314273339481Q20182Q20183Q20184Q20181Q20192Q20193Q2019Net revenues breakdown and growth893%108%93%2%95%72%QoQ YoY---3955%698%558%Key driversAverage monthly transacting customers (3)QoQ Increase ~51%YoY Increase~397%9.3mn1Average monthly items per transacting customer (4)QoQ Increase~6%YoY Increase~15%4.7 items2Net selling price per item (5)QoQ Increase ~7%YoY Increase~15%11.2 RMB3(RMB millions)Net revenues from freshly brewed drinks Net revenues from other products Others (1)Average product revenue per store per quarter (2)732382502692003264501Q20182Q20183Q20184Q20181Q20192Q20193Q2019(RMB thousands)YoY---173%37%79%Product revenue growthBreakdown of total revenueMaterial improvement in cost structureOperating expenses as a percentage of net revenues from productsCost of materials (1)Store rental & other operating costs (1)Depreciation expenses (1)Sales and marketing expenses (2)General and administrative expenses (2)Store preopening and other expenses (2)85.8%69.5%66.8%67.4%62.0%53.5%48.3%1Q182Q183Q184Q181Q192Q193Q19184.2%91.7%76.0%64.7%63.4%42.7%32.0%1Q182Q183Q184Q181Q192Q193Q1936.1%13.7%12.7%13.4%18.9%10.2%7.3%1Q182Q183Q184Q181Q192Q193Q19146.5%93.5%61.9%35.1%42.9%36.2%1Q182Q183Q184Q181Q192Q193Q19Operating expenses as a percentage of total net revenues420.0%61.7%49.1%31.7%36.1%29.2%16.0%1Q182Q183Q184Q181Q192Q193Q19301.2%17.5%12.4%7.7%4.7%1.9% 1.4%1Q182Q183Q184Q181Q192Q193Q1985.6%Further reduction in unit costs driven by material increase in # of items sold per storeOne cup costs –freshly brewed drinksNotes:(1) Calculated as (cost of raw materials of freshly brewed drinks + free product promotion expenses) / number of freshly brewed drinks sold + (low value consumables + storage fees + logistic fees + store rental + payroll + utilities and other store operating expenses + depreciation expenses) / number of total items soldOne cup costs (1)(RMB)28.018.116.413.013.311.19.71Q20182Q20183Q20184Q20181Q20192Q20193Q20191.60.53Q20183Q2019Low value consumables,logistic, storage 7.43.63Q20183Q2019Store rental and operatingexpenses 6.14.83Q20183Q2019Cost of raw materials (3)1.20.83Q20183Q2019Depreciation (5)(4)(6)Cost breakdown per cup(RMB)(RMB)(RMB)(RMB)Reduction of wastageEnhancedbargaining powerEconomies of scaleEnhancedbargaining powerOperating efficiency More items sold per store per dayMore efficient staff schedulingHigher operating efficiency More items sold per store per dayNumber of items per store per day (2)1092922853612443454441Q20182Q20183Q20184Q20181Q20192Q20193Q2019Decreasing importance of delivery orders2.32.72.31.81.30.80.51Q20182Q20183Q20184Q20181Q20192Q20193Q2019Delivery subsidy per item (1)Percentage of delivery orders61.7%62.2%51.4%40.8%27.7%19.8%12.8%1Q20182Q20183Q20184Q20181Q20192Q20193Q2019(RMB)Strategic investment in branding resulting in increase in new transacting customers and higher repeat spending15.811.89.310.1 6.9 6.5 6.587.742.942.314.910.141.648.7103.554.751.625.0 16.9 48.155.21Q20182Q20183Q20184Q20181Q20192Q20193Q2019New customer acquisition costs(RMB)New transacting customers (in millions)0.52.43.16.54.3Transaction value per customer (based on listed price) (3)102030405060708090100M0M1M2M3M4M5M6M7M8M9M10M11M12M13M14M15M16M17M18M19M20Jan 18Feb 18Mar 18Apr 18May 18Jun 18Jul 18Aug 18Sep 18Oct 18Nov 18Dec 18Jan 19Feb 19Mar 19Apr 19May 19Jun 19Jul 19Aug 19Sep 19(RMB)5.97.9Free product promotion expenses (1)Other new customer acquisition costs (2)Continued reduction in net cash used in operations and strong liquidity positionNet cash used in operating activities(720)(375)(123)3Q20182Q20193Q2019(RMB millions)Capex (1)(326)(212)(352)3Q20182Q20193Q2019(RMB millions)Total liquidity (2)1,1196,0515,544As of 3Q2018As of 2Q2019As of 3Q2019(RMB millions)Q&A。


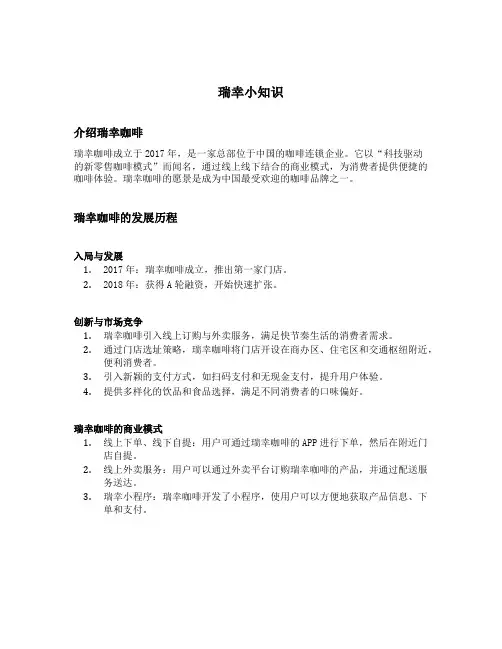
瑞幸小知识介绍瑞幸咖啡瑞幸咖啡成立于2017年,是一家总部位于中国的咖啡连锁企业。
它以“科技驱动的新零售咖啡模式”而闻名,通过线上线下结合的商业模式,为消费者提供便捷的咖啡体验。
瑞幸咖啡的愿景是成为中国最受欢迎的咖啡品牌之一。
瑞幸咖啡的发展历程入局与发展1.2017年:瑞幸咖啡成立,推出第一家门店。
2.2018年:获得A轮融资,开始快速扩张。
创新与市场竞争1.瑞幸咖啡引入线上订购与外卖服务,满足快节奏生活的消费者需求。
2.通过门店选址策略,瑞幸咖啡将门店开设在商办区、住宅区和交通枢纽附近,便利消费者。
3.引入新颖的支付方式,如扫码支付和无现金支付,提升用户体验。
4.提供多样化的饮品和食品选择,满足不同消费者的口味偏好。
瑞幸咖啡的商业模式1.线上下单、线下自提:用户可通过瑞幸咖啡的APP进行下单,然后在附近门店自提。
2.线上外卖服务:用户可以通过外卖平台订购瑞幸咖啡的产品,并通过配送服务送达。
3.瑞幸小程序:瑞幸咖啡开发了小程序,使用户可以方便地获取产品信息、下单和支付。
瑞幸咖啡的品牌文化瑞幸咖啡致力于打造年轻、时尚、高品质的品牌形象,其品牌文化凸显了以下特点:### 以科技为驱动瑞幸咖啡充分利用科技手段,提供更便捷的咖啡消费体验。
通过瑞幸APP和小程序,用户可以轻松地下单、支付和获取优惠信息。
服务的极致追求瑞幸咖啡注重为顾客提供优质的服务。
员工接受严格的培训,以确保他们能够提供友好、高效和专业的服务。
社会责任感瑞幸咖啡积极参与公益事业,关注社会问题。
企业经常组织和支持各种环保和慈善活动,倡导可持续发展。
瑞幸咖啡的发展前景瑞幸咖啡在中国的咖啡市场中积极拓展。
以下是瑞幸咖啡的发展前景: 1. 咖啡消费市场增长:中国人对咖啡的需求不断增加,咖啡市场潜力巨大。
2. 品牌知名度提升:瑞幸咖啡通过持续的品牌推广和市场推广活动,提升了品牌知名度。
3. 营销策略创新:瑞幸咖啡不断创新营销策略,吸引更多消费者,提高用户留存率。
瑞幸咖啡ppt模板_创建和使用模板整理表姓名:职业工种:申请级别:受理机构:填报日期:创建和使用模板在默认情况下,你所启动的每个项目都是基于一个模板之上的。
模板决定了新的项目将会有怎样的设置,例如测量单位,建筑位置设置。
模板中甚至可以包括建筑元素,以及一组完整的带有自定义标题模块的工作表。
您只需要简单的将其保存在模板目录中,就可以抛开任何绘图,创建模板了。
想要在新的绘图中使用模板,您需要在开始选项中选择模板。
创建模板1 除非你已经创建了你想要作为模板使用的绘图,否则你需要启动一个新项目(“文件”>“新建”)2设定好你想要在模板中保存的设置,例如建设地点设置和程序设置。
请注意绘图中的所有元素都将被保存下来,除非你想在新的项目中使用这种元素,否则请将其删除。
提示:您可以插入边框及标题模块(在模型视图或工作表视图中),并填写好文字部分以节省时间3 选择“文件”>“另存为”4 在“另存为”对话框中,找到程序中的“模板”文件夹。
在默认状态下,你可以在一下的地点中找到:在Windows 7 或 Vista系统中:C:\ProgramData\Cadsoft\Envisioneer 6\Templates在Windows XP系统中:C:\Documents and Settings\All Users\Application Data\Cadsoft\Envisioneer 6\Templates5 在“文件名称”编辑框中,为模板键入一个名字。
6 点击“保存”在新项目中使用模板在创建完新的模板之后,你可以开始在新的项目中使用它了。
1 选择“设置”>“程序设置”2 在总页中,请确保“启动时使用项目模板”被启用3 点击模板下拉框旁边的“浏览”按钮黄框:点击这里选择你的模板4 在“打开”对话框中,选择你要使用的模板,单击“打开”5 在“程序设置”对话框中单击OK。
现在当你启动新的项目时,这个项目就会基于新的模板之上了附件1:教学设计模板微格教案精品课程上传资料格式说明一、Word格式资料上传说明1.大纲的Word文档的格式要求参照《关于修订本、专科网络课程教学大纲的通知》附件格式。