高考英语作文专题复习-图表类说明文
- 格式:ppt
- 大小:1.55 MB
- 文档页数:21
高考英语图表类作文写作技巧讲解一、考点分析图表作文以说明文和议论文为主。
考查时要求学生根据所给的图表、数据等进行分析,阅读文字和说明,然后组织语言进行写作,得出令人信服的结论,必要时还要加入个人观点。
二、专题详解1)文体一:说明文文体特点:(重事实)说明文是以说明为主要表达方式,用简洁明了的语言来解释说明事物,阐明事理。
它要求语言要简明扼要,客观准确。
框架:第一段:概括说明内容常用的词有:1.table, a pie chart饼图, a bar chart柱状图, graph, survey, picture2.describe, show, represent, illustrate, reveal,3. figure, statistic, number, percentage, proportion常用的开篇句型(即概述图表内容时常用的表达法):1.The graph/chart/table above shows / describes / illustrates that...2. From the above graph/chart, it can be seen that…3. As shown in the graph / survey, …4.The chart/table shows the differences between…5. I launched an inquiry into… / I conducted a survey on… / to…第二段:描述变化情况并分析引起变化的因素A. 写作关键:1.对比分析,寻找数据的变化规律;2.筛选数据这些数据是否具有典型代表性、是否需要一一列出?一般而言首尾数字以及增减值是必需的;3.强调数据间的关系,突出变化。
B. 常用词汇和套语:a.描写数据变化常用套语:增加:1.There was a great / stable / slight increase /rise in…倍数:2.The number /rate has nearly doubled, compared with that of last year.3.The number is …times as much as that of….保持不变:4.In 1985, the number remained the same.减少:5. There was a gradual/sharp decline in 1989.分别列举:6. The numbers / percentages are… and…respectively.b.说明因果关系表示原因:as / since / due to / owning to / thanks to / because (of)进一步解释:that is to say / to put it another way表示结果:therefore / thus / as a result ( consequence), so that提示例证:(take…)for example / instance, …such as (一般不用于句首),常用套语:提出第一个原因:The first reason can be seen by every person.The first and most impo rtant reason / One of the premier causes is that…解释某一种现象:…is the cause of ……mainly / partially contribute(s) to the tendency of……account(s) for the fact / phenomenon…总括性解释原因:There exist… reasons, which may account for this difference.The reasons for the phenomenon may be as follows:There are several causes for this significant growth in….例证:This point can be confirmed by the fact / example of + nn + is a case in point.第三段:总结归纳/提议/提出解决办法结尾常用套语1.In my opinion / Perso nally / As far as I’m concerned2.In short/ In brief/ In a word/ In conclusion /In summary/ To sum up,3. From what has been discussed above, we can draw the conclusion that…4. Obviously, if we want to…, it is necessary…/ There is no doubt that atten tion must be paid…2)文体二:议论文文体特点:(重说理)议论文是以议论为主要表达方式的一种文体。
高考英语指导写作专题:图表说明文一,图表说明1,分类:数字表、函数关系图、曲线图(graph);表格(table);几何图形(figure);图形表、饼状图(pie chart);条状图、柱状图(bar chart);平面图、示意图、外形图(diagram)。
2,一般可分三个层次来写:按照题目要求描述图表反映的总情况,即概括大意。
对数字进行仔细的比较,抓住特点进行分析、归纳并找出产生变化的原因。
读图表后的想法、结论、评论或针对反映出的问题采取的解决措施。
二.表达方式:1,常用的描述句型The table/chart/diagram/graph shows that ...According to the table/chart/diagram/graph...As is shown in the table/chart/diagram/graph...As can be seen from the table/chart/diagram/graph/figures...We can see from the figures/statistics...It is clear/ apparent from the figures/statistics...2.图表中数据(data)的具体表达法数据(data)在某一个时间段固定不变:fixed in time在一系列的时间段中转变:changes over time增加:increase/raise/rise/...减少:decrease/grow down/drop/fall/decline稳定:remain stable3.描写变化的形容词及副词rapid/rapidly,dramatic/dramatically,significant/significantly,sharp/sharplysteep/steeply,steady/steadily,gradual/gradually,slow/slowly,slight/slightly三、写作模板As (is) shown/indicated by the figure/in the table/graph/pie chart/chart,_____ has been increased/decreased significantly/steadily from _____ to_____. From the sharp decline/rise in the chart,it goes without saying that_____.There are at least two reasons accounting for / contributing to ____. On the one hand, _____ On the other hand, _____. _____is due to the fact that_____. In addition,_____is responsible for_____. Maybe there are other reasons to show. But it is generally believed that the above mentioned reasons are commonlyconvincing/persuasive.As far as I am concerned,I hold the view that_____. I am sure my opinion is both sound and well-grounded.四,作文范例1,最近你校对中学生的消费情况进行了调查。

图表型说明文英语范文英文回答:## The Power of Charts: Unveiling the Insights in Data.Charts are visual representations of data that simplify complex information and make it more accessible and understandable. They play a crucial role in data analysis, enabling us to identify patterns, trends, and relationships that would otherwise be difficult to discern from raw data alone.### Types of Charts.There are numerous types of charts, each suited to specific data types and analysis purposes. Some common types include:Bar charts: Represent data as vertical or horizontal bars, with the length of the bars indicating the value ofthe data points.Line charts: Connect data points with lines, showing the trend or progression of data over time or with respect to other variables.Pie charts: Divide data into slices representing different categories' proportions.Scatter plots: Plot individual data points as dots on a coordinate plane, highlighting the relationship between two variables.Histograms: Display the distribution of data bydividing the range into bins and showing the frequency of occurrence within each bin.### Benefits of Using Charts.Charts offer several advantages over raw data:Improved comprehension: Visualizing data makes iteasier to understand patterns, trends, and relationships than reading numerical tables.Easy identification of outliers: Charts can highlight unusual data points that may represent errors orsignificant deviations from the norm.Facilitate comparisons: Charts allow for quick and easy comparisons between different datasets or data subsets.Enhance presentations: Charts can make presentations more visually appealing and engaging, enhancing the audience's understanding of the data.### How to Create Effective Charts.Creating informative and visually effective charts requires careful attention to the following principles:Choose the right chart type: Select the chart type that best suits the data and analysis objectives.Use clear labels: Label axes, titles, and legendsclearly and concisely to guide readers through the chart.Ensure appropriate scale: Use a scale that accurately represents the range of data and avoids distorting the patterns.Highlight important features: Use color, size, or other visual cues to emphasize key insights or areas of interest.### Conclusion.Charts are a powerful tool for data analysis and communication. They transform complex numerical data into visual representations that reveal insights, facilitate understanding, and support informed decision-making. By understanding the different types of charts, their benefits, and best practices for creating them, we can harness the power of charts to unlock valuable insights from data.中文回答:## 图表的力量,揭示数据中的见解。

毛额市鹌鹑阳光实验学校高考英语作文指导之图表说明文一、图表说明文的常见类型1.以表格形式,将统计的数据或被说明的事物直接用表格形式体现出来2.表示数据的大小或数量之间的差异的柱状图3.表示数据变化的曲线图4.表示总体内部结构变化的扇形图二、图表作文的一般结构:建议用三段式作文三、图表类说明文的写作结构:第一段:开门见山地点明本图表所反映的主题, 即conclusion.第二段:分析数据间的主要差异及趋势,然后描写(在描写数据间变化及总趋势特征时,可采用分类式或对比式以支持主题,并阐明必要的理由)。
注意层次。
第三段:归纳总结或发表评论四、写作步骤:1.审题(四确定)1)确定类型2)确定体裁3)确定主体时态4)确定主体人称2.列要点3.依要点, 拟草纲, 组织成句.4.构篇章,扩句成文.5.检查润色6.书写五、图标说明文常用词句。
1.常用词汇:table(表格, 项目表), chart(图表), graph(图表, 曲线图),figure(数据),rate (比列,比率),make a survey about…(做关于…的调查) , describe, tell, show, represent, Obviously/Apparently (很明显地),rise,increase(增多,增加),climb,go up, fall,decline(下降),decrease(减少,减低),drop,go down, ….2.常用句型:1).The rate of … is2).There was a great /slight increase /rise in…3).The main reason is that ….4).The rate dropped slightly from 38%in… to 31% in…5). By comparison with…, it decreased/increased/fell from…to…6). From Chart 1, / According to Chart 2, /As is shown on Chart 1,7)Besides/ What’s more/What’s worse.8)In a word/In short/ Generally speaking /In summary/ As faras I am concerned.3.单句训练:1.由表1,我们可以看出……2.最近的一项关于人们怎样度假的调查表明。

专题三:图表作文【命题规律】从近几年高考真题来看,图表作文体裁多为议论文、应用文和说明文,内容涉与前后变化比照等方面。
要求考生通过数据分析,表达图表含义,得出合理结论。
其考查形式有表格式和图形式两种。
其中图形式又有三种情况:①表示数据变化的曲线图,②表示数据的大小或数量之间差异的柱状图,③表示总体内部结构变化的饼状图。
图形式的题目多为说明文。
【备考策略】1.描述图表内容特别是图表中的变化趋势.(先总的变化趋势,后重点用第一、中间、最后几个数据阐述总的变化趋势〕2.解释某一变化的原因〔主题句+细节的阐述模式〕3.作出结论或提出解决问题的方法对策。
【必备模板】一、表格类As shown in the chart, We can see that表格内容123 .From the figure in the chart, we can come to a conclusion that结论. There are many reasons responsible for this instance, and the following are the typical ones. First , 原因一 . Besides,___原因二 .Finally, 原因三 .As far as I am concerned,I hold the point that of view that 自己的观点_____.二、图形类According to the graph given above, it can be seen clearly that there was a slight/slow/gradual /small/ steady drop (decline/ fall /reduction/decrease) in_______.〔如果是数据上升如此用:There was a sudden/ dramatic/ large/ rapid/ sharp rise in ______.〕Judging from these figures,we can draw the conclusion that结论.There are two/three reasons why this happened.For one thing,原因一.For another,原因二.In addition,原因三 is also responsible for it.It’s high time that we should提出解决问题的方法与对策。
图表作文1.Directions: Write an English composition in 120-150 words according to the instructions given below in Chinese.当今社会,短视频已成为高中生获取信息的渠道之一,日前,某网站对某地高中生使用短视频的现状作了调查,结果如下:请简单描述该图表,并结合自身或他人情况,谈谈你的看法。
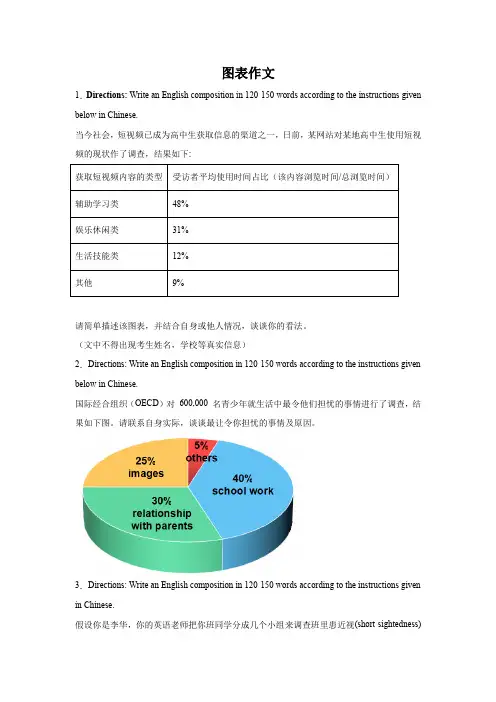
(文中不得出现考生姓名,学校等真实信息)2.Directions: Write an English composition in 120-150 words according to the instructions given below in Chinese.国际经合组织(OECD)对600,000 名青少年就生活中最令他们担忧的事情进行了调查,结果如下图。
请联系自身实际,谈谈最让令你担忧的事情及原因。
3.Directions: Write an English composition in 120-150 words according to the instructions given in Chinese.假设你是李华,你的英语老师把你班同学分成几个小组来调查班里患近视(short-sightedness)的同学的人数和原因。
你们小组调查后做了如下图所示的统计,请分析下面的饼状图,并谈谈你的看法及建议。
注意:1. 词数100左右;2. 可以适当增加细节,以使行文连贯。
_______________________________________________________________________________ _______________________________________________________________________________ _______________________________________________________________________________ _______________________4.Directions: Write an English composition in 120-150 words according to the instructions given in Chinese.下列图表反映的是某高中2010年与2013年学生健康状况调查的部分数据,请你用英语为某报写一份报告,反映你校三年间学生健康状况的变化情况,分析其中原因,并提出一些改进措施。
高考英语作文指导之图表说明文一、图表说明文的常见类型1以表格形式,将统计的数据或被说明的事物直接用表格形式体现出来2表示数据的大小或数量之间的差异的柱状图3表示数据变化的曲线图4表示总体内部结构变化的扇形图二、图表作文的一般结构:建议用三段式作文三、图表类说明文的写作结构:第一段:开门见山地点明本图表所反映的主题, 即concuion第二段:分析数据间的主要差异及趋势,然后描写(在描写数据间变化及总趋势特征时,可采用分类式或对比式以支持主题,并阐明必要的理由)。
注意层次。
第三段:归纳总结或发表评论四、写作步骤:1.审题(四确定)1)确定类型2)确定体裁3)确定主体时态4)确定主体人称2列要点3依要点, 拟草纲, 组织成句4构篇章,扩句成文5检查润色6书写五、图标说明文常用词句。
1常用词汇:tabe表格, 项目表, chart图表, grae menta 精神上,智力上unheathTo imewor On in thi wa can tudent get eanwhie同时; 其间 from being nearighted oved, tudent can then eea menta heath3假如你是李华。
你将代表学校参加国际中学生论坛,就你城市的教育状况发表演讲。
请根据以下两幅图表,介绍你市高中生的构成情况及毕业去向的选择,并针对两幅图表中的任何一个数据所反映的情况发表你自己的看法。
Ladie and gentemen,I’m Li Hua Toda, I’m great honoured to choo I’m going to ta about the high choo education of m citFrom chart1, we can ee high choo tudent are from different fami bacground Beide oca tudent, who mae u intend to go to univeritie Thirt ic deveoore foreigner are attracted to et uore about China and Chinee cutureI beieve the future of the education in our cit i iing有希望的, 有前途的That’ a Than a。
![高三英语书面表达复习资料---图表类作文2012[1]](https://uimg.taocdn.com/9d24b32ca5e9856a56126022.webp)
高三英语二轮复习讲义-----图表类作文图表作文实际上就是将图片或表格中的信息转化成作文的一种形式,在写作的过程中,首先要求我们仔细看图片和表格,理解他们所隐含的意义和内容,通过图表抓住文章的主题。
图表作文可分为图和表两类。
“图”有组图(记叙类)、对比图、单张图画(漫画评论类)3类。
组图有点像连环画,一般有多幅图片构成,这类作文接近于记叙文。
对比图要求观察出两幅或者三幅图之间的不同,并分析产生这种变化的原因。
单张图画通过生动的图画传递深刻的思想,需在描述图片的基础上发表感想或分析问题,这一类作文类似于议论文。
看图作文要求学生根据图画所提供信息叙述事情并发表感想。
此类作文留给学生的发挥空间较大。
看图作文的写作技巧和步骤:1.认真看图,确立主题。
2.围绕主题,提炼要点。
3.合理想象,补充要点。
4.确定时态,译出要点。
5.连句成篇,自然过渡。
“表”可分为表格,柱状图,饼状图及折线图。
表格形式要求考生对表格中所给出的大量数字进行比较分析,从中找出其变化规律。
曲线图(折线图)形式要求考生认真观察坐标系所显示的数据信息,并且密切注意交汇在坐标横轴和纵轴上的数字及单位。
柱状图形式要求考生通过宽度相等的柱形的高度或长度差别来判断事物的动态发展趋势,因此考生应密切关注坐标线上的刻度单位及图表旁边的提示说明与文字。
饼状图形式旨在要求考生准确理解并阐述一个被分割成大小不等切片的圆形图所传达的信息。
考生应清楚掌握部分与整体,部分与部分之间的相互关系,这种关系通常是以百分比的数字形式给出的。
此类作文一般分为以下三段:第一段:概述图表反映的主题思想;第二段:分析产生的原因;第三段:展望未来或提出办法或建议。
一写作模板(1) 组图写作模板The story took place 时间和地点.事件起因(要点一,图片一的内容). 事件的发展(要点二、三……,图片二、三…… 的内容). 事件结局(最后一个要点,最后一张图片的内容)From the story, I feel自己的看法或感想.(2)对比图写作模板Great changes have taken place in地点since时间.In the past, 描述过去的情景(图片一的内容). But now our village/school/city is takingon a new look. 描述现在的情景(图片二的内容).There are many reasons for the great changes. First, 变化的第一个理由. Second, 变化的第二个理由. Third, 变化的第三个理由…Last but not least, 变化的最后一个理由.I think自己的感想.(3)单张图写作模板As can be seen in the picture, 图画内容. The picture tells us概括图片大意.The implied meaning of this picture should be taken into consideration seriously. To begin with, 揭示涵义/原因/结果1. Second, 揭示涵义/原因/结果2.In my opinion/ As for me, we should take some measures to deal with the problem. First , we should具体措施1. Second, we must具体措施2. Only in this way can we solve the problem of 图画内容.(4)图表作文模板As is shown/ indicated/ illustrated by the figure/ percentage in the table/ graph/ chart/ pie, _____________ (作文题目的议题)has been on rise/ decline, significantly/ dramatically/steadily rising/ decreasing from ________ to _______. From the sharp/ marked decline/rise in the chart, it goes without saying that ____________________.There are at least two reasons accounting for _______________. On the one hand, ______________. On the other hand, ___________ is due to the fact that ______________. In addition, ___________ is responsible for _______________. Maybe there are some other reasons to show________________. But it is generally believed that the above mentioned reasons are commonly convincing.As far as I am concerned, I hold the point of view that______________________.二范文(1)组图组图通常呈现一件事情发生的始末,考生要根据几幅图的先后顺序介绍事情的全过程。

图表类作文写作指导纵观近年来全国各地的高考试题及模拟试题,图表类作文是写作部分的常见题型之一,体裁多为议论文和说明文。
议论文通常要求考生通过分析图表中的数据,就图表中所反映的问题阐述自己的观点,并得出自己的结论(如04年北京卷及06年湖北卷);说明类作文要求考生通过图表所列举的变化对比及产品介绍等,对图表进行描述(如04年浙江卷)。
一.写作步骤:1.仔细阅读图表,了解图表所达的内容。
首先,用一句话概括图标的内容;其次,仔细描写图表.在限制性写作中,图表的描述应当详细些;而对于半开放式作文,应抓住图标所反映的规律以及趋势进行阐述即可.2。
描写图表所反映的问题或规律这一部分可以遵循这样的格式:主题句+扩展句+(结尾句)(1)所谓主题句:就是一个段落的中心思想句(往往位于句首,英语写作讲究开门见山)。
(2)所谓扩展句:就是支持论证主题句的句子。
考生通常采用的是说理论证、举例说明,如for example/instance; first, second;firstly,secondly;等.(3)所谓结尾句:就是来总结陈述主题句的句子。
(视情况而定,也可以不写)3. 如果是限制性写作,结尾部分简单得出结论即可。
对于半开放式作文,应该表述自己的观点,结束全文。
(1)如果图表反映的是好的现象,首先要肯定、发表观点最后预测未来;(2)如果图表反映的是不好的现象,首先要否定、提出解决办法或建议二.写作实用表达:(一)点明主题常用的词有:1.table,chart, figure,graph, 2.describe, show,represent 等等。
(二)分析差异描写变化及总趋势特征、分析差异:数据说明常用套语:在描写变化及总趋势特征时,可采用分类式或对比式以支持主题,并阐明必要的理由。
1.There was a great /slight increase /rise in…2。
The number /rate has nearly doubled,compared with that of last year. 3。
高考英语作文复习--图表类作文专题讲解第一类:图表类作文写作步骤:1.点明图表所反映的主题。
常用词汇:table, chart, figure, graph, describe, tell,show, represent等2.分析数据差异及趋势或者描写数据代表内容。
注意层次。
常用词汇:rise,increase, drop, reduce, decrease, fall. but, on the contrary, however, the same as, be similar to, be different from 等3.归纳总结或发表自己看法。
常用词汇:in a word, in short, to sum up, We candraw the conclusion that……等。
重点句子:一.引入话题1.It can be seen from the table that….2.As is indicated in the chart,….3.From the sharp rise (上升n.) / decline (下降n.) in the chart, it goes withoutsaying that….(不用说…)4.It has gone up(上升) / fallen / dropped(下降) considerably in recent years.二.描述变化或原因1.表示递进what’s more, besides, in addition, furthermore, to makematters worse, what’s worse (更糟糕的是)2.表示解释account for , that is to say, mean, in other words3.表示变化---快速上升rise (increase / go up ) sharply (quickly, rapidly)Eg: The number sharply went up.---缓慢下降decrease (reduce/ come down/ decline/ drop/ fall) slowly---表示对比compare with , contrary to, on the contrary4.描述多重原因---There are several reasons behind the situation reflected in the above table. First of all, ……; More importantly,…….; Most importantly,……..;---There are at least two good reasons accounting for this phenomenon. On one hand,…….; On the other hand,………; In addition,…. is responsible for….三.总结或评论1.Personally speaking, in a word, in conclusion,2.It can be concluded that….(可以得出结论,)3.From the above discussion, we have enough reasons to predict what will happenin the near future.4.The trend described in the table will continue for quite a long time if necessarymeasures are not taken.5.As far as I’m concerned, I hold the view that……6.I’m sure my opinion is both sound and well-grounded. (既合理又理由充分)写作模版:1.分析图表数字代表内容Ascan be seen from the chart, _____________________(话题).Different people hold different opinions on this matter.Obviously, the majority of the people believe that ______________. However, others (20%) consider that_______________. Besides, another 5% hold the view that_______________.As far as I am concerned, we should pay more attention to __________. On one hand, ________________. On the other hand, __________________.2.分析数字反映的原因As can be seen from the chart, ____________________(话题). Different people hold different opinions. About 60% of the people ____________, while 25% of the people ______________.The least people, accounting for 15%, _______________.Various reasons are responsible for their different choices. To begin with, ___________. What’s more, ______________.Besides, _____________.As far as I am concerned, I am in favor of the view that_____________. I believe that ___________________.或As far as I am concerned, despite such problems, I hold the view that we should ________________. Only in this way can we _______________.图表类作文实战1:下面的图表显示了你们学校高三学生周末放假的学习生活情况。
图表类作文模板句型As can be seen from/in the chart/diagram/table/graph... 从表格/图形中我们可以看到……According to /As is shown in the Table /Figure/Chart...如表格/图表中显示…… It can be seen from the chart/diagram/table/graph/figures/statistics that... 从表格/图表/数据中我们可以看到……From the table/figures/data/results/information above, it can/may be seen/concluded/shown/estimated/calculated/inferred that... 从以上的表格/图表/数据/结果/信息中,我们可以看到/总结/预测/计算/得出……The table shows the changes in the number of...over the period from...to... 该表格描述了在……年之……年间……数量的变化。
As can be seen from the graph, the two curves show the fluctuation of...如图所示,两条曲线描述了……的波动情况。
The pie charts show the changes on... in some place in 2000. 此饼形图显示了2000年一些地方……的变化。
The table shows a three times increase over that of last year. 表格显示比去年上升了3倍。
The number is 5 times as much as that of... 此数字是……的5倍。