adams振动分析实例中文版
- 格式:docx
- 大小:18.92 KB
- 文档页数:2
固有频率在ADAMS/Linear 和ADAMS/Vibration 中的理解在ADAMS 中,固有频率是通过本征向量计算的,为了更好的理解计算结果中各个参数的意义,解决仿真中常见的问题,在这里理论联合实际对一些基本知识在ADAMS 中的应用做一基本论述。
在此,不涉及ADAMS/Linear 的扩展命令,所有的线性化命令实际都是在图形界面操作所得的。
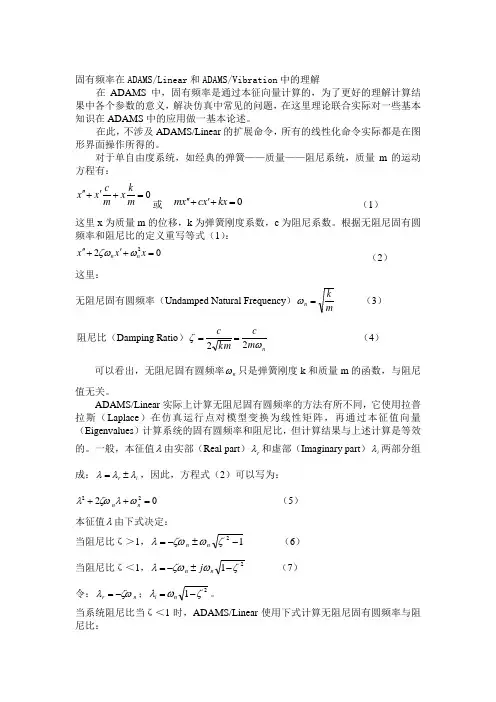
对于单自由度系统,如经典的弹簧——质量——阻尼系统,质量m 的运动方程有:c k x x x m m '''++=或 0m xc x k x '''++= (1) 这里x 为质量m 的位移,k 为弹簧刚度系数,c 为阻尼系数。
根据无阻尼固有圆频率和阻尼比的定义重写等式(1):220n n x x x ζωω'''++= (2)这里:无阻尼固有圆频率(Undamped Natural Frequency )mkn =ω (3) 阻尼比(Damping Ratio )nm ckm c ωζ22==(4) 可以看出,无阻尼固有圆频率n ω只是弹簧刚度k 和质量m 的函数,与阻尼值无关。
ADAMS/Linear 实际上计算无阻尼固有圆频率的方法有所不同,它使用拉普拉斯(Laplace )在仿真运行点对模型变换为线性矩阵,再通过本征值向量(Eigenvalues )计算系统的固有圆频率和阻尼比,但计算结果与上述计算是等效的。
一般,本征值λ由实部(Real part )r λ和虚部(Imaginary part )i λ两部分组成:i r λλλ±=,因此,方程式(2)可以写为:0222=++n n ωλζωλ (5)本征值λ由下式决定:当阻尼比ζ>1,12-±-=ζωζωλn n (6) 当阻尼比ζ<1,21ζωζωλ-±-=n n j (7) 令:n r ζωλ-=;21ζωλ-=n i 。
河北科技师范学院学报 第25卷第2期,2011年6月Journa l of H ebe iN o r ma lU n i ve rs i ty o f Science&T echno l ogy V o.l25N o.2Jun,2011基于ADA M S/V ibrati on的曲轴受迫振动分析马淑英,陈立东,刘荣昌,陈建伟(河北科技师范学院机电工程学院,河北秦皇岛,066600)摘要:在对刚柔耦合曲轴系模型建立的基础上,给出了曲轴受迫振动的分析方法,利用A da m s/V i brati on软件对给定载荷条件下的曲轴扭转振动进行了动态仿真,仿真计算结果表明,在曲轴圆角处的位移和速度有一突变,说明在圆角处易产生变形,与实际相符。
关键词:曲轴;ADAM S;振动分析;振动模型中图分类号:TK422 文献标志码:A 文章编号:1672-7983(2011)02-0050-06曲轴系统作为发动机上主要的运动部件,它的性能优劣直接关系到发动机乃至整车的性能、可靠性和寿命。
曲轴系的振动是引发内燃机振动的主要因素。
曲轴上作用有大小、方向周期性变化的切向和法向作用力,故曲轴会产生扭转振动[1]。
由于曲轴较长,扭转刚度较小,且曲轴系的转动惯量较大,故曲轴扭转振动频率较低,在发动机工作转速范围内容易产生共振,从而引起较大噪声、加剧其它零件的磨损,甚至导致曲轴折断。
曲轴的振动本质上是三维形式的振动,不仅扭转振动是人们研究的主要内容之一,弯曲振动、纵向振动也成为研究的重要内容[2]。
因此,开展轴系多维振动的机理与控制方法的研究既有较高的学术价值,又有明确的工程应用意义。
1 曲轴的振动分析方法由于曲轴的结构和受力情况都比较复杂,在计算曲轴轴系的振动特性时,一般都要将轴系简化为比较简单的力学模型,以便于求解。
早期的曲轴振动研究主要采用离散化方法,并将曲轴振动作为纯扭转振动处理。
目前,多采用H o lzer法、传递矩阵法、有限元法、弹性波法、模态分析法等曲轴振动分析方法,其中传递矩阵法因计算方便快速应用最广,有限元法因计算精度高而受人青睐,弹性波传播法兼具上述两种方法的特点,开始被引入曲轴振动计算[3]。
ADAMS 分析实例—定轴轮系和行星轮系传动模拟有一对外啮合渐开线直齿圆柱体齿轮传动。
已知 20,4,25,5021====αmm m z z ,两个齿轮的厚度都是50mm 。
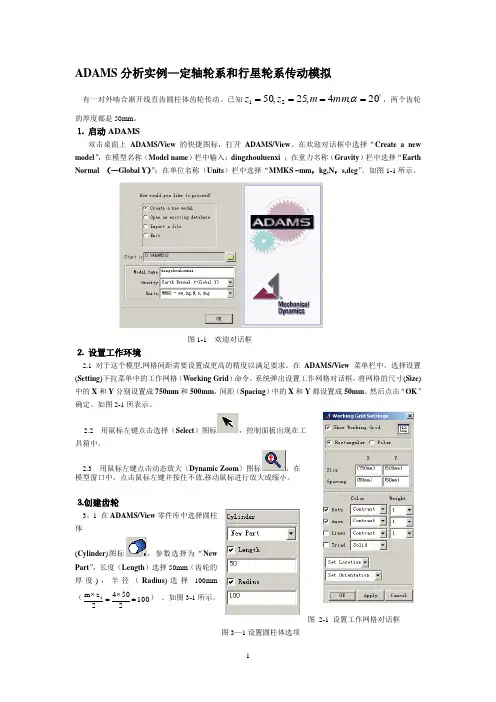
⒈ 启动ADAMS双击桌面上ADAMS/View 的快捷图标,打开ADAMS/View 。
在欢迎对话框中选择“Create a newmodel ”,在模型名称(Model name )栏中输入:dingzhouluenxi ;在重力名称(Gravity )栏中选择“Earth Normal (—Global Y )”;在单位名称(Units )栏中选择“MMKS –mm ,kg,N ,s,deg ”。
如图1-1所示。
图1-1 欢迎对话框⒉ 设置工作环境2.1 对于这个模型,网格间距需要设置成更高的精度以满足要求。
在ADAMS/View 菜单栏中,选择设置(Setting )下拉菜单中的工作网格(Working Grid )命令。
系统弹出设置工作网格对话框,将网格的尺寸(Size )中的X 和Y 分别设置成750mm 和500mm ,间距(Spacing )中的X 和Y 都设置成50mm 。
然后点击“OK ”确定。
如图2-1所表示。
2.2 用鼠标左键点击选择(Select )图标,控制面板出现在工具箱中。
2.3 用鼠标左键点击动态放大(Dynamic Zoom )图标,在 模型窗口中,点击鼠标左键并按住不放,移动鼠标进行放大或缩小。
⒊创建齿轮3。
1 在ADAMS/View 零件库中选择圆柱体(Cylinder )图标,参数选择为“NewPart ”,长度(Length )选择50mm (齿轮的厚度),半径(Radius )选择100mm (10025042z m 1=⨯=⨯) 。
如图3-1所示。
图 2-1 设置工作网格对话框图3—1设置圆柱体选项3.2 在ADAMS/View 工作窗口中先用鼠标任意左键选择点(0,0,0)mm,然后选择点(0,50,0).则一个圆柱体(PART_2)创建出来。

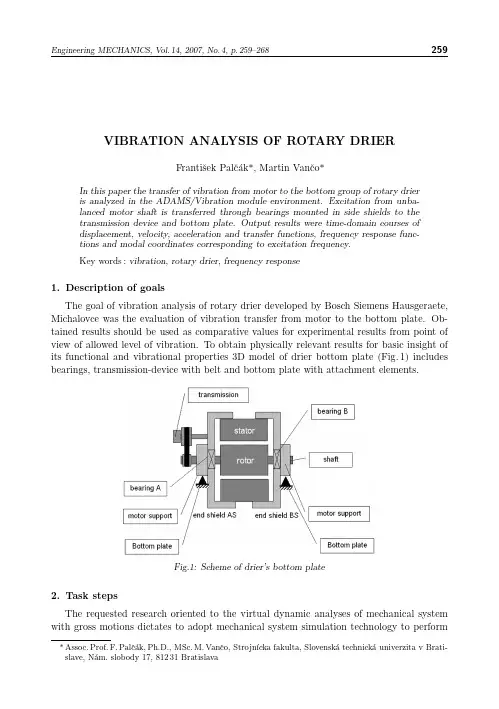
Engineering MECHANICS,Vol.14,2007,No.4,p.259–268259VIBRATION ANALYSIS OF ROTARY DRIERFrantiˇs ek Palˇc´a k*,Martin Vanˇc o*In this paper the transfer of vibration from motor to the bottom group of rotary drieris analyzed in the ADAMS/Vibration module environment.Excitation from unba-lanced motor shaft is transferred through bearings mounted in side shields to thetransmission device and bottom plate.Output results were time-domain courses ofdisplacement,velocity,acceleration and transfer functions,frequency response func-tions and modal coordinates corresponding to excitation frequency.Key words:vibration,rotary drier,frequency response1.Description of goalsThe goal of vibration analysis of rotary drier developed by Bosch Siemens Hausgeraete, Michalovce was the evaluation of vibration transfer from motor to the bottom plate.Ob-tained results should be used as comparative values for experimental results from point of view of allowed level of vibration.To obtain physically relevant results for basic insight of its functional and vibrational properties3D model of drier bottom plate(Fig.1)includes bearings,transmission-device with belt and bottom plate with attachment elements.Fig.1:Scheme of drier’s bottom plate2.Task stepsThe requested research oriented to the virtual dynamic analyses of mechanical system with gross motions dictates to adopt mechanical system simulation technology to perform *Assoc.Prof.F.Palˇc´a k,Ph.D.,MSc.M.Vanˇc o,Strojn´ıcka fakulta,Slovensk´a technick´a univerzita v Brati-slave,N´a m.slobody17,81231Bratislava260Palˇc´a k F.et al.:Vibration Analysis of Rotary Drier following task steps:1.For dynamic simulation with3D-Submodel of drier motor including bearing,transmis-sion device and belt(without bottom plate)an unbalance of200mg on rotor(rotation 2730rpm)and torsion of100Hz,200Hz and300Hz was used as dynamic load.The results were time dependent quantities on the outer ring of the bearing,side shields and stator(rigid bodies).2.Vibration of the motor was investigated using MSC.ADAMS/Vibration.Obtained resultscontain frequency response functions from excitation point on motor to the outer ring, side shields and stator.3.Based on the results form thefirst and second step a virtual numerical3D-Model ofdrier bottom plate was developed.Time-domain dynamic analyses were used to verify functionality and proper behavior of model.The time dependent displacements,velocities and accelerations of the bearings outer rings,side shields and stator(rigid bodies)were obtained for simulations based on the same loading conditions as in step1.4.Final step was dedicated to analyze transfer of vibration from motor to defined pointson bottom plate(Fig.7).Excitation was caused by rotating unbalanced mass within the range from0.1Hz to10000Hz.Fig.2:3D model of drier bottom plate3.Theoretical background of used computational technologyVibration analysis is a frequency domain simulation of MSC.ADAMS models.This simulation can be a normal modes analysis in which the eigenvalues and mode shapes for the model are computed.The frequency domain simulation can also be a forced response analysis using the input and output channels along with the vibration actuators.Input channels provide a port into our system so we can obtain a plot of the frequency response or drive our system with an input force using a vibration actuator.When we create an input function a vibration actuator applies an input force to vibrate the system.A vibration actuator can contain expressions that let us use both time and frequency inputs.Each input channel must reference only one vibration actuator but each vibration actuator,however, can be associated with multiple input channels.Engineering MECHANICS 261Swept sine defines a constant amplitude sine function being applied to the model.f (ω)=F [cos(θ)+j sin(θ)](1)where :f is the fequency ωdependet forcing function,F is the magnitude of the force and θis the phase angle.Fig.3:Principle of leading and lagging excitationsTransfer function is the magnitude and phase response produced by a given input channel at a given frequency ωfor a given output channel.For frequency response computation,the linearized model is represented as:s x (s )=A x (s )+B u (s ),(2)y (s )=C x (s )+D u (s )(3)where:s is the Laplace variable and A ,B ,C and D are state matrices for the linearized model.The system transfer function can be represented as :H (s )=y (s )u (s )=C (s I −A )−1B +D (4)where :H (s )is the transfer function for the model and I is the identity matrix of dimension equal to the number of system states.For a given vibration analysis,the system frequency response y (s )is given as :y (s )=H (s )u (s ).(5)Modal coordinates are states in the frequency domain solution associated with a specific mode.Modes most active in a frequency response can be identified from the modal coordi-nates.The modal coordinates are computed as :x (s )=(s I −A )−1B u (s ).(6)PSD of output channels for given input PSDs is given as :p (s )=H ∗(s )U (s )H (s )(7)where :p (s )is the matrix of power spectral density,H ∗(s )is the complex conjugate trans-pose of H (s )and U (s )is the matrix of input spectral density.262Palˇc´a k F.et al.:Vibration Analysis of Rotary Drier 4.Modelling of contact forcesFor models of contacts in our model were used2D impact force contacts,which include the interaction between planar geometric elements(circle and point).F n=k(g e)+STEP(g,0,0,d max,c max)d gd t.(8)In Eq.(8)g represents the penetration of one geometry into another,d g/d t is the penetration velocity at the contact point,e is a positive real value denoting the force exponent,d max is a positive real value specifying the boundary penetration to apply the maximum damping coefficient c max.The bearing model depicted on the Fig.4is advanced bearing model with possibility of ball settling and enabling to obtain relevant contact forces between inner ring and bearing ball(Fig.5).Fig.4:Advanced bearing model for contact forces and possibility of ball settlingFig.5:Time course of contact force between inner ring and bearing ballEngineering MECHANICS263 On the Fig.6is comparison of time courses of response forces infixed joint connecting bearing outer ring with ground with excitation from unbalanced mass and without excitation.Idealized geometric constraintsTo preserve guidance of belt against pulley and balls against rings in bearings there were used planar joints.Fig.6:Time courses of response forces infixed joint connecting bearing outerring with ground;small wawes are caused by unbalanced massFig.7:Frequency response function of AS shield accelerationand transfer function of AS shield acceleration264Palˇc´a k F.et al.:Vibration Analysis of Rotary Drier 5.Disscusion of obtained resultsOn the Fig.7is frequency response function and transfer function corresponding to the excitation by unbalanced mass of200mg on the rotor.On Fig.8is steady state portion of force response in attachment mount(MOUNT1) after low passfiltering with cut offfrequency200Hz because working range of drier is about excitation frequency45.5Hz.On Fig.9is time range between0.2and0.2219corresponding to one revolution of motor shaft.Fig.8:Force response in attachment mount(MOUNT1on Fig.2)to the excitation from motorFig.9:FFT analysis of displacement response of bottomplate in attachment mount(MOUNT1)Engineering MECHANICS265 From results yields that lower value(45.5Hz)corresponding to rotation of unbalance mass and higher value(554.6Hz)is caused by excitation due to contact of belt segments with pulley.In this section we deals with obtained frequency response functions(FRF from excitation point to the center of gravity of the outer ring,end shields,stator and bottom plate).Input point of excitation is located on the motor shaft.On the Fig.10is depicted the frequency response function of bottom plate center of mass acceleration.Fig.10:Frequency response function of bottom plate center of mass acceleration with frequency and magnitude axes in linear scaleFig.11:Position of output points for requested vibration responses Other response outputs are denoted OP1–OP9according to Fig.11with defined positions of output points.Output points OP6,OP7,OP8and OP9are on attachment mounts of bottom plate to the ground.266Palˇc´a k F.et al.:Vibration Analysis of Rotary Drier Onfigure Fig.12are results for acceleration of output points,because acceleration is often used as a measured quantity in real experiments.For comparison the frequency357.73Hz was selected,because in this value we can see amplification of responses.Fig.12:Frequency response functions for accelerations of bottom plate output points (frequency and magnitude axis are in linear scale)Fig.13:Modal coordinates corresponding to excitation frequency45.5Hz from input channel in horizontal(x-direction)are displayed in the upper plot,and frominput channel in vertical(y-direction)are displayed in the lower plot From whole frequency spectrum we concentrate on responses corresponding to the exci-tation frequency45.5Hz.On Fig.13we see which of normal modes(165,480in y-direction and139,165,480in x-direction)have highest values of modal coordinates.In Tab.1are sorted modal coordinates according to their magnitudes for excitation frequency(45.5Hz) at input channel in horizontal x-direction,resp.vertical y-direction.Engineering MECHANICS267 Input channel x-direction Input channel y-directionMode Modal Coordinate Mode Modal Coordinate4800.3584164800.5845751650.1688511650.2334241390.0794611390.02575174930.0335*******.02182631410.022********.01554532460.022********.007555511590.01912462460.007445551700.01866871410.007268041550.01849122550.006971452500.01574752450.00660005Tab.1:Modal coordinates for excitation frequency45.5Hz from input channelin horizontal x-direction,resp.vertical y-direction in the tabular form6.ConclusionTo obtain better understanding of vibration transfer from motor to the bottom plate all three types of obtained results,from functional,time domain and frequency domain analyses were presented in this paper.It can be concluded,that all obtained results are acceptable from physical point of view and with respect to accuracy and performance are in line with expectations.The FFT analysis of results from dynamic simulation of the motor in time domain confirmed correctness of the excitation frequency45.5Hz corresponding to the rotation 2730rpm.In thefirst dynamic time domain simulation we detected unwanted influence of belt,which is documented by FFT analysis on Fig.6(frequency554.6Hz)corresponding to excitation of belt segments(for one revolution of shaft,12.2segments passes over shaft pulley and therefore12.2·45.5=555.1).From Fig.8we can conclude that the highest values of acceleration are on attachments points of bottom plate to the ground(OP6,OP7,OP8 and OP9).For documentation how is possible to obtain better insight into modal properties we preparedfigures Fig.9with modal coordinates related to excitation frequency(45.5Hz).The highest modal coordinates give us information which normal modes(165,480in y-direction and139,165,480in x-direction)contribute to unwanted frequency response.As was stated,from methodical point of view the virtual model used for this research consist of rigid motor shaft and bottom plate with compliant attachments,which is initial phase of reality representation for study of vibration transfer to the bottom plate.The main goal in next steps of research will be to achieve properties of virtual3D-model of drier bottom group closer to the reality.A necessary refining of the virtual3D-model of bottom group should be achieved using input data obtained by physical experiments(nonlinear characteristics of compliant attachment elements).Further step of refining the rigid parts considered in the initial model(shaft,side shields,bottom plate)should be replaced by flexible bodies.AcknowledgementThis work was supported by the Scientific Grant Agency of the Slovak Republic VEGA under the grant number1/2092/05.This support is gratefully acknowledged.268Palˇc´a k F.et al.:Vibration Analysis of Rotary DrierReferences[1]Harris C.M.,Piersol A.G.:Harris’Shock and Vibration Handbook–Fifth Edition,McGraw-Hill,2002[2]Inman D.J.:Engineering Vibration,Prentice Hall,Inc.,2001[3]Mathews C.:Engineers’Guide to Rotating Equipment,Professional Engineering PublishingLimited,2002[4]Mobley K.R.:Vibration Fundamentals,Newnes–Reed Elsevier Group,1999Received in editor’s office:January16,2006Approved for publishing:May25,2006Note:The paper is an extended version of the contribution presented at the national con-ference with international participation Engineering Mechanics2005,Svratka,2005.。
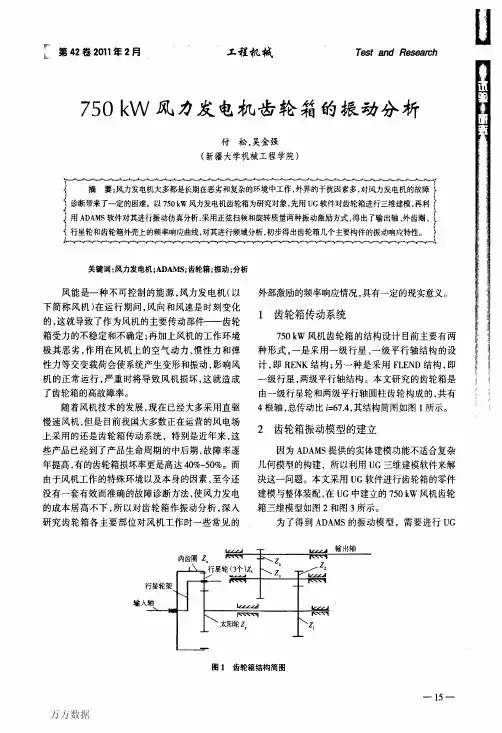
图2齿轮箱三维模型图3齿轮箱主要传动部件模型和ADAMS之间的数据交换。
ADAMS提供的模型数据交换接口有Parasolid,STEP,IGES,SAT,DXF和DWG格式,这里把在UG中建好的模型保存为Parasolid格式,其扩展名为半.xJ。
模型导人ADAMS后添加约束条件(如固定副、旋转副、齿轮副等)和构件属性信息,添加轮毂上的旋转载荷,最后得到ADAMS的齿轮箱仿真模型如图4所示(隐藏了齿轮箱外壳和行星架等部件)。
一16—3振动激励第42卷2011年2月j3.1正弦扫频正弦扫频信号定义了定常幅值的正弦函数,在振动激励对话框中定义该信号时,必须给定正弦函数的幅值和初相位。
“∞)=,同样地,在时域中有:以t)=F×[cos(tot+0)+jxsin(tot+0)]上两式中:厂(∞)为不平衡质量的力函数;F为幅值;.八z)为函数的时域形式;∞为角速度;f为时间;口为相位角。
为此以幅值为l、初相位为0的正弦函数作为正弦扫频信号,建立ADAMS齿轮箱振动模型的第1个输入通道的振动激励。
3.2旋转质量旋转质量激励产生一个频域力,这种激励表示由偏离旋转轴一定距离的旋转质量所产生的力,旋转轴由该振动激励所作用的输入通道确定。
“w)=mxw2xr式中:∞为频率;m为不平衡质量;r为不平衡质量与旋转轴之间的径向距离。
依此来建立输入轴第2个输入通道上的振动激励。
3-3分析方法对于频响分析,线性模型在频域上可以表示为:SX(s)=Ax(s)+Bu(s)SY(s)=Cx(s)+Du(s)式中:s为拉氏变量;SX(s)和SY(s)为X及y方向上的振动幅值;戈(s)和u(s)为信号函数;A,曰,C,D为系数。
图4齿轮箱振动分析模型750kW风力发电机齿轮箱的振动分析作者:付松, 吴金强, Fu Song, Wu Jinqiang作者单位:新疆大学机械工程学院刊名:工程机械英文刊名:CONSTRUCTION MACHINERY AND EQUIPMENT年,卷(期):2011,42(2)1.崔宁博设备诊断技术--振动分析及其应用 19882.李增刚ADAMS入门详解与实例 20043.陈立平;张云清机械系统动力学分析及ADAMS应用教程 20054.丁玉美数字信号处理 20025.尹炼;刘文洲风力发电 20026.宫靖远;贺德馨风电场工程技术手册 20067.应怀樵现代振动与噪声技术 20098.丁康;李魏华;朱小勇齿轮及齿轮箱故障诊断实用技术 2005本文链接:/Periodical_gcjx201102005.aspx。
基于ADAMS振动仿真的动传系统振动问题整改摘要:某牵引车在重载10Km/h左右车速爬坡时出现变速箱抖动大问题,需要整改。
在ADAMS中建立仿真模型,复现了问题,并确定了整改目标。
通过仿真对比分析,确定最佳措施,实车整改验证显示整改措施有效,问题得以解决。
该案例是运用ADAMS仿真分析技术成功解决了该振动问题。
关键词:动力传动系统;ADAMS;振动前言*某牵引车在重载以10km/h左右车速爬坡时出现变速箱振动大的问题。
实车现场测试结果如下图1所示(变速箱上振动加速度,单位:m/s²,下同):图1故障工况测试结果结果显示故障工况下Z向的振动加速度有明显峰值,且远大于X、Y向振动峰值;相同车速下平路工况进行测试,结果显示振动峰值仅为爬坡时峰值的1/5~1/6。
1 理论分析此车型的传动轴采用不等速万向节连接,传动轴转动时会产生2阶振动,2阶振动大小跟传动轴夹角及传递的扭矩大小有关[2],在固有模态分析的基础上,进行激励频域响应分析,提取变速箱的振动各方向响应。
频率响应分析结果如下图2所示。
图2系统振动频域响应分析结果上图显示变速箱的z向振动在7.8Hz处出现了大的峰值,且Z向的响应远大于X、Y向响应;与实际测试结果(见图1)也一致。
采用如下计算公式可以计算出1阶频率。
式中,n传动轴理论平均转速;R驱动轮滚动半径 0.496 m;V行车速度10Km/h;i是驱动桥总传动比:4.11。
2阶为一阶频率的2倍:约为7.34Hz,此频率与测试出现的振动频率7.5Hz非常接近。
经计算在相同车速下,爬坡时传动轴输出扭矩是平路工况11倍左右,因此会导致爬坡时变速箱振动加速度明显加大。
同时由于在此频率下出现了振动峰值,判断动力传动的悬置系统某一阶固有频率可能接近于此7.5Hz。
2 系统固有模态仿真分析在ADAMS中建立如下的振动仿真分析模型如图3所示。
图3动力传动系统振动仿真分析模型如上图所示,在ADAMS中建仿真分析模型已经实际的动力传动及模型参数(发动机、变速箱、传动轴质量及惯性参数和悬置参数,及传动轴夹角)。
1.问题描述研究太阳能板展开前和卫星或火箭分离前卫星的运行。
研究其发射振动环境及其对卫星各部件的影响。
2.待解决的问题在发射过程中,运载火箭给敏感部分航天器部件以高载荷。
每个航天器部件和子系统必学设计成能够承受这些高载荷。
这就会带来附加的质量,花费高、降低整体性能。
更好的选择是设计运载火箭适配器(launch vehicle adapter)结构。
这部分,将设计一个(launch vehicle adapter)的隔离mount,以在有效频率范围降低发射震动传到敏感部件的部分。
关心的敏感部件在太阳能板上,对70-100HZ的输入很敏感,尤其是垂直于板方向的。
三个bushings将launch vehicle adapter和火箭连接起来。
Bushing的刚度和阻尼影响70-100HZ范围传递的震动载荷。
所以设计问题如下:找到运载火箭适配器系统理想刚度和阻尼从而达到以下目的:传到航天器的垂直加速度不被放大;70-100HZ传递的水平加速度最小。
3.将要学习的Step1——build:在adams中已存在的模型上添加输入通道和振动执行器来时系统振动,添加输出通道测量响应。
Step2——test:定义输入范围并运行一个振动分析来获得自由和强迫振动响应。
Step3——review:对自由振动观察模态振型和瞬态响应,对强迫振动,观察整体响应动画,传递函数。
Step4——improve:在横向添加力并检查传递加速度,改变bushing的刚度阻尼并将结果作比较。
添加频域测量供后续设计研究和优化使用。
3.1需创建的东西:振动执行器、输入通道、输出通道完全非线性模型打开模型在install dir/vibration/examples/tutorial satellite 文件夹下可将其复制到工作木录。
加载Adams/vibration模块:Tools/ plugin Manager.仿真卫星模型:仿真看其是否工作正常,仿真之前关掉重力,这个仿真太阳能板在太空中的位置。
1.问题描述
研究太阳能板展开前和卫星或火箭分离前卫星的运行。
研究其发射振动环境及其对卫星各部件的影响。
2.待解决的问题
在发射过程中,运载火箭给敏感部分航天器部件以高载荷。
每个航天器部件和子系统必学设计成能够承受这些高载荷。
这就会带来附加的质量,花费高、降低整体性能。
更好的选择是设计运载火箭适配器(launch vehicle adapter)结构。
这部分,将设计一个(launch vehicle adapter)的隔离mount,以在有效频率范围降低发射震动传到敏感部件的部分。
关心的敏感部件在太阳能板上,对70-100HZ的输入很敏感,尤其是垂直于板方向的。
三个bushings将launch vehicle adapter和火箭连接起来。
Bushing的刚度和阻尼影响70-100HZ范围传递的震动载荷。
所以设计问题如下:
找到运载火箭适配器系统理想刚度和阻尼从而达到以下目的:
传到航天器的垂直加速度不被放大;
70-100HZ传递的水平加速度最小。
3.将要学习的
Step1——build:在adams中已存在的模型上添加输入通道和振动执行器来时系统振动,添加输出通道测量响应。
Step2——test:定义输入范围并运行一个振动分析来获得自由和强迫振动响应。
Step3——review:对自由振动观察模态振型和瞬态响应,对强迫振动,观察整体响应动画,传递函数。
Step4——improve:在横向添加力并检查传递加速度,改变bushing的刚度阻尼并将结果作比较。
添加频域测量供后续设计研究和优化使用。
需创建的东西:振动执行器、输入通道、输出通道
完全非线性模型
打开模型在install dir/vibration/examples/tutorial satellite 文件夹下可将其复制到工作木录。
加载Adams/vibration模块:Tools/ plugin Manager.
仿真卫星模型:仿真看其是否工作正常,仿真之前关掉重力,这个仿真太阳能板在太空中的位置。
关掉重力:Settings——Gravity ;
仿真:tool面板——simulation ,设置仿真时间是15s,步长为500;点击,将停在仿真后mode
返回最初的模型状态:点击,把重力打开,这时模型回到振动分析准确的发射状态。
创建输入通道:payload adapter中心创建两个输入通道(全局x和y方向)并为其创建振动执行器。
输入通道给系统提供通道,可以用来:plot频率响应,使用振动执行器
(加载力、位移、速度、加速度)驱动系统。
当以PSD形式输入时一个典型的设计可能需要输入加速度水平是g2/Hz,
我们将采用一个等效力normalized to a value of 1的输入,因为我们只对
不同频率的相对加速度感兴趣。
2个振动执行器,输入正弦波,相互垂直x和y方向。
第三个振动执行器将添加一个y方向1g的垂直加速度。
最后检查振动
执行器。
创建输入通道和振动执行器:
vibration—build—input channel
创建输出通道:输出端口
Vibration——Build——Output Channel——New.
4.测试模型
创建运行振动分析
强迫振动给模型设置振动参考配置,当你创建振动分析时,Adams制定输入和输出位置。
这些位置在运行振动时被使用。
在强迫振动分析前自动进行自由振动分析。
5.评估模型
采用Adams/postprocessor研究分析得到的数据
5.1查看表格结果
Vibration——review——display eigenvalue table
若有不稳定的值会高亮显示,表中都是稳定的。
5.2To view the table of modal coordinates:
Vibration——Review——Display Modal Info Table.
激励下的modal coordinates
显示16阶模态被该频率下y方向的力激发的震动大小。