SaleaeLogic16 V2版 逻辑分析使用说明
- 格式:pdf
- 大小:1.02 MB
- 文档页数:14
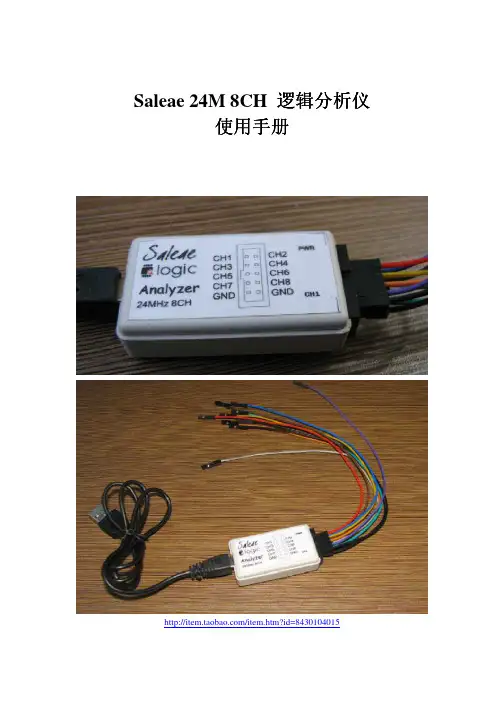
Saleae 24M 8CH 逻辑分析仪使用手册/item.htm?id=8430104015一,软件的安装以及基本使用1,首先安装软件Logic Setup 1.1.4 (32-bit),可从/downloads 下载,还有支持其他操作系统的软件版本,可对应下载。
2,安装完毕之后启动一下我们可以到可以看到以下界面:这个软件在没有接入硬件的时候可以模拟运行,我们可以看到。
点一下START SIMULATION 就可以看到波形,这时候的只是软件根据你设置的要分析的协议(如果你已经设置的话)模拟出来的,随机产生的。
如下图:用鼠标的左键点图形将实现ZOOM IN 放大,右键是ZOOM OUT缩小,如果使用的是三论鼠标,可以使用中键进行放大缩小。
我们也可以移动底部的滑动条来查看波形。
3,安装完毕后插入硬件,出现找到新硬件提示,如下点自动搜索驱动。
之后就能完成驱动加载。
在安装驱动的最后一步,询问你是否从新启动系统,你可以点否,不用重新启动就可以使用。
此时驱动安装完毕。
4,再次启动软件会发现,我们看到现在按钮的名字变成了START 而不是没有接硬件之前的START SIMULATION。
这时候点START将实现8路逻辑信号的采集。
二,关于采样深度和采样率在软件的左上方有两个下拉选项,左边一个是采样深度,右边一个是采样速率。
采样深度就是你总共要采集多少数据,图上的每路都采集25MBIT ;采样速率更好理解,就是一秒采集多少次。
比方说我们采25M标示每路每路集深度是1M采样速率也是1M,那总的采集时间就是1秒。
采集一秒后自动停止采集,并在界面上显示波形。
三,关于波形信息1在软件界面的右上方有波形信息,可以通过点击来选择自己感兴趣的参数。
如下图:2,以下图为例,看一下具体参数都是什么含义:Width :是图中的时间长度.Period :是图中的周期,也就是说将这个电平单独分析,其周期是多少。
而接下来的DUTY Cycle自然就是这个电平作为一个周期来分析,其占空比为多少。


LogIC操作手册2012-1北京宇畔科技发展有限公司目录1、LOGIC用户及程序运行环境 (4)1.1用户环境 (4)1.2建立项目区 (5)1.3程序更新区 (5)1.4程序环境 (5)1.5 LOGIC常规处理模块单井分析模块 (6)Single Well Analysis .................................................................................................. 错误!未定义书签。
Parameter files (6)WDT file (6)1.6 LOGIC常规处理模块单井处理主菜单及次级菜单 (7)2.LOGIC程序基本要素 (8)2.1 原始数据 (8)2.2 参数文件 (8)2.3 层分析文件 (9)2.4 数据系统及其相关联的数据文件 (10)2.5 文件结构 (11)2.6 访问及检索数据 (11)2.7 数据道属性 (11)3、测井资料预处理 (12)3.1 如何进入深度移动模块 (17)3.2 如何使用深度移动 (20)3.3 术语解释 (22)3.4 数据拼接 (29)3.5 曲线编辑和修改 (33)3.6 斜井垂深校正Directional Surveys (36)3.6.1 Load/edit/write survey data导入/编辑/写入井斜数据 (36)3.6.2 Reports导入/编辑/写入井斜数据 (37)3.7 对测井道数据的操作处理 (38)4.LOGIC参数输入 (43)4.1参数输入的主窗口功能 (43)4.2参数输入的通用选项 (44)4.3 WDT文件编辑----井图头参数 (44)4.4 GEO文件编辑----井分层参数 (47)4.5 PET文件编辑----岩石物理及岩性参数 (61)4.5.1岩石物理参数数据组: (61)1)Single set view (62)2)Multi-set view (63)3)利用Pickett Plot确定地层水电阻率 (64)4.5.2岩性参数数据组: (65)5、测井关联数据的输入及编辑 (72)5.1 导入关联数据 (73)5.2 编辑关联数据 (74)5.3 定义列信息 (74)5.4 定义单位 (75)6、数字处理分析方法 (77)6.1 Input data limits 输入数据范围 (77)6.2 Channel transfers 数据道转换 (78)6.3 Environmental corrections 环境校正 (79)6.4 Command Interpreter 命令说明 (80)6.5 Interpretation method 解释方法 (81)6.5.1 Vclay determination泥质含量的计算 (82)6.5.2 Porosity Options孔隙度选项 (82)6.5.3 Matrix inversion techniques复杂岩性反演技术 (83)6.5.4 Hydrocarbon corrections含油气校正 (84)6.5.5 PHIE/PHIT 有效孔隙度/总孔隙度 (85)6.5.6 Rt选项 (86)6.5.7 地层水饱和度 (87)6.5.8 Sxo 冲洗带含油饱和度 (87)6.5.9 Calculation of Bottom Hole Temperature 计算井底地层温度 (88)7、判别文件编辑---储层判别、坏井眼识别、矿物识别 (89)7.1 标准判别组合 (90)7.2 坏井眼判别组合 (92)7.3 矿物识别 (93)8、测井绘图 (95)8.1绘制测井曲线图 (95)8.2 绘制测井交会图、直方图 (99)9、解释成果输出 (105)10、多井对比分析 (107)附录B: 岩石物理常数名 (115)附录C: 分析方程 (116)LogIC操作手册1、LogIC用户及程序运行环境LogIC运行前需要明确用户的机器结构组成,如打印机、数字化仪及其他与计算机相连的硬件设备。
logic使用手册逻辑使用手册第一章:基本概念1.1 逻辑的定义1.2 命题和命题逻辑1.3 谓词和谓词逻辑1.4 命题与谓词逻辑的关系第二章:命题逻辑2.1 命题的基本运算2.1.1 否定2.1.2 合取2.1.3 析取2.1.4 条件2.1.5 双条件2.2 命题的等价与蕴含2.2.1 等价2.2.2 蕴含2.3 命题的简化与合取范式2.3.1 极小项与极大项2.3.2 卡诺图2.3.3 合取范式2.4 命题的推理2.4.1 假言推理2.4.2 拒取推理2.4.3 析取三段论2.4.4 假言三段论第三章:谓词逻辑3.1 谓词逻辑的基本概念3.1.1 谓词3.1.2 量词3.2 谓词的基本运算3.2.1 否定3.2.2 合取3.2.3 析取3.2.4 条件3.2.5 双条件3.3 谓词的等价与蕴含3.3.1 等价3.3.2 蕴含3.4 谓词的简化与前束范式3.4.1 极小项与极大项3.4.2 前束范式3.5 谓词的推理3.5.1 全称推理3.5.2 特称推理3.5.3 全称三段论3.5.4 特称三段论第四章:逻辑推理4.1 形式逻辑与实质逻辑4.2 形式逻辑的证明4.2.1 直接证明4.2.2 间接证明4.3 形式逻辑的推理规则4.3.1 假言推理4.3.2 拒取推理4.3.3 析取三段论4.3.4 全称推理4.3.5 特称推理4.4 形式逻辑的证明方法4.4.1 数学归纳法4.4.2 反证法4.4.3 构造法第五章:逻辑推理的应用5.1 逻辑推理在数学中的应用5.2 逻辑推理在科学中的应用5.3 逻辑推理在哲学中的应用5.4 逻辑推理在日常生活中的应用附录:逻辑符号表附录A:命题逻辑符号表附录B:谓词逻辑符号表本使用手册旨在全面介绍逻辑的基本概念、命题逻辑和谓词逻辑的运算规则、推理方法以及逻辑推理在各个领域的应用。
通过学习本手册,读者将能够掌握逻辑的基本原理,提升逻辑思维能力,并应用逻辑推理解决实际问题。

如何正确使用逻辑分析仪逻辑分析仪(Logic Analyzer),是一种常见的电子设备,用于对数字电路进行信号分析和故障诊断。
逻辑分析仪可以帮助工程师准确分析数字信号,找出潜在问题,并帮助修复电路故障。
本文将介绍如何正确使用逻辑分析仪,以帮助读者更好地应用这一工具。
一、选择适合的逻辑分析仪在使用逻辑分析仪之前,首先需要选择适合自己需求的设备。
逻辑分析仪有不同的通道数和采样率等参数,请根据实际需要选择相应的型号。
此外,还要考虑逻辑分析仪的软件兼容性以及使用的便捷性等因素。
二、准备测试电路在使用逻辑分析仪进行测试之前,需要准备好测试电路。
确保电路的连接正确无误,并根据需要给被测电路供电。
三、连接逻辑分析仪将逻辑分析仪与被测电路进行连接。
通常情况下,逻辑分析仪需要与被测电路的信号引脚相连。
使用合适的连接线,将逻辑分析仪的信号线与被测电路连接起来,确保连接牢固可靠。
四、设置逻辑分析仪参数在连接逻辑分析仪后,需要根据测试需求设置合适的参数。
逻辑分析仪通常会提供相应的软件,可以通过软件进行参数设置和数据分析。
根据被测电路的特点和测试目的,设置逻辑分析仪的采样率、采样深度、触发条件等参数。
五、进行信号采样设置好参数后,可以开始进行信号采样。
逻辑分析仪会根据设置的参数进行数据采集,采集到的信号可以用于进一步的分析和诊断。
在信号采样过程中,需要确保采样的时间范围覆盖了所需分析的信号波形。
六、分析和诊断信号采样完成后,可以通过逻辑分析仪提供的软件对采集到的信号进行分析和诊断。
逻辑分析仪通常会提供波形分析、时序分析等功能,可以帮助工程师快速找出问题所在。
通过触发功能,可以将采样波形与特定条件进行比较,从而找出异常信号。
七、故障排除与修复通过分析和诊断,可以确定问题所在并进行相应的修复。
根据分析结果,工程师可以对电路进行调整、更换故障组件等操作,以修复电路故障。
八、记录和总结在使用逻辑分析仪进行测试和分析的过程中,需要及时记录测试结果和分析过程。
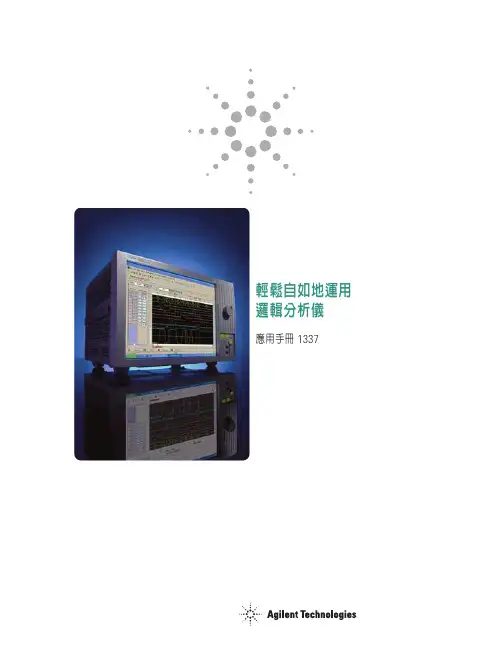
輕鬆自如地運用邏輯分析儀應用手冊1337目錄前言35512172023示波器或邏輯分析儀什麼是邏輯分析儀時序分析儀的基本概念狀態分析儀的基本概念有效率地使用數位工具如何連接到標的系統結語用對工具可以幫助您在較短的時間內順利克服數位除錯挑戰,而在挑選適合的工具之前,務必先瞭解您可以使用的工具有哪些,以及它們最擅長的應用。
本應用手冊會帶您快速綜覽邏輯分析儀的基本概念,文中不會提到太多詳細的量測,但會清楚敘述邏輯分析儀的功用。
我們會探討諸如“為何必須使用邏輯分析儀?”及“邏輯分析儀可以幫我做些什麼?”之類的問題。
/find/logic 2? ?示波器或邏輯分析儀? 當有機會可以選擇使用示波器或邏輯分析儀時,許多工程人員都會選擇示波器,這是因為大多數的使用者都對示波器比較熟悉,但示波器在某些應用上會有一些限制。
依您想完成的作業而定,邏輯分析儀所產生的資訊可能更為有用。
由於示波器與邏輯分析儀有部分功能是重複的,因此在某些情況下兩者皆適用。
該如何決定哪一種儀器對您的應用更有利?讓我們看看幾個基本的原則。
何時應使用示波器當您要查看信號的細微電壓變化時當您要求較高的時間間隔準確度時 一般來說,當您需要較高的垂直或電壓解析度時,選用示波器就對了。
換言之,如果您要查看每個電壓的總改變值,如圖1所示,則應使用示波器。
包括新一代數位示波器在內的許多示波器,也能提供相當高的時間間隔解析度,亦即它們可以非常準確地量測兩個事件間的時間間隔。
總之,當您需要參數資訊時,請使用示波器。
圖1.示波器波形3何時應使用邏輯分析儀當您必須一次查看許多信號時當您必須如硬體一般來查看系統中的信號時當您必須在幾個高、低位準信號的碼型上觸發及查看結果時 邏輯分析儀是由示波器衍生而來,並以相同於示波器的一般方式來呈現資料:水平軸為時間,垂直軸為電壓振幅。
雖不像示波器能提供較高的電壓解析度或時間間隔準確度,但邏輯分析儀一次擷取及顯示幾百個信號的能力卻是示波器所不及的。

Saleae16使用手册QQ:415942827Email:51kingst@购买地址:/item.htm?id=20369792793一、S aleae Logic16逻辑分析仪功能特点1、Saleae16界面操作非常简单易懂,非常容易上手使用。
2、Saleae16采用资源动态复用技术,可以实现3通道100M最高采样率,6通道50M最高采样率,9通道32M最高采样率以及16通道16M最高采样率(必须是USB2.0,采样速度取决于您的电脑USB口速度,尽可能单独为设备预留一个USB口)。
3、Saleae16采样数据实时送入电脑内存,并且采用压缩算法,深度最高可达10G。
4、Saleae16可以自动分析UART、IIC、SPI、DMX-512、JTAG等多达14种常用通信协议,直接得到数据。
5、Saleae16可以把数据显示成为10进制、16进制、二进制、ASCII码等,方便您分析数据。
6、非常实用的触发设置,可以从自己想要的数据部分开始抓取。
二、软件安装以及软件基本应用首先安装logic software,安装光盘里提供的版本或者到/downloads页面进行下载直接双击进行自解压安装,在安装过程中,如果遇到任何防火墙提示,请选择允许运行,安装完后,会在桌面出现一个快捷方式:,同时在你的指定LLC C 安装路径内会出现Saleae LLC文件夹,默认安装在C:\Program File\Saleae LL 里边。
安装好软件后,就可以打开软件提前尝试一下软件本身的强大了。
因为Saleae本身有8通道和16通道两种设备,我们当前用的是16通道的,所以我们如果要进行模拟实验,首先切换到16通道,点击右上角的Options�Connected devices�Demo Logic16,就切换到Saleae Logic16状态了。
就可以摇身一变,变成下图:这个逻辑分析仪软件在没有插入硬件的时候,最上边显示的是Disconnected,可以进行模拟运行(start simulation),用鼠标点一下后会出现一个模拟的波形,如果你提前设置协议的话(如何设置协议,后边会讲),他还会产生符合你协议的波形呢~!当然,非真实测到的波形,可以让你提前体验一下,点鼠标左键放大波形,右键缩小波形,滚动鼠标滑轮也可以放大和缩小波形,没有使用硬件之前可以提前体验一下。
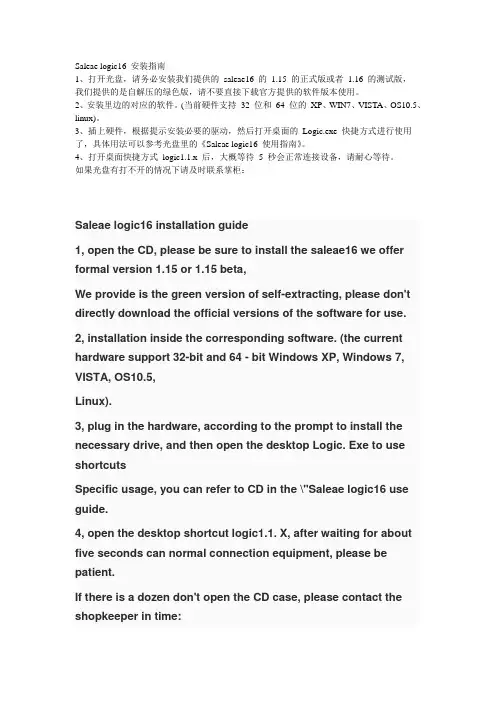
Saleae logic16 安装指南1、打开光盘,请务必安装我们提供的saleae16 的1.15 的正式版或者1.16 的测试版,我们提供的是自解压的绿色版,请不要直接下载官方提供的软件版本使用。
2、安装里边的对应的软件。
(当前硬件支持32 位和64 位的XP、WIN7、VISTA、OS10.5、linux)。
3、插上硬件,根据提示安装必要的驱动,然后打开桌面的Logic.exe 快捷方式进行使用了,具体用法可以参考光盘里的《Saleae logic16 使用指南》。
4、打开桌面快捷方式logic1.1.x 后,大概等待5 秒会正常连接设备,请耐心等待。
如果光盘有打不开的情况下请及时联系掌柜:Saleae logic16 installation guide1, open the CD, please be sure to install the saleae16 we offer formal version 1.15 or 1.15 beta,We provide is the green version of self-extracting, please don't directly download the official versions of the software for use. 2, installation inside the corresponding software. (the current hardware support 32-bit and 64 - bit Windows XP, Windows 7, VISTA, OS10.5,Linux).3, plug in the hardware, according to the prompt to install the necessary drive, and then open the desktop Logic. Exe to use shortcutsSpecific usage, you can refer to CD in the \"Saleae logic16 use guide.4, open the desktop shortcut logic1.1. X, after waiting for about five seconds can normal connection equipment, please be patient.If there is a dozen don't open the CD case, please contact the shopkeeper in time:。
逻辑分析仪使用方法
逻辑分析仪是一种用于对数字电路进行信号分析和测量的仪器。
它可以帮助工程师和技术人员快速准确地分析和诊断数字电路中的
问题。
本文将介绍逻辑分析仪的基本使用方法,帮助用户更好地掌
握这一重要工具。
首先,使用逻辑分析仪之前,需要准备好相应的设备和连接线。
确保逻辑分析仪和被测试的电路之间的连接正确可靠。
接下来,打
开逻辑分析仪的电源,并根据实际情况选择合适的触发模式和触发
电平。
触发设置的准确性将直接影响到测量结果的准确性,因此需
要特别注意。
在连接好逻辑分析仪后,可以开始进行信号的采集和分析。
首先,设置好采样频率和采样深度,确保逻辑分析仪可以捕获到所需
的信号波形。
然后,启动逻辑分析仪,开始采集数据。
在数据采集
完成后,可以对采集到的波形进行分析和处理,以获取所需的信息。
在使用逻辑分析仪时,需要注意以下几点。
首先,避免在高压
或高电流的环境下使用逻辑分析仪,以免损坏设备。
其次,在连接
逻辑分析仪时,要注意线缆的质量和连接的牢固性,以确保信号的
准确传输。
最后,使用逻辑分析仪时要仔细阅读设备的说明书,了解其功能和操作方法,避免操作失误导致设备损坏或数据丢失。
总之,逻辑分析仪是一种重要的数字电路分析工具,正确的使用方法可以帮助用户快速准确地分析和诊断电路问题。
通过本文介绍的基本使用方法,相信读者可以更好地掌握逻辑分析仪的使用技巧,提高工作效率和准确性。
希望本文对您有所帮助,谢谢阅读。
Saleae逻辑分析仪应用手册本教程通过图文并茂的方式来讲解,Saleae的用途和实际应用方法一、什么是逻辑分析仪:逻辑分析仪是一种类似于示波器的波形测试设备,它通过采集指定的信号,并通过图形或者数据统计化的方式展示给开发人员,开发人员通过这些图形化时序信号按照协议来分析硬件或者软件中的错误。
逻辑分析仪是设计中不可缺少的设备,通过它,可以迅速定位错误,发现并解决问题,达到事半功倍的效果,尤其在分析时序,比如 1wire、I2C、UART、SPI、CAN等数据的时候,应用逻辑分析仪解决问题非常快速。
以下是一个 Saleae分析一个 UART通信时序和一个 IIC时序的典型例子:从图中我们可以清晰的看到, UART通信在波特率 9600下面,清晰的显示出十六进制数字 0xA9,而下边的 IIC信号一个读数据的时序过程,通道 1是 SDA,通道 2是 SCL,在 1通道中清楚的显示出来,绿点表示起始位,红点表示结束位,第一个是往 0x90这个器件地址写数据 (w是 write的意思 ),第二个表示要读取的地址是 0x40,第三个数据是重新发送器件地址并且是读数据,第 4个字节即读到的数据 0xA9。
是不是感觉非常方便快捷呢。
二、软件安装以及软件基本应用首先安装 logic software,软件在光盘里有配套,同时也可以到官方网站下载,下载地址是: /downloads。
这里有各种系统版本支持,请下载你所需要的系统支持版本:下载完后,直接双击安装。
安装完后,会在桌面出现一个快捷方式:双击快捷方式,进入后,会出现以下界面:这个逻辑分析仪软件在没有插入硬件的时候,最上边显示的是 Disconnected,可以进行模拟运行 (start simulation),用鼠标点一下后会出现一个模拟的波形,如果你提前设置协议的话 (如何设置协议,后边会讲),他还会产生符合你协议的波形呢 ~!当然,非真实测到的波形,可以让你提前体验一下,点鼠标左键放大波形,右键缩小波形,滚动鼠标滑轮也可以放大和缩小波形,没有使用硬件之前可以提前体验一下。
Logic Analyzer Application Manual (Based on Saleae)Table of Contents1 What is a logic analyzer2 Software installation and software basic application3 Hardware installation4 Trigger settings5 Signal collect6 Data analysis7 Using the Analyzer to Analyze TV Remote Control Protocols8 Logic Analyzer Usage Questions and ConsiderationsAbout the sampling frequency of 24M maximum1.What is a logic analyzerThe logic analyzer is a kind of waveform test equipment. It collects the specified signal and displays it to the user through graphical or statistical data. The user analyzes the error in the hardware or software according to the protocol through these graphical timing sequence signals.The logic analyzer is an indispensable device in the design, through which users can quickly locate errors, find and solve problems. Especially when analyzing timing sequence, such as 1wire, I2C, UART, SPI, CAN, etc., applying a logic analyzer can solve the problem quickly. The following is a typical example of Saleae analyzing a UART communication sequence and an IIC timing:From the figure we can clearly see that the UART communication is below the baud rate of 9600, clearly showing the hexadecimal number 0xA9, while the lower The timing sequence of a read data of the IIC signal, channel 1 is SDA, channel 2 is SCL, and is clearly displayed in 1 channel. The first one is to write data to the device address of 0x90 (w is the meaning of write), the second Indicates that the address to be read is 0x40, the third data is the retransmitted device address and is the read data, and the fourth byte is the read data 0xA9. Is it very convenient and fast?2. Software installation and software basic applicationFirst, install the logic software, you can download it from the official website, the download address is /downloads.There is various system version support here, please download the system support version you need.After downloading, double-click to install. After installation, a shortcut will appear on thedesktopDouble-click the shortcut to enter.When the logic analyzer software is not plugged in, the top display is Disconnected, which can be used for start simulation. After clicking on the mouse, an analog waveform will appear. If you set the protocol in advance, it will produce a match. The waveform of your agreement ~! Of course, the non-true measured waveform allows you to experience it in advance. Click the left mouse button to zoom in on the waveform, the right button to zoom out, and the mouse wheel to zoom in and out. You can experience it in advance without using the hardware.3. Hardware installationAfter the software is installed, you can insert the hardware. After plugging in the hardware, it will automatically prompt to discover the new hardware. Then in the prompt dialog box, yo u can directly click “Install the software automatically (recommended)”. After the installation, the one just after the installation “Disconnected” will automatically change to “Connect”, and start simulation will automatically change to start, which is connected with the actual hardware. Below we can use to measure the actual waveform and can set the channel name, sampling depth, sampling frequency, and other parameters.There are two very important parameters in the logic analyzer, namely the sampling depth and the sampling frequency. You can see that in this software, there are two places where you can choose the size of the number, the first is the sampling depth, and the second is the sampling frequency.The 5M on the front means that we collect from the beginning, and when we collect 5Mbit data, it will stop automatically. The 2M on the back can collect 2M bit data in 1s. So we can set it up and collect the data of 2.5s.The strength of the saleae logic analyzer is that it sends the collected data to the computer in real time via USB high-speed communication, so the sampling depth depends on the memory of our computer, which can be up to several G, that is, if We set the sampling depth of 1G, the sampling frequency is 1M, then we can collect nearly 17 minutes of data to save and analyze slowly, which is very useful for you to analyze the data information of some chips.4. Trigger settingsThe trigger setting is for the convenience of everyone to use when collecting from the useful signal, so you can avoid collecting a lot of useless signals at the beginning.Here, set the channel which you use to trigger. You can set the rising edge to start collecting data, or the falling edge to start collecting data, or high and low level to start collecting data. The default is to not set the trigger. When the start is clicked, the data collection will start automatically, and the sampling depth will be automatically stopped after the set sampling depth is completed.Then we can formally collect a set of data for observation!5. Signal collectIt is important to note that the internal buffer used in the analyzer is 74HC244,so the normal working voltage of our equipment is below 5.5V, and below1.5V will be considered as low level. 1.5V to 5.5V will be considered high level.The maximum withstand voltage is 7.5V, so please pay attention to the test voltage.Connect the GND channels to the GND pin of your board.Choose any of the 8 data channels you need to connect to your device. And select the appropriate sampling depth and sampling frequency, as well as trigger conditions, then the following point can be directly started to start the acquisition.The acquired waveform is shown in the figure below:The user puts the mouse on the waveform and automatically displays some necessary information on the right side, including pulse width length, period, frequency and so on. Everyone can click on the pinnacle on their own, and they can choose the information they want to show.In addition, if we want to collect multiple information, we can save the information, click on Option in the upper right corner, there is aYou can save the current information, then grab the next screen, and finally compare each screen, you can also save the graphics as a picture format, etc., youcan try to find out for yourself.6. Data analysisFirst, let's take a look at the information displayed in the Measurements column on the left.When we put the mouse into a pulse, it will display a piece of data information onthe left side.T hen we will analyze the information on the right side by the pair.First, the first parameter Width is for this graphicthis part, It is expressed that the length of this part is 0.232500ms.The second parameter Period is the periodThe third parameter Duty Cycle is the duty cycle of the current cycle, and the fourth parameter Frequency is the frequency of the current signal, which is the reciprocal of the cycle. T1 and T2 are the two-time labels in the analyzer. We canget the information we need by placing the label. We can click the and , then can get two green lines in the waveform, which can be obtained byplacing the green line. The scale label shows the position of T1 and T2 and the value of |T1-T2| on the right side.A more powerful feature of the Saleae logic analyzer is the ability to automatically analyze protocols, including the following protocol types.For these types of waveforms, not only the waveform can be displayed, but alsothe protocol value can be directly displayed. The display mode can be binary, decimal, hexadecimal, ASCII, and so on. We can see in the above picture, channel 0 is a line of UART, channel 1 is the SDA pin of I2C, and channel 2 is the SCL pin of I2C. Then we can clearly see that the data is analyzed. The specific operation method is: Click on the Analyzers on the right and select Async Serial.The following page will appear. In this interface, we need to select the parameters of the UART communication, including channel selection, baud rate selection, data bit, stop bit check digit, etc., which can be selected according to the actual situation. Once you have made your selection, you can click Save.Then you will be prompted to modify the channel name, you can choose to change or not according to your needs, point Rename or Don’t Rename.Then set the display format again. There are two places to choose the display format. You can choose one of them in the Options, as shown below.Another click on the corresponding protocol, such as the pinion on the left side of the Async Serial, can also choose the display mode. I am used to choosing hexadecimal. After selecting, set the rising edge trigger, click Start, the sent data can be captured.After capturing the data, the following will occur.As you can see, the low bit is in the front and the high bit is in the back. The data is 0x6C, and you can see that there are 8 small white points on the top. Each white point indicates a data bit. The initial start bit is not available. Little white spots. We can automatically display our data.In the same way, we set up another IIC data to observe.Let's see if it is very clear, green indicates the start bit, red indicates the stop bit, the first byte is the device address 0x90 and is the write operation, the second command writes the address 0x40. Then the third instruction is a read operation that contains the device address. The fourth byte is that the read data is 0x6C, and the acknowledge bit or the non-acknowledge bit is clear at a glance. Let's take a look at other protocols.7. Using the Analyzer toAnalyze TV Remote Control ProtocolsUse the probe clip to connect GND to the GND pin of the board and channel 1 to the receive pin of the IR receiver tube HS0038. Set the falling edge trigger, then click Start, then press a button on the remote control to capture a waveform as follows:The protocol of the infrared remote controller is not a standard protocol, and the remote controller of a manufacturer may have different protocols. Therefore, this protocol needs to be analyzed by ourselves. For the NEC protocol, it is the most used in the remote control protocol. The specific protocol rule is: firstly, the low-level duration (ie 38K carrier time) of about9000us and the high-level duration of about 4500us are used as the boot code. The digital information of the key code is represented by the duration of a high and low level. The approximate value is 1680us. High level +560us Low level indicates 1,560us high-level +560us low level means 0. The rest of us can be read from that picture. You can use the two rulers T1 and T2 to read the final result. I write the binary, the low bit is in front and the high bit is in the back: 000000000 11111111 10100010 01011101 We put them into hexadecimal numbers are 0x00, 0xff, 0x45, 0xBA, then the infrared decoding is completed, the meaning of these 4 bytes, the first two bytes are the device code, that is, this model The home appliance remote control is all this code, the third byte 0x45 is the key code, that is, different keys have different key codes, thefourth byte is the inverse of the key code, Everyone can see it right or not.8. Logic AnalyzerUsage Questions and ConsiderationsAbout the sampling frequency of 24M maximumIn most cases, as long as your computer is fast enough and there is no interference from other USB devices, there is no problem with the logic analyzer reaching the 24M sampling frequency. However, if the current USB device is being used by other devices, the maximum sampling frequency may be one or two lower, such as 16M, 12M, etc.1> The logic analyzer uses the USB2.0 standard. Under this standard, the theoretical maximum average bandwidth is 24M, but the logic analyzer has a lower priority, which means it is possible to “crash” to other Communication with USB devices.2> The logic analyzer has four 512-byte buffers. Before the four buffers are filled, the USB must read some data. That is, the four buffers cannot be filled at the same time. Otherwise, The data cannot be entered, and the logic analyzer will report the error directly.This means that if you are working at 24M, the USB device must not only give a 24M communication rate but must also ensure that other devices use USB resources before the four buffers are filled. For these reasons, logic analyzers can't work at 24M sampling frequency for long periods of time, depending on computer performance, availability and latency of USB bandwidth, and other devices that are taking up USB drives.In order for your computer to maximize the sample rate, the following conditions are guaranteed:1> Make sure that no other large programs take up longer CPU time2> Make sure there is enough memory space, otherwise, the computer will not have enough RAM to get the data of the logic analyzer.3> Connect the USB port of your computer as directly as possible, not through a USB hub4> Try to make other USB-enabled devices use less USB resources5> For the logic analyzer to have enough power to increase the sampling frequency, use a few other USB devices as possible.。
[数字设计使用的逻辑分析仪基础知识] saleae逻辑分析仪工程师需要同时查看16位计数器的输入和输出,以确定定时误差,但如果只有一台2通道示波器,怎样查看这些信号呢?工程师刚刚为装满数字电路的电路板开发出定时图,该怎样检验它们呢?使用什么仪器捕获和分析这些信号呢? 如果使用的工具不当,那么解决这类问题可能要耗费大量的时间。
对上面的问题,逻辑分析仪是最好的解决方案。
本文快速考察了逻辑分析仪基础知识,介绍了逻辑分析仪的功能。
选择示波器还是逻辑分析仪在选择使用示波器还是使用逻辑分析仪时,许多工程师会选择示波器。
但是,示波器在某些应用中的用途有限。
根据用户要完成的工作,逻辑分析仪可能会得到更实用的信息。
什么时候使用示波器・在需要查看信号上小的电压偏移时;・在需要较高的时间间隔精度时。
什么时候使用逻辑分析仪・在需要一次查看多个信号时;・在需要以与硬件相同的方式查看系统中的信号时,・在需要触发多条线路上的逻辑高和低码型、查看结果。
在系统中的信号越过单个门限时,逻辑分析仪的反应方式与逻辑电路相同,它识别信号是高还是低,它还可以触发这些信号中的逻辑高和低码型。
一般来说,在需要查看的线路数量高于示波器能够显示的数量时,应使用逻辑分析仪。
逻辑分析仪特别适合考察总线上的时间关系或数据,如微处理器地址总线、数据总线或控制总线。
它们可以解码微处理器总线上的信息,以有意义的方式表示这些信息。
在工程师过了设计的参数阶段、希望了解多个信号之间的定时关系及需要触发由逻辑高和低组成的码型时,应使用逻辑分析仪。
什么是逻辑分析仪大多数逻辑分析仪是两种分析仪组合在一起的仪器:第一部分是定时分析仪,第二部分是状态分析仪。
定时分析仪基础知识定时分析仪显示信息的方式在整体上与示波器相同,横轴表示时间,竖轴表示电压幅度。
由于这两种仪器上的波形都与时间相关,因此可以说其显示画面都位于时域中。
选择正确的采样方式定时分析仪与数字示波器类似,都是1位的垂直分辨率。
Saleae Logic 16 逻辑分析仪使用上手手册Saleae Logic 16购买地址:从2014年六月份开始,Saleae官方开始主推他的1.1.19版本的逻辑分析仪界面。
我在这里给大家介绍一下新软件的采集设置,波形查看以及协议解析等功能和操作步骤。
第一节, 软件的安装SALEAE 官方提供了WINDOWS ,LINUX ,MAC操作系统的软件版本,其中WINDOWS 版本又分32位系统和64位系统。
如果您的电脑是XP 或者WIN7 32位,请安装32位软件,如果是WIN8 或者WIN7 64位,请安装64位软件。
对于WIN7系统的用户如果不知道自己的系统是32位还是64位,可以右击“我的电脑”之后再属性里面看到红色箭头部分指示的是32位系统,您应该选择安装32位软件:这里我用的操作系统是WIN7 32 ,选择安装Logic+Setup+1.1.19+(32-bit)这个安装文件。
之后一路回车安装好软件。
这里不再截图,安装完毕后,可以开启软件,显示出界面:在安装软件的同时,驱动程序已经被注册到系统了了,当插入SALEAE 16逻辑分析仪后就可以自动安装安装驱动。
第二节, 软件界面的总体介绍软件界面基本是左中右的布局,左边主要是采集和显示设置,右边是分析和解析设置,中间是波形显示区域。
软件支持脱机模拟采集,没有实际的硬件也可以感受一下软件的界面和操作。
点,可以在波形区域模拟显示出一些软件生成的数据,如果您设置了解析(解析设置方法在下面讲),可以根据所设置的协议,生成一些符合协议解析要求的模拟数值。
由于默认的演示模式是8通道的,我们可以设置成16通道的。
之后弹出选择演示的设备:我们选择LOGIC16 ,之后界面会出现一些SALEAE16 的设置,这里面的设置的具体内容我们下一节来讲,这里只是感受一下界面。
大家注意官方的硬件是支持0 1 分界点电压的设置,国内所有山寨的都不支持电压调节,电压调节的设置都被直接忽略。