包装缓冲设计
- 格式:ppt
- 大小:52.50 KB
- 文档页数:20
74Abstract: A large number knowledge were carried out on the basis of the full analysis of the current health pot packaging and the current problems in the health pot packaging, and the corrugated paper design scheme was finally put forward through the combination of the present situation and the actual situation. A flexible, green and paper molding and other characteristics of the health pot buffer packaging structure was designed. The new cushioning packaging structure of all corrugated paper replaces foaming plastics to achieve the effect of fixing the health pot body, pot cover and heater base, which improves the protection strength of the health pot. It has certain compressive strength, cushioning effect and environmental protection. At the same time, it has the characteristics of one paper molding, reducing the use of packaging materials, and has certain innovation. It puts forward a very meaningful solution for health pot packaging, and achieves certain economic benefits.Keywords: health pot; buffer structure; paper materials姚卓楠,卢芳芳,刘卡亚,郭莹莹,赵慢慢,李艳(河南牧业经济学院 包装与印刷工程学院,郑州 450046)养生壶缓冲包装设计Health Pot Buffer Packaging DesignYAO Zhuo-nan, LU Fang-fang, LIU Ka-ya, GUO Ying-ying, ZHAO Man-man, LI Yan(Henan Institute of Pastoral Economics, School of Packaging and Printing Engineering, Zhengzhou 450046, China)摘要:在对目前养生壶包装的充分分析和养生壶包装当前所存在的问题的基础上,进行大量的资料查阅,通过现状结合实际情况,最终提出了瓦楞纸设计方案。
刍议缓冲包装的“六步法”设计摘要:根据缓冲包装设计的六步法,对液晶电视的缓冲包装结构设计进行了分析,提出了一些包装设计方案,通过对缓冲包装结构的改进,达到产品的缓冲保护要求,为更多的电子产品缓冲保护带来有利的帮助,提高产品的缓冲包装效率。
关键词:液晶电视、缓冲包装、包装结构设计、改进为了在运输过程中的产品免受一些振动或者是冲击而产生的损坏,所以要对商品进行缓冲包装来保护商品。
伴随着产品运输的跨省、跨地域运输,产品的缓冲包装开始受到人们的关注,如何对产品的缓冲包装设计进行合理的选材,让商品在运输、储存和装卸等的过程中减少损坏,或者把在运输、储存、装卸等过程中的损失降到最低,这是在产品缓冲包装中一直在研究的重大项目。
经过众多的实践后,产品缓冲包装的六步法产生了。
我们从以下方面进行研究,帮助在液晶电视包装材料方面的结构设计及减震缓冲设计进行改进,优化缓冲材包装设计,保护TV价值并以最大数量货柜出货;提升设计成熟度,避免重复性实验验证,缩短测试时间。
1、缓冲包装六步法目前对产品在流通的过程中采用的最有效、最广泛的方法就是缓冲包装,在产品的包装中加入一些缓冲材料,这些缓冲材料可以对冲击力量进行吸收,可以减少产品在振动中产生的损坏,可以把缓冲材料的这个作用称之为隔振作用。
由于对缓冲材料的结构、尺寸等不知道如何进行选择而产生了一些列的产品缓冲包装设计上的问题。
根据这些问题,产品包装的六步法[1]诞生了:(1)对进行包装的产品流通过程中的外部条件,制定一些标准(2)对流通产品可以承受的最大加速度进行确定(3)对承受的最大加速度较低的产品,对其关键结构进行重新设计,提高它的承受力(4)根据流通产品的承受力和包装材料的特性,对产品进行缓冲结构的设计,确定最佳的尺寸(5)综合考虑在运输中的破损率、成本等多方面的因素对产品进行包装结构的优化设计(6)根据客户的要求和国家规定的标准,进行原型运输包装的试验,结果跟预期的不一致时,根据试验的结果进行相关数据的修改。
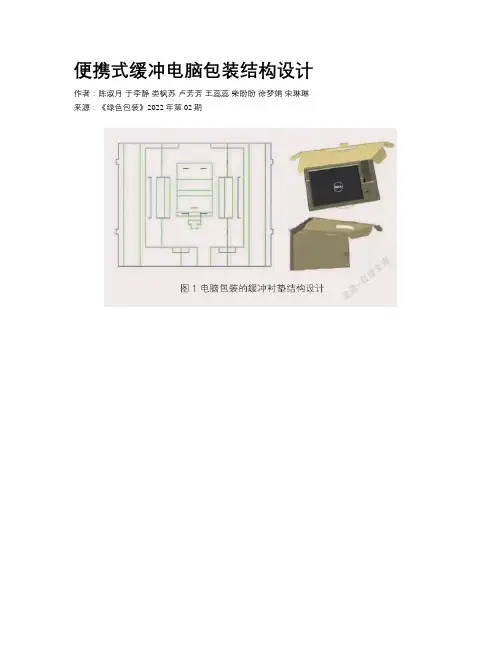
便携式缓冲电脑包装结构设计作者:陈淑月于李静娄枫苏卢芳芳王蕊蕊柴盼盼徐梦娟宋琳琳来源:《绿色包装》2022年第02期摘要:本文通過剖析笔记本电脑包装所用材质的现状和笔记本电脑包装缓冲结构现存的弊端,根据笔记本电脑的自身特性和运输过程中的流通环境等因素的影响,采用E型瓦楞纸板设计缓冲衬垫,C型瓦楞纸板为外包装箱的电脑包装。
通过合理有效地分析和计算将电脑、电源适配器和电源线放置在合理的位置,以达到节省材料和保护产品的作用,且利用特殊结构来形成间壁,突出了包装保护产品的作用。
据此设计出一款具有良好缓冲性能的电脑防护包装,该包装的缓冲衬垫与外包装箱均是一纸成型,使电脑缓冲包装达到减量化的目的,图纸结构相对规整,方便拼版,生产效率高,生产成本低;整体包装不使用粘合剂,废料易降解,绿色环保。
关键词:缓冲电脑包装;结构设计;瓦楞纸板;减量设计中图分类号:TB482 文献标识码:A 文章编号:1400 (2022) 02-0102-03Packing Structure Design of Portable Buffer ComputerCHEN Shu-yue, YU Li-jing, LOU Feng-su, LU Fang-fang, WANG Rui-rui, CHAI Pan-pan, XU Meng-juan, SONG Lin-lin(Henan Institute of Pastoral Economics, School of Packaging and Printing Engineering, Zhengzhou 450046, China)Abstract: This paper analyzes the present situation of the notebook computer packaging material used and the disadvantages of the existing laptop cushion packaging structure, according to the properties of their own laptops and circulation environment in the process of transportation, the influence of such factors as finally decided to adopt E corrugated board cushioning packaging design, type C corrugated board computer packaging for outer packing. Through reasonable and effective analysis and calculation, the computer, power adapter and power cord are placed in a reasonable position to save materials and protect the product, and the special structure is used to form the partition wall, highlighting the role of packaging protection products. According to this, a computer protective package with good buffering performance was designed. The buffering liner and the outer packing case were all formed by one paper, so that the computer buffer package could achieve the purpose of reducing the quantity. The drawing structure was relatively neat, easy to make up, high production efficiency and low production cost. The whole package does not use adhesive, the waste is easy to degrade, green and environmental protection.Key words: buffer computer packaging; structure design; corrugated board; reduction design随着计算机技术的不断发展,笔记本电脑已经渗透进人们生活的各个领域;而在当今电商不断发展的浪潮之下,大多数人购买笔记本电脑的途径也从线下转到线上购买。
![产品包装设计规范标准[详]](https://uimg.taocdn.com/13cddbd76294dd88d0d26b5f.webp)
产品包装规范1、目的:为了规范公司产品包装作业的运作,保证产品能满足环境试验的要求,保护产品在运输中不受破坏,特制定本规范。
2、范围:本规范适用于公司所有产品的包装作业之运作,主要是针对纸箱包装件的质量标准给予合理规范。
3、引用标准GB6543 瓦楞纸箱GB6544 瓦楞纸板GB 13023 瓦楞原纸GB 13024 箱纸板GB 5033 出口产品包装用瓦楞纸箱GB 5034 出口产品包装用瓦楞纸板GB/T6546 瓦楞纸板边压强度的测定法GB/T 6545 瓦楞纸板耐破强度的测定法GB/T 4857.1 试验时部位标示方法GB/T 4857.3 运输包装件静载荷堆码试验方法GB/T 4857.5 跌落试验方法GB/T 4857.10 运输包装件正弦振动试验方法4、基本要求⑴、为了保护产品之塑料,金属等基本面免受破坏,对产品加胶袋包装。
⑵、为了缓冲产品在运输过程中产生的冲力,要对产品加强保护,需加衬垫或彩盒包装。
⑶、按照客户包装要求进行包装。
5、包装材料5.1、瓦楞纸板的种类⑴、单面瓦楞纸板单面瓦楞纸板是由一张面纸和一张瓦楞纸粘合而成的。
⑵、三层瓦楞纸板三层瓦楞纸板也称单瓦楞纸板。
是在一张面纸和一张里纸之间粘一张瓦楞纸而形成的。
⑶、五层瓦楞纸板五层瓦楞纸板也称双瓦楞纸板。
是在面纸、芯纸、里纸之间粘二张瓦楞纸而形成的。
⑷、七层瓦楞纸板七层瓦楞纸板也称三瓦楞纸板。
是在面纸、芯纸、里纸之间粘三张瓦楞纸而形成的。
⑸、瓦楞纸板的楞型应符合下表的规定:楞形特点U形缓冲性好V形强度高⑹、单瓦楞纸板厚度应高于上表所规定的下限值;双瓦楞纸板厚度应高于上表所规定相应两种楞型楞高下限值之和。
加工瓦楞纸板使用的主要材料是箱板纸和瓦楞原纸。
应符合GB13023《瓦楞纸板》、GB13024《箱纸板》的规定。
⑺、瓦楞纸板的含水率应在14±4%的范围内。
`⑻、瓦楞纸板表面平整、清洁,不许有缺口、薄边。
切边整齐,粘合牢固,其脱胶部分之和每平方米不大于20cm2。
第1篇一、引言随着社会经济的快速发展,我国制造业取得了举世瞩目的成就。
在制造业中,缓冲制品包装作为产品生产、运输、储存等环节的重要组成部分,其质量直接影响到产品的安全、使用寿命和企业的经济效益。
为了提高缓冲制品包装的质量,降低生产成本,本文针对缓冲制品包装的解决方案进行探讨。
二、缓冲制品包装的重要性1. 保障产品安全缓冲制品包装在产品生产、运输、储存等环节中,起到缓冲、防护作用,可以有效降低产品在运输、储存过程中受到的损伤,保障产品安全。
2. 提高生产效率合理的缓冲制品包装可以提高生产效率,减少因包装不当导致的停工、返工等浪费现象。
3. 降低运输成本优质的缓冲制品包装可以降低运输过程中的破损率,减少物流成本。
4. 增强企业竞争力良好的缓冲制品包装可以提升产品形象,提高企业竞争力。
三、缓冲制品包装解决方案1. 选用合适的缓冲材料(1)泡沫塑料:具有优良的缓冲性能、耐腐蚀性、易加工等特点,广泛应用于电子产品、精密仪器、玻璃制品等产品的包装。
(2)纸制品:具有良好的缓冲性能、可降解、环保等特点,适用于轻工、食品、医药等行业产品的包装。
(3)木制品:具有较好的缓冲性能、耐用性,适用于大型机械、重工业产品的包装。
(4)复合材料:结合多种材料的优点,具有更好的缓冲性能,适用于特殊场合的包装。
2. 设计合理的缓冲结构(1)采用多层次的缓冲结构,提高缓冲效果。
(2)根据产品形状、重量、运输方式等因素,设计合适的缓冲结构。
(3)采用可拆卸、可重复利用的缓冲结构,降低成本。
3. 优化包装工艺(1)采用先进的包装设备,提高包装速度和质量。
(2)加强包装工人的培训,提高包装技能。
(3)严格控制包装过程中的质量控制,确保产品安全。
4. 选择合适的包装方式(1)根据产品特性、运输方式、成本等因素,选择合适的包装方式,如箱式、托盘式、袋式等。
(2)采用环保、可降解的包装材料,降低环境污染。
5. 加强包装测试与评估(1)对缓冲制品包装进行强度、耐压、抗冲击等性能测试,确保其满足产品包装要求。

运输包装——缓冲、防振包装设计中国包装联合会包装教育委员会副秘书长教育部包装工程专业教学指导委员会委员振动工程学会包装动力学分会理事华南农业大学食品学院包装工程系教授联系方式:广州天河五山、华南农业大学食品学院510642Email:xianghong@ Tel:135********,020-********向红博士中国包装联合会包装教育委员会副秘书长教育部包装工程专业教学指导委员会委员振动工程学会包装动力学分会理事华南农业大学食品学院包装工程系教授联系方式:广州天河五山、华南农业大学食品学院510642Email:xianghong@ Tel:135********,020-********一、运输包装概论1.1运输包装定义、特点与研究对象运输包装定义(Transportation Packaging):为了尽可能降低运输流通过程对产品造成损坏,保障产品的安全,方便储运装卸,加速交接检验,人们将包装中以运输储运为主要目的的包装称之为运输包装。
运输包装主要特点有:1.综合性(交叉学科)2.系统性(系统工程)3.过程性(产品周期)4.优化性(整体优化)5.创新性(新型产品)6.绿色性(环境友好)运输包装研究对象:1.流通环境2.产品特性3.缓冲材料产品缓冲材料材料特性、缓冲设计自身强度流通环境运输、装卸、存储1.2运输包装设计目标:设计最合理的运输包装合理的包装欠缺包装过份包装优化产品设计,减少包装用量。
合理的包装就是经济上最省、同时对环境影响最小的包装。
1.3运输包装设计过程产品理想设计过程IDP(Ideal Design Process)“IDP”是指在产品设计和样品试制阶段,借助CAD、FEM、CAT 等先进技术对产品CAD模型进行结构优化,从而在最小的周期内设计出结构最佳、外形最美的产品的设计思想。
其主要步骤是:⏹采用计算机辅助设计,建立产品三维CAD模型。
⏹模拟运输环境,在CAD模型的基础上,建立有限元分析(FEM)模型。
FIVE STEPS FOR PACKAGE CUSHION DESIGN缓冲包装设计5步法IntroductionBetter Package and Product Design Saves Money and Improves Customer Satisfaction. Packaging can be unnecessarily expensive in a couple of ways:1. Inadequate design results in shipment damage2. Over-design or poor design (more protection than is required or materials being incorrectly used ) results in excessive material cost.High cost of damage in shipment should be unacceptable to those who are aware of the claims costs and the lost customers. Conversely, the cost of waste resulting from over-packaging (poor and unneeded material utilization) is less visible and more difficult to aggressively pursue. This total waste, estimated at billions of dollars, could be significantly reduced if packages were properly designed for shock and vibration protection.This text describes a basic procedure for logically designing and testing cushioned packages. The techniques outlined here are not new. Nevertheless, the logical, step-by-step procedures are not yet universally used by all package designers .Increasingly the theories and techniques presented here are also being used by product designers to evaluate and improve the ruggedness of products. Indeed, often it is more economical to permanently improve products than to provide temporary cushioning which will later be discarded.The procedure can be broken down into five basic steps. This 5 Step Method was developed in conjunction with the Michigan State University School of Packaging.1.Define The EnvironmentShock: choose the most severe drop height you wish to protect against.Vibration: Determine a representative acceleration vs. frequency profile.2.Define Product FragilityShock: Determine the product’s shock damage boundaries.Vibration: Determine the product’s critical resonant frequencies.3.Choose The Proper CushioningSelect the most economical cushioning to provide adequate protection for both shock andvibration.4.Design and Fabricate The Prototype Package5. Test The Prototype PackageShock: Use the “Step Velocity” test method.Vibration: Verify adequate protection at the critical frequencies.This chapter discusses only shock and vibration. Other environmental factors such as compression, humidity, temperature, and other potentially destructive forces should also be considered in designing and testing a package. A similar, logical treatment of the product’s needs for protection from these hazards should also be incorporated. In some cases, only minor modifications may be3233required to account for these other factors after a sound, basic design for shock and vibration has been completed and tested.Step 1 Define the EnvironmentShockIt is generally agreed that, regardless of the transportation mode, the most severe shocks likely to be encountered in shipping result from handling operations. These result from dropping the package onto a floor, dock or platform. Of course, many kinds of drops are possible (flat, corner, edge, etc.), but we know that the most severe transmitted shock occurs when a cushioned package lands flat on a nonresilient horizontal surface. It is reasonable, then, to design cushioned packages for this flat drop.In designing for shock protection, the first consideration is selecting the design drop height. Charts similar to the one shown in Figure 1 will be helpful. The chart takes into consideration both the package weight and the probability of drops occurring from specified heights. When selecting the probability level, factors such as the relative costs of products and package, shipping costs, and the percentage of loss which can be tolerated must be considered.VibrationThe transportation vibration environment is complex and random in nature. The basic method of testing for package design is not to simulate the vibration environment, but rather to simulate its damage-producing capabilities. Thus, a procedure which identifies the product and component resonant frequencies, and which leads to protection at those frequencies, can be expected to produce effective result .Figure 1 Probability Curves for Handling ShocksYou may select acceleration levels and frequency ranges from environmental data and34acceleration-frequency profiles such as shown in Figure 2, from a vibration acceleration envelope like that in Figure 3, or, from a power spectral density summary plot as shown in Figure 4. Acceleration levels and frequency ranges you select must be consistent with the available additional data, experience, judgement, and knowledge about the product.Figure 2 Frequency Spectra for Various Probabilities-Railroad(vertical direction, composite of various conditions)Figure 3 Vibration Acceleration Envelope-RailcarThe actual shape of the acceleration-frequency profile is not as important as being able to sufficiently excite the critical components over the range of frequencies occurring in thetransportation environment (Generally 1-200 Hz or greater).Figure 4 Railcar Frequency Spectra-Summary of PSD dataIn summary, the first step in the package design is to select a design drop height and an acceleration-frequency profile.Step 2 Define Product FragilityShockShock damage to products results from excessive internal stress induced by inertia forces. Since inertia forces are directly proportional to acceleration (F=ma), shock fragility is characterized by the maximum tolerable acceleration level, i. e, how many g’s the item can withstand.When a dropped package strikes the floor, local accelerations at the container surface can reach several hundred g’s. The packaging material changes the shock pulse delivered to the product so that the maximum acceleration is greatly reduced (and the pulse duration is many times longer). It is the package designer’s goal to be sure that the g-level transmitted to the item by the cushion is less that the g-level which will cause the item to fail.Shock Spectrum and Damage Boundary Theory are techniques for characterizing the resistance of products to handling shocks. They permit construction of a “damage boundary” curve like that shown in Figure 5.Figure 5 Typical Damage Boundary CurveThe horizontal line of the boundary is at the peak acceleration value of the minimum damaging shock pulse. The vertical line of the boundary is at the minimum velocity change (drop height), necessary to cause damage. A plot like this can be determined for any product. A shock pulse which falls within the shaded area (sufficient acceleration and velocity change), will produce damage. No damage will occur for pulse with less velocity change or lower peak acceleration. The low-velocity portion of the plot (at the left) is that area where damage does not occur even with very high accelerations. Here the velocity change (drop height) is so low that the item acts as its own shock isolator. Below the acceleration boundary portion of the plot (under the curve), damage does not occur, even for large velocity changes (drop heights). That’s because the forces generated (F =ma) are within the strength limits of the products.Figure 6 shows that the velocity change boundary (vertical boundary line), is independent ofthe pulse wave shape. However, the acceleration value (to the right of the vertical line) of the35damage boundary curve for half sine and sawtooth pulses depends upon velocity change. Use of this damage boundary would require accurate prediction of drop heights and container/ cushion coefficients of restitution. Since they normally cannot be predicted, a trapezoidal pulse shape is typically used.Figure 6 Damage Boundary for Pulses of Same Peak Acceleration andSame Velocity ChangeThe damage boundary generated with use of a trapezoidal pulse encloses the damage boundaries of all the other waveforms. This is a great advantage, since the wave shape which will be transmitted by the cushion is usually unknown. By using the trapezoidal pulse to establish the acceleration damage boundary rating, the package designer can be sure that actual shocks transmitted by the cushion will be equal to or less damaging than the test pulse.Fragility testing is the process used to establish damage boundaries of products. It is usually conducted on a shock testing machine. The procedure has been standardized and incorporated into several standards such as ASTM1 D3322-85. Use of a shock machine provides a convenient means of generating variable velocity changes and consistent, controllable acceleration levels and waveforms.Typically, the item to be tested is fastened to the top of a shock machine table and the table is subjected to controlled velocity changes and shock pulses. The shock table is raised to a preset drop height. It is then released, free falls and impacts against the base of the machine; it rebounds from the base and is arrested by a braking system so that only one impact occurs. A shock programmer between the table and the base controls the type of shock pulse created on the table (and the test item mounted on it) during impact.For trapezoidal pulses used in fragility testing, the programmer is a constant force pneumatic cylinder. The g-level of the trapezoidal pulse is controlled simply by adjusting the compressed gas pressure in the cylinder. The velocity change is controlled by adjusting drop height . Conducting a fragility testTo conduct a fragility test, shock machine drop height is set at a very low level to produce a low velocity change, and the product is secured to the table surface. Either a half sine or a rectangular pulse may be used to perform this test, since the critical velocity portion is the same.A half-sine shock pulse waveform programmer is normally used for convenience. The first dropis made and the item examined to be sure damage has not occurred. Drop height is then increasedto provide a higher velocity change. The second drop is made and again the specimen is36examined. Additional drops are made with drop height gradually increasing until failure occurs. The velocity change and peak acceleration are recorded for each impact. Once damage occurs, the velocity boundary testing is stopped, since the minimum velocity necessary to create damage has been established as well as the velocity change portion of the damage boundary curve (See Figure 7). The damage boundary line falls between the last drop without damage and the first drop causing damage.Figure 7 Velocity Damage Boundary DevelopmentIn some cases, it is sufficient to determine only this vertical line of the damage boundary. If the velocity change required to damage the product will not be encountered from normal drops expected in the environment, no cushioning will be needed. However, if the product is damaged at levels which will be encountered in the environment, product improvements or cushioning for shock protection will be required. This indicates a need to establish the horizontal line of the damage boundary.Determining the acceleration boundary line requires that a new test specimen be attached to the shock table. The drop height is set at a level which will produce a velocity change at least 1.6 times the critical velocity. The programmer compressed gas pressure is adjusted to produce a low g-level shock which is lower than the level which you anticipate will cause damage to the product. Again, a first drop is made and the item is examined for damage. If none has occurred, the programmer pressure is increased to provide a higher g-level impact from the same drop height. Another drop is made and again the specimen is examined. The procedure is repeated with gradually increasing g-levels until damage occurs. This level establishes the level of the horizontal line of the damage boundary curve. The damage boundary line falls between the last drop without damage and the first drop causing damage.You can plot the damage boundary curve by connecting the vertical velocity boundary line and the horizontal acceleration boundary line. The corner where the two lines intersect is actually rounded, not square. In most cases, this rounded corner will not be in the range of interest and asquare corner can be used. If, however the corner is in the range of interest, the shape of thecorner can be determined by calculation or by running an additional test in the area. Figure 7B37shows a typical damage boundary plotted by this method.Figure 7B Damage Boundary Line DevelopmentTwo things may be learned from the damage boundary plot.1.If the velocity change which the packaged item will experience is below the critical velocity, no cushioning for shock protection is needed.2.If the velocity change which the packaged item will experience is above the critical velocity,a cushion should be designed so that it transmits less acceleration than the critical acceleration level.In most cases, where a product might be dropped on any of its sides, tests should be performed in each direction in each of the 3 axes, and a total of 6 damage boundaries established. VibrationIt is generally accepted that the steady-state vibration environment is of such low acceleration amplitude that failure does not occur due to nonresonant inertial loading. Damage is most likely to occur when some element or component of a product has a natural frequency which is excited by the environment. If this tuned excitation is of sufficient duration, component accelerations and displacements can be amplified to the failure level.Response of a product or component to input vibration may be represented by a curve similar to that shown in Figure 8.You can see that for very low frequencies, response acceleration is the same as the input; for very high frequencies, the response is much less than the input. But in between, the response acceleration can be many times the input level. This is the frequency range where damage is most likely to occur.To actually determine a product’s vibration fragility would involve complexities which are probably not justified in terms of greatly improved results. The product test method, then, involves identifying the product and component resonant frequencies. A test method often used to accomplish this is ASTM Standard Method D3580, Vibration (Vertical Sinusoidal Motion)Test of Products.38Figure 8 Typical Resonant Frequency Transmissibility CurveThe resonance search is run on a vibration test machine (shaker). The item to be tested is fastened to the shaker table and subjected to vertical sinusoidal motion according to the acceleration-frequency profile selected in Step 1. As the frequency is slowly varied between lower and upper limits, the test item is observed for resonances. Sometimes, if non-critical product panels, etc. , or other shielding external components are removed, resonant effects can be seen or heard directly. At other times, use of a stroboscope and/or various sensors may be necessary. The critical frequencies and components should be recorded.In general, tests should be performed in each of the three axes, and three sets of critical frequencies recorded. If the product is mounted on a definite skid base, only the vertical axes need to be analyzed.To summarize Step 2, damage boundaries are determined and plotted, and critical frequencies are identified.Step 3 Choose the Proper CushioningUntil now, shock and vibration procedures have been separated. In Step 3, however, their effects must be considered simultaneously: the designer must specify cushioning which provides adequate protection for both shock and vibration.The key to selecting the most economical cushion protection is the use of “cushion curves”. Two types of data are needed and must be used simultaneously: Shock Cushioning Curves and Vibration Transmissibility Data.ShockA.Shock Cushioning Curves; maximum transmitted shock acceleration vs. Static stress.A typical example of this type of curve is shown in Figure 9. The cushion curve shows the peak acceleration that will be transmitted by various thicknesses of the cushion for different values of static stress (static stress is the weight of the packaged item in pounds divided by the cushion area in square inches).To select the most economical cushion to use, you should review cushion curves for the same drop height as you selected in Step 1 as the design drop height. From these curves, select thecushion type and thickness to limit the peak transmitted acceleration to a level which is the sameas, or lower than, the damage g-level determined during fragility testing in Step 2. You must also39consider the most economical cushion configuration, i.e., full item area coverage, only partial area coverage, using corner pads, etc.Figure 9 Polyethylene, 2 pcf, 36" Drop Height Shock Cushion CurvesA large number of cushion curves have been generated and reported in the literatures concerned. In many cases, you can use existing curves. At times, particularly where newer materials are involved, it may be necessary to generate new data by conducting dynamic cushion tests to develop cushion curves.Cushion tests are typically run in accordance with ASTM Test Method D1596-78 , ASTM Test Method D4168-82 or MIL-C-26861. Standard 8 inch x 8 inch cushion samples are normally used either as flat sheets or encapsulating designs. Both vertical drop and shock tests machines have been employed for these tests. A dummy load or platen with an adjustable weight is used. The drop height is adjusted and the drop weight is instrumented with an accelerometer so the acceleration pulse during impact on the cushion can be recorded.Each test results in one data point. Peak acceleration is read directly from the oscilloscope trace or from the wave form analyzer. Static stress is calculated by dividing the weight of the platen in pounds by the cushion area in square inches. The peak transmitted acceleration level data points for the static stress loadings are recorded for each cushion thickness and drop height and provide the basis of establishing the cushioning curves.VibrationB.Vibration Transmissibility Data: Vibration natural frequency vs. static stress.A typical example of this type curve is shown in Figure 10.It shows the natural frequency of the product/cushion combination for a specific cushion/static loading combination. In selecting the most economical cushion to use, the package designer should attempt to find a type, configuration, and thickness which will produce a natural frequency of no more than one-half the lowest critical resonant frequency determined in Step 2.This insures a reasonable amount of vibration attenuation at the critical frequencies. For example,if the product/cushion combination has the response curve of Figure 10, and the lowest critical40product frequency is 30 Hz, it can be seen that the input to the product at the critical frequency is reduced by a factor of 2.5. Of course, the input will be even further reduced for the higher critical frequencies.Figure 10 Example of How a Cushion Reduces Vibration at Product Critical FrequencyUnfortunately, cushion curves like Figure 10 are neither commonly available nor always reliable. In most cases, you must conduct your own tests and develop your own cushion vibration data.By mounting cushion material on a shaker, weighing it to various static stress levels, and monitoring both table and weight accelerations, a curve similar to Figure 10 may be generated during the frequency sweep. The natural frequency may then be recorded as a function of static stress.Remember that the cushion design must simultaneously satisfy both the shock and vibration criteria. For any given cushion and static stress level, you must examine both data sets to insure that both the transmitted g-level and the natural frequency are correct.Sometimes selection of a cushion and design of a package using the above criteria become very difficult because the fragility g-level and/or the critical frequency is too low. In cases where this is unavoidable, the package designer must either compromise the design protection level to a certain extent or incorporate more extensive packaging. In many cases, however, the package designer can work with the product designer to increase the ruggedness of the product for an overall cost saving.In summary, the most economical cushion is selected using shock cushion curves and vibration cushion data and the information of Steps 1 and 2.Step 4 Design And Fabricate the Prototype Packag eNext, the information gathered in Steps 1, 2, and 3 is assembled and the prototype package constructed. The designer must consider other related issues when designing the prototype: The cost of packaging materials; other types of protection required; special shipping requirements; closures; and other unique issue.The prototype should closely approximate the intended final package. Materials, closures, dimensions, weight, etc., should be the same as those of the final package. This is to ensure thatthe tested prototype is a representative sample of the final package. The desired goal is that theprototype displays the same characteristics under testing, as you’d expect from the final package.41A sufficient number of prototypes are then made for the tests.Step 5 Test the Prototype PackageYour final step is to test the completed prototype package, with the product, to verify that it performs as expected. This step is necessary because the procedure used in package design does not, for the sake of simplicity, take into account some variables such as the effects of cushion shape, friction of the side pads, confinement of bottom pads which could affect air flow from the cushion, etc. In many situations, these effects will be small and the cushioned package will perform as designed. In cases where the package does not perform as designed, it must be modified and retested.ShockYou’ll remember in Step 1, it was discussed that the flat drop is the most severe in terms of transmitted peak acceleration levels. It is therefore the flat drop that you should use to test the prototype package.It is difficult to repeatably drop a package flat without guiding it. The most accurate, and repeatable, way to generate a truly flat drop is to test the package on a shock testing machine. The package is placed on the table on the shock machine, and the table (and the package) are dropped and undergo a very fast change in velocity when the table impacts the programmer. This fast velocity change test is called a step velocity test.The shock machine can be the same as used for fragility testing, except that a different shock programmer is used. This programmer produces very short duration (2 milliseconds or less) shock pulses. The package response to these short pulses will be similar to the nearly instantaneous velocity change which a container experiences during a free fall flat drop on a hard surface.During the tests, the shock table should be instrumented to verify that the input velocity change is correct. The packaged item should also be instrumented with an accelerometer to determine if the peak g-level transmitted by the cushion remains within the fragility limit. If the packaged item is expensive and you’re unsure of the prototype package, a dummy structure having the same weight, dimensions and center of gravity as the actual item can be substituted for the first tests.In most cases, where the package may be dropped on any of its sides, the tests should be conducted in each direction in each of the three axes-a total of six tests.In conducting step velocity tests, drop height on the machine is set at the desired level, and the shock table is raised and dropped. It impacts, rebounds and is arrested by the rebound brakes. The acceleration pulse delivered to the packaged item is recorded and the table velocity change recorded. The item is inspected to determine if the package is effectively protecting the product. The test may be repeated a number of times to generate multiple impact results.VibrationVibration testing of the packaged item is normally conducted following the procedures outlined in the ASTM Test Procedure D-999, Method B. It consists of subjecting the packaged42product to a series of frequency sweeps at predetermined acceleration levels, then dwelling at the observed resonance frequencies. Since failure is most likely to occur at the resonant frequencies, the test is conducted primarily at those frequencies.The package is fastened to the table of the same vibration system used in Step 2. First the system is operated according to the acceleration-frequency profile of Step 1 to verify the proper product/cushion natural frequency and to verify that no unsuspected problems have been introduced. In general, this task should be conducted in each of the three axes of the package. Then the machine is adjusted to “dwell” at each resonant point (the combination product/cushion natural frequency and all product resonances) for a specified period of time.Determination of the sinusoidal amplitude and the dwell time is, of necessity, rather arbitrary. However, the experience of many testing laboratories has demonstrated that the levels incorporated in the ASTM Test Standards have been effective in screening package designs for potential damage problems.If the package performs as designed for shock and vibration, it is now ready for other tests (compression, temperature, humidity, etc.). If not, it must be modified and retested.SummaryBy following the sequence of the 5-Step Development method, more cost effective packaging and product development will be achieved. And, you will have the confidence that your goods will be able to withstand the hazards of distribution.New Words and Expressionsruggedness n. 强度,坚固性in conjunction with 和…一起to与… 成比例proportionalcushion n,v. 缓冲,软垫 besawtooth a. 锯齿形的 restitution n. 恢复,回复trapezoidal a. 梯形的pneumatic a. 气动的in terms of 根据,按照 sinusoidal a. 正弦的stroboscope n. 频闪仪 inaccordance with 根据,按照encapsulate v. 密封,封装platen n. 模板,冲头accelerometer n. 加速度计oscilloscope n. 示波器attenuation n. 衰减(量)for the sake of 为… 起见,以便Note1.ASTM-----American Society for Testing and Materials美国材料试验协会43。
缓冲包装弹性系数计算公式引言。
在物流和包装领域,缓冲包装是非常重要的,它可以保护产品免受运输过程中的震动和冲击。
为了设计出合适的缓冲包装,我们需要了解材料的弹性系数,以确定包装对产品的保护程度。
本文将介绍缓冲包装弹性系数的计算公式以及其在包装设计中的应用。
缓冲包装的重要性。
在产品运输和储存过程中,产品往往需要经历各种振动和冲击。
如果产品没有得到良好的保护,可能会导致损坏或损失。
因此,缓冲包装的设计对于保护产品的完整性至关重要。
缓冲包装通常使用泡沫材料、气囊、填充物等来减轻外部冲击对产品的影响,但是要确定这些材料的合适性,就需要了解它们的弹性系数。
弹性系数的计算公式。
弹性系数是衡量材料在受力作用下变形程度的一个重要参数。
对于缓冲包装材料来说,弹性系数可以帮助我们确定材料在受到冲击时的变形程度,从而设计出合适的包装结构。
弹性系数的计算公式如下:弹性系数 = 应力 / 应变。
其中,应力是材料受到的力,应变是材料的变形程度。
弹性系数的单位通常是帕斯卡(Pa)。
在实际应用中,我们通常使用材料的应力-应变曲线来计算弹性系数。
通过施加不同的力并测量材料的变形程度,我们可以得到应力-应变曲线,从而计算出弹性系数。
应用举例。
假设我们需要设计一个泡沫填充的缓冲包装,以保护一个易碎的产品。
我们可以先对泡沫材料进行实验,测量其应力-应变曲线。
通过施加不同的力并测量泡沫材料的变形程度,我们可以得到应力-应变曲线,并计算出其弹性系数。
然后,我们可以根据产品的重量和易碎程度,确定所需的泡沫材料的厚度和密度,从而设计出合适的缓冲包装结构。
除了泡沫材料,其他缓冲包装材料的弹性系数也可以通过类似的方法进行计算。
通过了解材料的弹性系数,我们可以更好地选择合适的包装材料,并设计出更有效的缓冲包装结构。
结论。
缓冲包装的设计对于保护产品的完整性非常重要。
了解材料的弹性系数可以帮助我们确定合适的包装材料和结构,从而提高产品在运输和储存过程中的安全性。