微观经济学 格林chap9
- 格式:pdf
- 大小:2.09 MB
- 文档页数:26
平狄克微观经济学第九版课后习题答案与笔记内容简介本书遵循平狄克《微观经济学》(第9版)教材的章⽬目编排,共分4篇19章,每章由三部分组成:第⼀一部分为复习笔记,总结本章的重难点内容;第⼆二部分为课(章)后复习题详解,对第9版的所有课(章)后复习题都进⾏行行了了详细的分析和解答;第三部分为课(章)后练习题详解,对第9版的所有课(章)后练习题都进⾏行行了了详细的分析和解答。
作为该教材的学习辅导书,本书具有以下⼏几个⽅方⾯面的特点:(1)整理理名校笔记,浓缩内容精华。
每章的复习笔记以平狄克所著的《微观经济学》(第9版)为主,并结合国内外其他微观经济学经典教材对各章的重难点进⾏行行了了整理理,因此,本书的内容⼏几乎浓缩了了经典教材的知识精华。
(2)解析课后习题,提供详尽答案。
本书参考⼤大量量经济学相关资料料对平狄克所著的《微观经济学》(第9版)的课(章)后习题进⾏行行了了详细的分析和解答,并对相关重要知识点进⾏行行了了延伸和归纳。
(3)补充相关要点,强化专业知识。
⼀一般来说,国外英⽂文教材的中译本不不太符合中国学⽣生的思维习惯,有些语⾔言的表述不不清或条理理性不不强⽽而给学习带来了了不不便便,因此,对每章复习笔记的⼀一些重要知识点和⼀一些习题的解答,我们在不不违背原书原意的基础上结合其他相关经典教材进⾏行行了了必要的整理理和分析。
⽬目录第1篇 导论:市场与价格 第1章 绪 论 1.1 复习笔记 1.2 课后复习题详解 1.3 课后练习题详解 第2章 供给与需求的基本原理 2.1 复习笔记 2.2 课后复习题详解 2.3 课后练习题详解第2篇 ⽣产者、消费者与竞争性市场 第3章 消费者⾏为 3.1 复习笔记 3.2 课后复习题详解 3.3 课后练习题详解 第4章 个⼈需求与市场需求 4.1 复习笔记 4.2 课后复习题详解 4.3 课后练习题详解 第4章附录 需求理论:⼀种数学的处理⽅法 第5章 不确定性与消费者⾏为 5.1 复习笔记 5.2 课后复习题详解 5.3 课后练习题详解 第6章 ⽣ 产 6.1 复习笔记 6.2 课后复习题详解 6.3 课后练习题详解 第7章 ⽣产成本 7.1 复习笔记 7.2 课后复习题详解 7.3 课后练习题详解 第7章附录 ⽣产与成本理论:⼀种数学的处理⽅法 第8章 利润最⼤化与竞争性供给 8.1 复习笔记 8.2 课后复习题详解 第9章 竞争性市场分析 9.1 复习笔记 9.2 课后复习题详解 9.3 课后练习题详解第3篇 市场结构与竞争策略 第10章 市场势⼒:垄断与买⽅垄断 10.1 复习笔记 10.2 课后复习题详解 10.3 课后练习题详解 第11章 有市场势⼒的定价 11.1 复习笔记 11.2 课后复习题详解 11.3 课后练习题详解 第11章附录 纵向联合⼚商 第12章 垄断竞争与寡头垄断 12.1 复习笔记 12.2 课后复习题详解 12.3 课后练习题详解 第13章 博弈论与竞争策略 13.1 复习笔记 13.2 课后复习题详解 13.3 课后练习题详解 第14章 投⼊要素市场 14.1 复习笔记 14.2 课后复习题详解 14.3 课后练习题详解 第15章 投资、时间与资本市场 15.1 复习笔记 15.2 课后复习题详解第4篇 信息、市场失灵与政府的⾓⾊ 第16章 ⼀般均衡与经济效率 16.1 复习笔记 16.2 课后复习题详解 16.3 课后练习题详解 第17章 信息不对称的市场 17.1 复习笔记 17.2 课后复习题详解 17.3 课后练习题详解 第18章 外部性与公共物品 18.1 复习笔记 18.2 课后复习题详解 18.3 课后练习题详解 第19章 ⾏为经济学 19.1 复习笔记 19.2 课后复习题详解 19.3 课后练习题详解附录 指定平狄克《微观经济学》教材为考研参考书⽬目的院校列列表1.2. 课后习题详解1 ⼈人们常说,⼀一个好的理理论是可以⽤用实证的、数据导向的研究来加以证伪的。


微观经济学框架在我们的日常生活中,经济现象无处不在。
从我们在超市购买食品,到企业决定生产何种产品,再到政府制定经济政策,都离不开经济学的原理和规律。
微观经济学作为经济学的一个重要分支,主要研究个体经济单位的经济行为,包括消费者、生产者以及市场的相互关系。
接下来,让我们一起走进微观经济学的框架,探索其中的奥秘。
微观经济学的核心概念之一是需求与供给。
需求指的是消费者在一定时期内,在各种可能的价格水平下愿意并且能够购买的商品或服务的数量。
供给则是指生产者在一定时期内,在各种可能的价格水平下愿意并且能够提供出售的商品或服务的数量。
需求和供给的相互作用决定了商品的价格。
当需求大于供给时,价格上升;当供给大于需求时,价格下降。
这就像一个看不见的手,在市场中调节着资源的配置。
以苹果手机为例,当新款苹果手机发布时,如果消费者对其需求旺盛,而供给相对有限,那么价格就会较高。
随着时间的推移,生产规模扩大,供给增加,如果需求没有相应大幅增长,价格就会逐渐下降。
这种价格的变化不仅影响了消费者的购买决策,也影响了生产者的生产计划。
消费者行为理论是微观经济学的另一个重要组成部分。
消费者在做出购买决策时,会考虑商品的价格、自身的收入以及个人的偏好等因素。
边际效用递减规律告诉我们,随着消费者对某种商品消费数量的增加,每增加一单位商品所带来的效用增量是逐渐减少的。
比如,当你非常饿的时候,吃第一个面包会给你带来很大的满足感,但当你吃了很多个面包之后,再吃一个面包所带来的满足感就会大大降低。
消费者会通过比较不同商品的边际效用与价格之比来实现效用最大化。
假设你有一定的预算,要在苹果和香蕉之间做出选择。
如果苹果的价格较高,而其带来的边际效用相对较低,你可能会选择购买更多的香蕉,以在有限的预算内获得最大的满足。
生产者行为理论则关注企业如何做出生产决策。
企业的目标是追求利润最大化。
为了实现这一目标,企业需要考虑生产要素的投入、生产技术以及成本等因素。

微观经济学第二章总结效用:是指人们对商品或劳务满足其欲望能力的评价,即消费者在消费商品或劳务时所感受到的满足程度。
边际效用递减规律:基数效用论的基本假定,是指在一定时期内,在其他商品的消费数量保持不变的条件下,随着消费者对某种商品消费量的增加,消费者从该商品连续增加的每一消费单位中所得到的效用增量(即边际效用)是递减的。
消费者均衡:是指在消费者收入及商品价格既定的条件下,消费者效用达到最大并且不再变的一种状态。
条件是MU1/P1=MU2/P2=λ和P1X1+P2X2=m。
消费者均衡点即为无差异曲线与预算约束线的切点。
预算约束线:是指消费者收入和商品价格既定的条件下,消费者的全部收入所能购买到的各种商品的不同数量的组合,假定消费者只消费两种商品,收入为m,则预算约束线方程为P1X1+P2X2=m,在图形中它是一条直线。
无差异曲线:是指可以给消费者带来相同满足程度的不同商品的各种数量组合描绘出来的轨迹。
在一条无差异曲线上,商品的不同数量组合对消费者而言是无差异的,通常具有特点:(1)任意两条无差异曲线都不会相交;(2)无差异曲线有无数条,每一条代表着一个特定的效用等级,并且离原点越远,所代表的效用等级就越高:(3)无差异曲线向右下方倾斜;(4)无差异曲线凸向原点。
商品的边际替代率:在效用水平保持不变的条件下,消费者增加一单位某商品的消费时所放弃的另一种商品的消费数量。
以MRS代表商品的边际替代率,则商品1对商品2的边际替代率可以表示为: MRS1,2=-△X2/△X1,边际替代率的几何意义是无差异曲线斜率的绝对值。
随着第一种商品数量的增加,边际替代率呈递减趋势。
替代效应:在保持效用不变的条件下,由一种商品价格变动从而两种商品的相对价格变动而引起的一种商品对另一种商品的替代被称为价格变动的替代效应。
收入效应:在消费者货币收入不变条件下,由商品价格变动引起消费者实际收入水平的变动所导致商品消费数量的变动被称为价格变动的收入效应。


平狄克微观经济学第九版考研笔记【平狄克微观经济学第九版考研笔记】导语:平狄克微观经济学无疑是经济学领域的经典之作。
该书详尽地介绍了微观经济学理论和应用,并且以其深度和广度的内容对经济学乃至其他领域的研究都具有重要的启发意义。
本文将对平狄克微观经济学第九版进行全面评估,并结合个人观点和理解,为读者带来一份有价值的考研笔记。
一、微观经济学的基础理论(约占总字数的20%)1.需求与供给:在平狄克微观经济学第九版中,对需求与供给的定义和解释非常详细。
需求和供给是市场经济中最基本的两个概念,通过分析需求和供给的曲线,我们可以理解市场价格的形成机制,以及价格变动对市场的影响。
2.价格弹性与收益弹性:价格弹性和收益弹性是衡量市场敏感性和反应程度的指标。
在文章中,平狄克详细解释了价格弹性和收益弹性的计算方法和应用范围,并通过实例分析了它们在市场中的重要性。
3.垄断与竞争:平狄克微观经济学第九版对垄断与竞争的讨论非常深入。
从垄断者的行为和市场竞争的影响等角度,平狄克详细介绍了垄断和竞争的区别和特点,并深入探讨了垄断对市场效率和消费者福利的影响。
二、市场失灵与政府干预(约占总字数的30%)1.外部性与公共物品:外部性和公共物品是市场失灵的两个关键概念。
在平狄克微观经济学第九版中,对它们的定义和实例分析给出了清晰的解释。
通过理解外部性和公共物品的特点,我们可以更好地认识到市场机制的不完善性,从而思考政府干预的必要性。
2.不完全信息与道德风险:在现实社会中,信息不对称和道德风险是市场失灵的另一类原因。
平狄克在本书中详细介绍了信息不完全性和道德风险的形成机制以及对市场的影响。
通过对这两个概念的深入理解,我们可以思考如何利用信息披露和监管等手段来解决市场失灵的问题。
三、行为经济学的新视角(约占总字数的20%)1.效用理论与行为偏差:平狄克微观经济学第九版中对效用理论和行为偏差的介绍非常详细。
通过研究人们的行为决策和偏好,我们可以更好地理解市场行为的规律以及人们的经济选择。
平狄克微观经济学第九版课后习题答案与笔记内容简介本书遵循平狄克《微观经济学》(第9版)教材的章⽬目编排,共分4篇19章,每章由三部分组成:第⼀一部分为复习笔记,总结本章的重难点内容;第⼆二部分为课(章)后复习题详解,对第9版的所有课(章)后复习题都进⾏行行了了详细的分析和解答;第三部分为课(章)后练习题详解,对第9版的所有课(章)后练习题都进⾏行行了了详细的分析和解答。
作为该教材的学习辅导书,本书具有以下⼏几个⽅方⾯面的特点:(1)整理理名校笔记,浓缩内容精华。
每章的复习笔记以平狄克所著的《微观经济学》(第9版)为主,并结合国内外其他微观经济学经典教材对各章的重难点进⾏行行了了整理理,因此,本书的内容⼏几乎浓缩了了经典教材的知识精华。
(2)解析课后习题,提供详尽答案。
本书参考⼤大量量经济学相关资料料对平狄克所著的《微观经济学》(第9版)的课(章)后习题进⾏行行了了详细的分析和解答,并对相关重要知识点进⾏行行了了延伸和归纳。
(3)补充相关要点,强化专业知识。
⼀一般来说,国外英⽂文教材的中译本不不太符合中国学⽣生的思维习惯,有些语⾔言的表述不不清或条理理性不不强⽽而给学习带来了了不不便便,因此,对每章复习笔记的⼀一些重要知识点和⼀一些习题的解答,我们在不不违背原书原意的基础上结合其他相关经典教材进⾏行行了了必要的整理理和分析。
⽬目录第1篇 导论:市场与价格 第1章 绪 论 1.1 复习笔记 1.2 课后复习题详解 1.3 课后练习题详解 第2章 供给与需求的基本原理 2.1 复习笔记 2.2 课后复习题详解 2.3 课后练习题详解第2篇 ⽣产者、消费者与竞争性市场 第3章 消费者⾏为 3.1 复习笔记 3.2 课后复习题详解 3.3 课后练习题详解 第4章 个⼈需求与市场需求 4.1 复习笔记 4.2 课后复习题详解 4.3 课后练习题详解 第4章附录 需求理论:⼀种数学的处理⽅法 第5章 不确定性与消费者⾏为 5.1 复习笔记 5.2 课后复习题详解 5.3 课后练习题详解 第6章 ⽣ 产 6.1 复习笔记 6.2 课后复习题详解 6.3 课后练习题详解 第7章 ⽣产成本 7.1 复习笔记 7.2 课后复习题详解 7.3 课后练习题详解 第7章附录 ⽣产与成本理论:⼀种数学的处理⽅法 第8章 利润最⼤化与竞争性供给 8.1 复习笔记 8.2 课后复习题详解 第9章 竞争性市场分析 9.1 复习笔记 9.2 课后复习题详解 9.3 课后练习题详解第3篇 市场结构与竞争策略 第10章 市场势⼒:垄断与买⽅垄断 10.1 复习笔记 10.2 课后复习题详解 10.3 课后练习题详解 第11章 有市场势⼒的定价 11.1 复习笔记 11.2 课后复习题详解 11.3 课后练习题详解 第11章附录 纵向联合⼚商 第12章 垄断竞争与寡头垄断 12.1 复习笔记 12.2 课后复习题详解 12.3 课后练习题详解 第13章 博弈论与竞争策略 13.1 复习笔记 13.2 课后复习题详解 13.3 课后练习题详解 第14章 投⼊要素市场 14.1 复习笔记 14.2 课后复习题详解 14.3 课后练习题详解 第15章 投资、时间与资本市场 15.1 复习笔记 15.2 课后复习题详解第4篇 信息、市场失灵与政府的⾓⾊ 第16章 ⼀般均衡与经济效率 16.1 复习笔记 16.2 课后复习题详解 16.3 课后练习题详解 第17章 信息不对称的市场 17.1 复习笔记 17.2 课后复习题详解 17.3 课后练习题详解 第18章 外部性与公共物品 18.1 复习笔记 18.2 课后复习题详解 18.3 课后练习题详解 第19章 ⾏为经济学 19.1 复习笔记 19.2 课后复习题详解 19.3 课后练习题详解附录 指定平狄克《微观经济学》教材为考研参考书⽬目的院校列列表1.2. 课后习题详解1 ⼈人们常说,⼀一个好的理理论是可以⽤用实证的、数据导向的研究来加以证伪的。
《微观经济分析》读书记录1. 微观经济学的基本概念在《微观经济分析》作者首先介绍了微观经济学的基本概念。
微观经济学是研究个体经济单位(如家庭、企业等)及其决策行为的理论体系。
它关注的核心问题是如何通过分析个体的决策来理解市场和整个经济体系的行为。
微观经济学的主要研究对象包括需求、供给、价格、生产、成本、收入等方面。
在需求方面,微观经济学研究消费者对商品和服务的需求以及这种需求如何受到各种因素的影响,如收入、价格、偏好等。
微观经济学研究市场供求关系如何影响价格的形成,以及价格变动对消费者和生产者的影响。
微观经济学研究企业在有限资源约束下如何进行生产决策以实现最大利润。
微观经济学研究企业的生产成本以及如何通过降低成本来提高利润。
微观经济学研究个人和家庭的收入来源、分配以及收入分配不平等的问题。
《微观经济分析》这本书通过对微观经济学基本概念的介绍,使读者对微观经济学有了初步的了解,为后续章节的学习奠定了基础。
1.1 消费者行为在开始阅读《微观经济分析》时,我首先被第一章“消费者行为”所吸引。
这一章节详细介绍了微观经济学中的核心要素之一——消费者行为。
它强调了消费者如何在不同的市场环境和经济条件下做出购买决策,以及这些决策如何影响整个经济的供需平衡。
该部分阐述了消费者的基本偏好和对商品与服务的选择行为,详细介绍了影响消费者偏好的各种因素,包括个人喜好、家庭背景、经济状况和社会环境等。
这一部分强调了消费者的选择往往不是简单的、理性的过程,而是一个受多重因素影响的复杂决策过程。
消费者对某一品牌或产品的忠诚度可能受到其口碑、广告、促销活动和价格等多种因素的影响。
这一部分也讨论了消费者的预算约束和收入状况如何影响他们的消费行为。
这些信息对于我们理解消费行为的驱动力具有重要意义,为了理解和掌握这些原理,这一章提到了几种模型如消费者的生命周期模型和生命周期购买阶段模型等,这些都是非常重要的工具。
这些模型有助于我们理解消费者在不同阶段的消费行为模式以及他们如何做出购买决策。
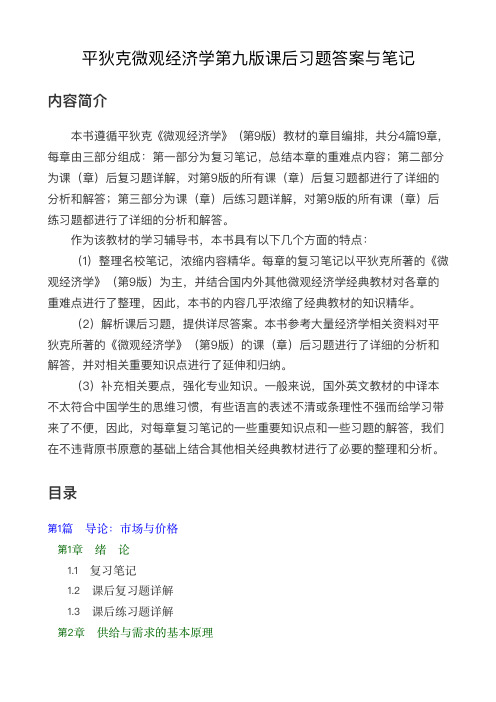
Chapter 9The Analysis of Competitive MarketsReview Questions1. What is meant by deadweight loss? Why does a price ceiling usually result in a deadweight loss?Deadweight loss refers to the benefits lost by consumers and/or producers when markets do not operate efficiently. The term deadweight denotes that these are benefits unavailable to any party. A price ceiling set below the equilibrium price in a perfectly competitive market will result in a deadweight loss because it reduces the quantity supplied by producers. Both producers and consumers lose surplus because less of the good is produced and consumed. The reduced (ceiling) price benefits consumers but hurts producers, so there is a transfer from one group to the other. The real culprit, then, and the primary source of the deadweight loss, is the reduction in the amount of the good in the market.2. Suppose the supply curve for a good is completely inelastic. If the government imposed a priceceiling below the market-clearing level, would a deadweight loss result? Explain.When the supply curve is completely inelastic, it is vertical. In this case there is no deadweight loss because there is no reduction in the amount of the good produced. The imposition of the price ceiling transfers all lost producer surplus to consumers. Consumer surplus increases by the differencebetween the market-clearing price and the price ceiling times the market-clearing quantity.Consumers capture all decreases in total revenue, and no deadweight loss occurs.3. How can a price ceiling make consumers better off? Under what conditions might it make themworse off?If the supply curve is highly inelastic a price ceiling will usually increase consumer surplus because the quantity available will not decline much, but consumers get to purchase the product at a reduced price. If the demand curve is inelastic, on the other hand, price controls may result in a net loss of consumer surplus because consumers who value the good highly are unable to purchase as much as they would like. (See Figure 9.3 on page 321 in the text.) The loss of consumer surplus is greater than the transfer of producer surplus to consumers. So consumers are made better off when demand is relatively elastic and supply is relatively inelastic, and they are made worse off when the opposite is true.4. Suppose the government regulates the price of a good to be no lower than some minimum level.Can such a minimum price make producers as a whole worse off? Explain.With a minimum price set above the market-clearing price, some consumer surplus is transferred to producers because of the higher price, but some producer surplus is lost because consumerspurchase less. If demand is highly elastic, the reduction in purchases can offset the higher priceproducers receive, making producers worse off. In the diagram below, the market-clearing price and quantity are P0 and Q0. The minimum price is set at P', and at this price consumers demand Q'.Assuming that suppliers produce Q' (and not the larger quantity indicated by the supply curve),producer surplus increases by area A due to the higher price, but decreases by the much larger area B because the quantity demanded drops sharply. The result is a reduction in producer surplus. Note thatChapter 9 The Analysis of Competitive Markets141 if suppliers produce more than Q , the loss in producer surplus is even greater because they will have unsold units.5. How are production limits used in practice to raise the prices of the following goods or services:(a) taxi rides, (b) drinks in a restaurant or bar, (c) wheat or corn?Municipal authorities usually regulate the number of taxis through the issuance of licenses ormedallions. When the number of taxis is less than it would be without regulation, those taxis in the market may charge a higher-than-competitive price.State authorities usually regulate the number of liquor licenses. By requiring that any bar or restaurant that serves alcohol have a liquor license and then limiting the number of licenses available, the state limits entry by new bars and restaurants. This limitation allows those establishments that have a license to charge a higher-than-competitive price for alcoholic beverages.Federal authorities usually regulate the number of acres of wheat or corn in production by creating acreage limitation programs that give farmers financial incentives to leave some of their acreage idle.This reduces supply, driving up the price of wheat or corn.6. Suppose the government wants to increase farmers’ incomes. Why do price supports oracreage-limitation programs cost society more than simply giving farmers money?Price supports and acreage limitations cost society more than the dollar cost of these programsbecause the higher price that results in either case will reduce quantity demanded and hence consumer surplus, leading to a deadweight loss because farmers are not able to capture the lost surplus. Giving farmers money does not result in any deadweight loss but is merely a redistribution of surplus from one group to the other.7. Suppose the government wants to limit imports of a certain good. Is it preferable to use animport quota or a tariff? Why?Changes in domestic consumer and producer surpluses are the same under import quotas and tariffs.There will be a loss in (domestic) total surplus in either case. However, with a tariff, the government can collect revenue equal to the tariff times the quantity of imports, and these revenues can beredistributed in the domestic economy to offset some of the domestic deadweight loss. Thus there is less of a loss to the domestic society as a whole with a tariff. With an import quota, foreign producers can capture the difference between the domestic and world price times the quantity of imports.Therefore, with an import quota, there is a loss to the domestic society as a whole. If the national government is trying to minimize domestic welfare loss, it should use a tariff.142Pindyck/Rubinfeld, Microeconomics,Eighth Edition8. The burden of a tax is shared by producers and consumers. Under what conditions willconsumers pay most of the tax? Under what conditions will producers pay most of it? What determines the share of a subsidy that benefits consumers?The burden of a tax and the benefits of a subsidy depend on the elasticities of demand and supply.If the absolute value of the ratio of the elasticity of demand to the elasticity of supply is small, the burden of the tax falls mainly on consumers. If the ratio is large, the burden of the tax falls mainly on producers. Similarly, the benefit of a subsidy accrues mostly to consumers (producers) if the ratio of the elasticity of demand to the elasticity of supply is small (large) in absolute value.9. Why does a tax create a deadweight loss? What determines the size of this loss?A tax creates deadweight loss by artificially increasing price above the free market level, thusreducing the equilibrium quantity. This reduction in quantity reduces consumer as well as producer surplus. The size of the deadweight loss depends on the elasticities of supply and demand and on the size of the tax. The more elastic supply and demand are, the larger will be the deadweight loss. Also, the larger the tax, the greater the deadweight loss.Exercises1. From time to time, Congress has raised the minimum wage. Some people suggested that agovernment subsidy could help employers finance the higher wage. This exercise examines the economics of a minimum wage and wage subsidies. Suppose the supply of low-skilled labor is given by L S= 10w, where L S is the quantity of low-skilled labor (in millions of persons employed each year), and w is the wage rate (in dollars per hour). The demand for labor is given by L D=80 - 10w.a. What will be the free-market wage rate and employment level? Suppose the governmentsets a minimum wage of $5 per hour. How many people would then be employed?In a free-market equilibrium, L S=L D. Solving yields w= $4 and L S=L D= 40. If the minimumwage is $5, then L S= 50 and L D= 30. The number of people employed will be given by the labor demand, so employers will hire only 30 million workers.Chapter 9 The Analysis of Competitive Markets143b. Suppose that instead of a minimum wage, the government pays a subsidy of $1 per hour foreach employee. What will the total level of employment be now? What will the equilibrium wage rate be?Let w s denote the wage received by the sellers (i.e., the employees), and w b the wage paid by the buyers (the firms). The new equilibrium occurs where the vertical difference between the supply and demand curves is $1 (the amount of the subsidy). This point can be found whereL D(w b) =L S(w s), andw s-w b= 1.Write the second equation as w b= w s- 1. This reflects the fact that firms pay $1 less than thewage received by workers because of the subsidy. Substitute for w b in the demand equation:L D(w b) = 80 - 10(w s- 1), soL D(w b) = 90 - 10w s.Note that this is equivalent to an upward shift in demand by the amount of the $1 subsidy. Now set the new demand equal to supply: 90 - 10w s= 10w s. Therefore, w s= $4.50, and L D= 90 -10(4.50) = 45. Employment increases to 45 (compared to 30 with the minimum wage), but wage drops to $4.50 (compared to $5.00 with the minimum wage). The net wage the firm pays falls to $3.50 due to the subsidy.2. Suppose the market for widgets can be described by the following equations:Demand: P= 10 -Q Supply: P=Q- 4where P is the price in dollars per unit and Q is the quantity in thousands of units. Then:a. What is the equilibrium price and quantity?Equate supply and demand and solve for Q: 10 -Q = Q– 4. Therefore Q = 7 thousand widgets.Substitute Q into either the demand or the supply equation to obtain P.P= 10 - 7 = $3.00,orP= 7 - 4 = $3.00.144Pindyck/Rubinfeld, Microeconomics,Eighth Editionb. Suppose the government imposes a tax of $1 per unit to reduce widget consumption andraise government revenues. What will the new equilibrium quantity be? What price will the buyer pay? What amount per unit will the seller receive?With the imposition of a $1.00 tax per unit, the price buyers pay is $1 more than the pricesuppliers receive. Also, at the new equilibrium, the quantity bought must equal the quantitysupplied. We can write these two conditions asP b-P s= 1Q b=Q s.Let Q with no subscript stand for the common value of Q b and Q s. Then substitute the demandand supply equations for the two values of P:(10 -Q) - (Q- 4) = 1Therefore, Q= 6.5 thousand widgets. Plug this value into the demand equation, which is theequation for P b, to find P b= 10 - 6.5 = $3.50. Also substitute Q= 6.5 into the supply equationto get P s=6.5 - 4 = $2.50.The tax raises the price in the market from $3.00 (as found in part a) to $3.50. Sellers, however,receive only $2.50 after the tax is imposed. Therefore the tax is shared equally between buyersand sellers, each paying $0.50.c. Suppose the government has a change of heart about the importance of widgets to thehappiness of the American public. The tax is removed and a subsidy of $1 per unit granted to widget producers. What will the equilibrium quantity be? What price will the buyer pay?What amount per unit (including the subsidy) will the seller receive? What will be the total cost to the government?Now the two conditions that must be satisfied areP s-P b= 1Q b=Q s.As in part b, let Q stand for the common value of quantity. Substitute the supply and demandcurves into the first condition, which yields(Q- 4) - (10 -Q) = 1.Therefore, Q = 7.5 thousand widgets. Using this quantity in the supply and demand equations,suppliers will receive P s= 7.5 - 4 = $3.50, and buyers will pay P b= 10 - 7.5 = $2.50. The totalcost to the government is the subsidy per unit multiplied by the number of units. Thus the cost is ($1)(7.5) = $7.5 thousand, or $7500.3. Japanese rice producers have extremely high production costs, due in part to the highopportunity cost of land and to their inability to take advantage of economies of large-scale production. Analyze two policies intended to maintain Japanese rice production: (1) a per-pound subsidy to farmers for each pound of rice produced, or (2) a per-pound tariff on imported rice.Illustrate with supply-and-demand diagrams the equilibrium price and quantity, domestic rice production, government revenue or deficit, and deadweight loss from each policy. Which policy is the Japanese government likely to prefer? Which policy are Japanese farmers likely to prefer?We have to make some assumptions to answer this question. If you make different assumptions, you may get different answers. Assume that initially the Japanese rice market is open, meaning thatforeign producers and domestic (Japanese) producers both sell rice to Japanese consumers. The worldChapter 9 The Analysis of Competitive Markets145 price of rice is P W. This price is below P0, which is the equilibrium price that would occur in the Japanese market if no imports were allowed. In the diagram below, S is the domestic supply, D is the domestic demand, and Q0 is the equilibrium quantity that would prevail if no imports were allowed. The horizontal line at P W is the world supply of rice, which is assumed to be perfectly elastic. Initially Japanese consumers purchase Q D rice at the world price. Japanese farmers supply Q S at that price, and Q D- Q S is imported from foreign producers.Now suppose the Japanese government pays a subsidy to Japanese farmers equal to the difference between P0 and P W. Then Japanese farmers would sell rice on the open market for P W plus receive the subsidy of P0-P W. Adding these together, the total amount Japanese farmers would receive is P0 per pound of rice. At this price they would supply Q0 pounds of rice. Consumers would still pay P W and buy Q D. Foreign suppliers would import Q D- Q0 pounds of rice. This policy would cost the government (P0-P W)Q0, which is the subsidy per pound times the number of pounds supplied by Japanese farmers. It is represented on the diagram as areas B+E. Producer surplus increases from area C to C+B, so ∆PS=B. Consumer surplus is not affected and remains as area A+B+E+F. Deadweight loss is area E, which is the cost of the subsidy minus the gain in producer surplus.Instead, suppose the government imposes a tariff rather than paying a subsidy. Let the tariff be the same size as the subsidy, P0-P W. Now foreign firms importing rice into Japan will have to sell at the world price plus the tariff: P W+ (P0-P W) =P0. But at this price, Japanese farmers will supply Q0, which is exactly the amount Japanese consumers wish to purchase. Therefore there will be no imports, and the government will not collect any revenue from the tariff. The increase in producer surplus equals area B, as it is in the case of the subsidy. Consumer surplus is area A, which is less than it is under the subsidy because consumers pay more (P0) and consume less (Q0). Consumer surplus decreases by B+E+F. Deadweight loss is E+F: the difference between the decrease in consumer surplus and the increase in producer surplus.Under the assumptions made here, it seems likely that producers would not have a strong preference for either the subsidy or the tariff, because the increase in producer surplus is the same under both policies. The government might prefer the tariff because it does not require any government expenditure. On the other hand, the tariff causes a decrease in consumer surplus, and government officials who are elected by consumers might want to avoid that. Note that if the subsidy and tariff amounts were smaller than assumed above, some tariffs would be collected, but we would still get the same basic results.146Pindyck/Rubinfeld, Microeconomics,Eighth Edition4. In 1983, the Reagan Administration introduced a new agricultural program called thePayment-in-Kind Program. To see how the program worked, let’s consider the wheat market.a. Suppose the demand function is Q D= 28 - 2P and the supply function is Q S= 4 + 4P, whereP is the price of wheat in dollars per bushel, and Q is the quantity in billions of bushels.Find the free-market equilibrium price and quantity.Equating demand and supply, Q D= Q S,28 - 2P= 4 + 4P, or P= $4.00 per bushel.To determine the equilibrium quantity, substitute P= 4 into either the supply equation or thedemand equation:Q S= 4 + 4(4) = 20 billion bushelsandQ D= 28 - 2(4)= 20 billion bushels.b. Now suppose the government wants to lower the supply of wheat by 25% from the free-market equilibrium by paying farmers to withdraw land from production. However, thepayment is made in wheat rather than in dollars—hence the name of the program. Thewheat comes from vast government reserves accumulated from previous price supportprograms. The amount of wheat paid is equal to the amount that could have been harvested on the land withdrawn from production. Farmers are free to sell this wheat on the market.How much is now produced by farmers? How much is indirectly supplied to the market by the government? What is the new market price? How much do farmers gain? Do consumers gain or lose?Because the free-market supply by farmers is 20 billion bushels, the 25% reduction required by the new Payment-In-Kind (PIK) Program means that the farmers now produce 15 billion bushels.To encourage farmers to withdraw their land from cultivation, the government must give them5 billion bushels of wheat, which they sell on the market, so 5 billion bushels are indirectlysupplied by the government.Because the total quantity supplied to the market is still 20 billion bushels, the market price does not change; it remains at $4 per bushel. Farmers gain because they incur no costs for the 5 billion bushels received from the government. We can calculate these cost savings by taking the areaunder the supply curve between 15 and 20 billion bushels. These are the variable costs of producing the last 5 billion bushels that are no longer grown under the PIK Program. To find this area, first determine the prices when Q=15 and when Q = 20. These values are P= $2.75 and P= $4.00.The total cost of producing the last 5 billion bushels is therefore the area of a trapezoid with a base of 20 -15 = 5 billion and an average height of (2.75 + 4.00)/2 = 3.375. The area is 5(3.375) =$16.875 billion, which is the amount farmers gain under the program.The PIK program does not affect consumers in the wheat market because they purchase the same amount at the same price as they did in the free-market case.c. Had the government not given the wheat back to the farmers, it would have stored ordestroyed it. Do taxpayers gain from the program? What potential problems does theprogram create?Taxpayers gain because the government does not incur costs to store or destroy the wheat.Although everyone seems to gain from the PIK program, it can only last while there aregovernment wheat reserves. The program assumes that land removed from production may berestored to production when stockpiles of wheat are exhausted. If this cannot be done, consumersChapter 9 The Analysis of Competitive Markets147 may eventually pay more for wheat-based products. Another potential problem is verifying thatthe land taken out of production is in fact capable of producing the amount of wheat paid tofarmers under the PIK program. Farmers may try to game the system by removing lessproductive land.5. About 100 million pounds of jelly beans are consumed in the United States each year, and theprice has been about 50 cents per pound. However, jelly bean producers feel that their incomes are too low and have convinced the government that price supports are in order. The government will therefore buy up as many jelly beans as necessary to keep the price at $1 per pound.However, government economists are worried about the impact of this program because they have no estimates of the elasticities of jelly bean demand or supply.a. Could this program cost the government more than $50 million per year? Under whatconditions? Could it cost less than $50 million per year? Under what conditions? Illustrate with a diagram.If the quantities demanded and supplied are very responsive to price changes, then a government program that doubles the price of jelly beans could easily cost more than $50 million. In this case, the change in price will cause a large change in quantity supplied, and a large change in quantity demanded. In Figure 9.5.a.i, the cost of the program is ($1)(Q S- Q D). If Q S-Q D is larger than 50 million, then the government will pay more than $50 million. If instead supply and demand arerelatively inelastic, then the increase in price would result in small changes in quantity suppliedand quantity demanded, and (Q S-Q D) would be less than $50 million as illustrated in Figure9.5.a.ii.Figure 9.5.a.iWe can determine the combinations of supply and demand elasticities that yield either result. The elasticity of supply is E S= (%∆Q S)/(%∆P), so the percentage change in quantity supplied is %∆Q S=E S(%∆P). Since the price increase is 100% (from $0.50 to $1.00), %∆Q S= 100E S. Likewise, thepercentage change in quantity demanded is %∆Q D= 100E D. The gap between Q D and Q S inpercentage terms is %∆Q S- %∆Q D= 100E S- 100E D= 100(E S-E D). If this gap is exactly 50% of the current 100 million pounds of jelly beans, the gap will be 50 million pounds, and the cost of the price support program will be exactly $50 million. So the program will cost $50 million if 100(E S-E D) = 50, or148Pindyck/Rubinfeld, Microeconomics,Eighth Edition(E S-E D) = 0.5. If the difference between the elasticities is greater than one half, the program willcost more than $50 million, and if the difference is less than one half, the program will cost less than $50 million. So the supply and demand can each be fairly inelastic (for example, 0.3 and -0.4) and still trigger a cost greater than $50 million.Figure 9.5.a.iib. Could this program cost consumers (in terms of lost consumer surplus) more than $50million per year? Under what conditions? Could it cost consumers less than $50 million per year? Under what conditions? Again, use a diagram to illustrate.When the demand curve is perfectly inelastic, the loss in consumer surplus is $50 million, equal to ($0.50)(100 million pounds). This represents the highest possible loss in consumer surplus, so the loss cannot be more than $50 million per year. If the demand curve has any elasticity at all,the loss in consumer surplus will be less than $50 million. In Figure 9.5.b, the loss in consumersurplus is area A plus area B if the demand curve is the completely inelastic D and only area A if the demand curve is D'.Figure 9.5.bChapter 9 The Analysis of Competitive Markets 1496. In Exercise 4 in Chapter 2 (page 62), we examined a vegetable fiber traded in a competitiveworld market and imported into the United States at a world price of $9 per pound. U.S. domestic supply and demand for various price levels are shown in the following table.PriceU.S. Supply (million pounds) U.S. Demand (million pounds) 32 34 64 28 96 22 128 16 1510 10 18 12 4Answer the following questions about the U.S. market:a. Confirm that the demand curve is given by 402D Q P =-, and that the supply curve is given by 23S Q P =. To find the equation for demand, we need to find a linear function Q D = a + bP so that the line it represents passes through two of the points in the table such as (15, 10) and (12, 16). First, the slope, b , is equal to the “rise” divided by the “run,”10162.1512Q b P ∆-==-=∆- Second, substitute for b and one point, e.g., (15, 10), into the linear function to solve for theconstant, a :102(15),or 40.a a =-=Therefore, Q D = 40 - 2P .Similarly, solve for the supply equation Q S = c + dP passing through two points such as (6, 4) and (3, 2). The slope, d , is422.633Q P ∆-==∆- Solving for c :24(6),or 0.3c c ⎛⎫=+= ⎪⎝⎭Therefore, 2.3S Q P ⎛⎫= ⎪⎝⎭b. Confirm that if there were no restrictions on trade, the United States would import16 million pounds.If there were no trade restrictions, the world price of $9.00 would prevail in the United States. From the table, we see that at $9.00 domestic supply would be 6 million pounds. Similarly,domestic demand would be 22 million pounds. Imports provide the difference between domestic demand and domestic supply, so imports would be 22 - 6 = 16 million pounds.c. If the United States imposes a tariff of $3 per pound, what will be the U.S. price and level ofimports? How much revenue will the government earn from the tariff? How large is thedeadweight loss?With a $3.00 tariff, the U.S. price will be $12 (the world price plus the tariff). At this price,demand is 16 million pounds and U.S. supply is 8 million pounds, so imports are 8 millionpounds (16 - 8). The government will collect $3(8) = $24 million, which is area C in thediagram below. To find deadweight loss, we must determine the changes in consumer andproducer surpluses. Consumers lose area A + B + C + D because they pay the higher price of $12 and purchase fewer pounds of the fiber. U.S. producers gain area A because of the higher priceand the greater quantity they sell. So the deadweight loss is the loss in consumer surplus minus the gain in producer surplus and the tariff revenue. Therefore, DWL = B + D = 0.5(12 - 9)(8 - 6) +0.5(12 - 9)(22 - 16) = $12 million.d. If the United States has no tariff but imposes an import quota of 8 million pounds, what willbe the U.S. domestic price? What is the cost of this quota for U.S. consumers of the fiber?What is the gain for U.S. producers?With an import quota of 8 million pounds, the domestic price will be $12. At $12, the differencebetween domestic demand and domestic supply is 8 million pounds, i.e., 16 million poundsminus 8 million pounds. Note you can also find the equilibrium price by setting demand equal to supply plus the quota so that24028.3P P -=+ The cost of the quota to consumers is equal to area A + B + C + D in the figure above, which isthe reduction in consumer surplus. This equals(12 - 9)(16) + (0.5)(12 - 9)(22 - 16) = $57 million.The gain to domestic producers (increase in producer surplus) is equal to area A , which is(12 - 9)(6) + (0.5)(8 - 6)(12 - 9) = $21 million.7. The United States currently imports all of its coffee. The annual demand for coffee by U.S.consumers is given by the demand curve Q = 250 – 10P , where Q is quantity (in millions ofpounds) and P is the market price per pound of coffee. World producers can harvest and ship coffee to U.S. distributors at a constant marginal (= average) cost of $8 per pound. U.S.distributors can in turn distribute coffee for a constant $2 per pound. The U.S. coffee market is competitive. Congress is considering a tariff on coffee imports of $2 per pound.a. If there is no tariff, how much do consumers pay for a pound of coffee? What is thequantity demanded?If there is no tariff then consumers will pay $10 per pound of coffee, which is found by addingthe $8 that it costs to import the coffee plus the $2 that it costs to distribute the coffee in theUnited States. In a competitive market, price is equal to marginal cost. At a price of $10, thequantity demanded is 150 million pounds.b. If the tariff is imposed, how much will consumers pay for a pound of coffee? What is thequantity demanded?Now add $2 per pound tariff to marginal cost, so price will be $12 per pound, and quantitydemanded is Q = 250 - 10(12) = 130 million pounds.c. Calculate the lost consumer surplus.Lost consumer surplus is (12 - 10)(130) + 0.5(12 - 10)(150 - 130) = $280 million.d. Calculate the tax revenue collected by the government.The tax revenue is equal to the tariff of $2 per pound times the 130 million pounds imported.Tax revenue is therefore $260 million.e. Does the tariff result in a net gain or a net loss to society as a whole?There is a net loss to society because the gain ($260 million) is less than the loss ($280 million).8. A particular metal is traded in a highly competitive world market at a world price of $9 perounce. Unlimited quantities are available for import into the United States at this price. The supply of this metal from domestic U.S. mines and mills can be represented by the equation Q S = 2/3P , where Q S is U.S. output in million ounces and P is the domestic price. The demand for the metal in the United States is Q D = 40 - 2P , where Q D is the domestic demand in million ounces.In recent years the U.S. industry has been protected by a tariff of $9 per ounce. Under pressurefrom other foreign governments, the United States plans to reduce this tariff to zero. Threatened by this change, the U.S. industry is seeking a voluntary restraint agreement that would limit imports into the United States to 8 million ounces per year.a. Under the $9 tariff, what was the U.S. domestic price of the metal?With a $9 tariff, the price of the imported metal in the U.S. market would be $18; the $9 tariffplus the world price of $9. The $18 price, however, is above the domestic equilibrium price. To determine the domestic equilibrium price, equate domestic supply and domestic demand:2402,or $15.3P P P =-=。