图表作文常用的句型
(1)常用的开篇句型(即概述图表内容时常用的表达法)
① According to the table/pie chart/line graph/bar graph, we can see/conclude that …根据该表/图,我们可知……
② The table/graph reveals (shows/indicates/illustrates/ represents/points out) that …该表/图表明……
③ As we can see from the table …
As can be seen from the line/bar graph …
As is shown (illustrated/indicated) in the pie chart …
如表/图所示,……
(2) 描述增减变化常用的句型
① Compared with … is still increased by …
② The number of … grew/rose from … to …
③ An increase is shown in …; then came a sharp increase of …
④ In … the number remains the same/drops to …
⑤ There was a very slight (small/slow/gradual) rise/increase in 1990.
⑥ There was a very steady (marked/sharp/rapid/sudden/ dramatic) drop (decrease/decline/fall/reduction) in 1998/ compared with that of last year).
好,下面我们来看一篇根据例2的题目要求写的范文。
⑴From the graph, we can see that the number of car accidents in Walton city fluctuated during the year of 1990. ⑵The first two months of 1990 showed an increasing trend. ⑶The rate rose to 32 in March but fell to 26 in June. ⑷From June on, the rate was rising again and reached the peak point 39 in August. ⑸After August the rate began to decline remarkably, and eventually dropped to the lowest point 16 at the end of the year. ⑹Therefore, it’s obvious that car accident in Walton
city declined in 1990.⑴主题句/概述表格反映的内容⑵—(5)反映交通事故的变化情况(6)小结:总结表格数据反映的总趋势
⑺There are several reasons for the decline. ⑻First, a new traffic law was made and came into force. ⑼It provided that in summer every car must be air-conditioned. ⑽As a result, the highest rate in August, when humidity and high temperature make drivers impatient and easily lead to car accidents, dropped steadily. ⑾Second, new roads were built and some narrow streets were widened, which quickened the flow of traffic. ⑿Finally, the city administration made great efforts to heighten people’s awareness of observing traffic rules.⑺主题句⑻原因/措施一⑼解释措施一/次要辅助⑽采取措施一后的结果⑾原因/措施二⑿原因/措施三
⒀With all these new measures, I’m sure the rate of car accidents in Walton city will go on falling this year.⒀总结:展望未来的情况
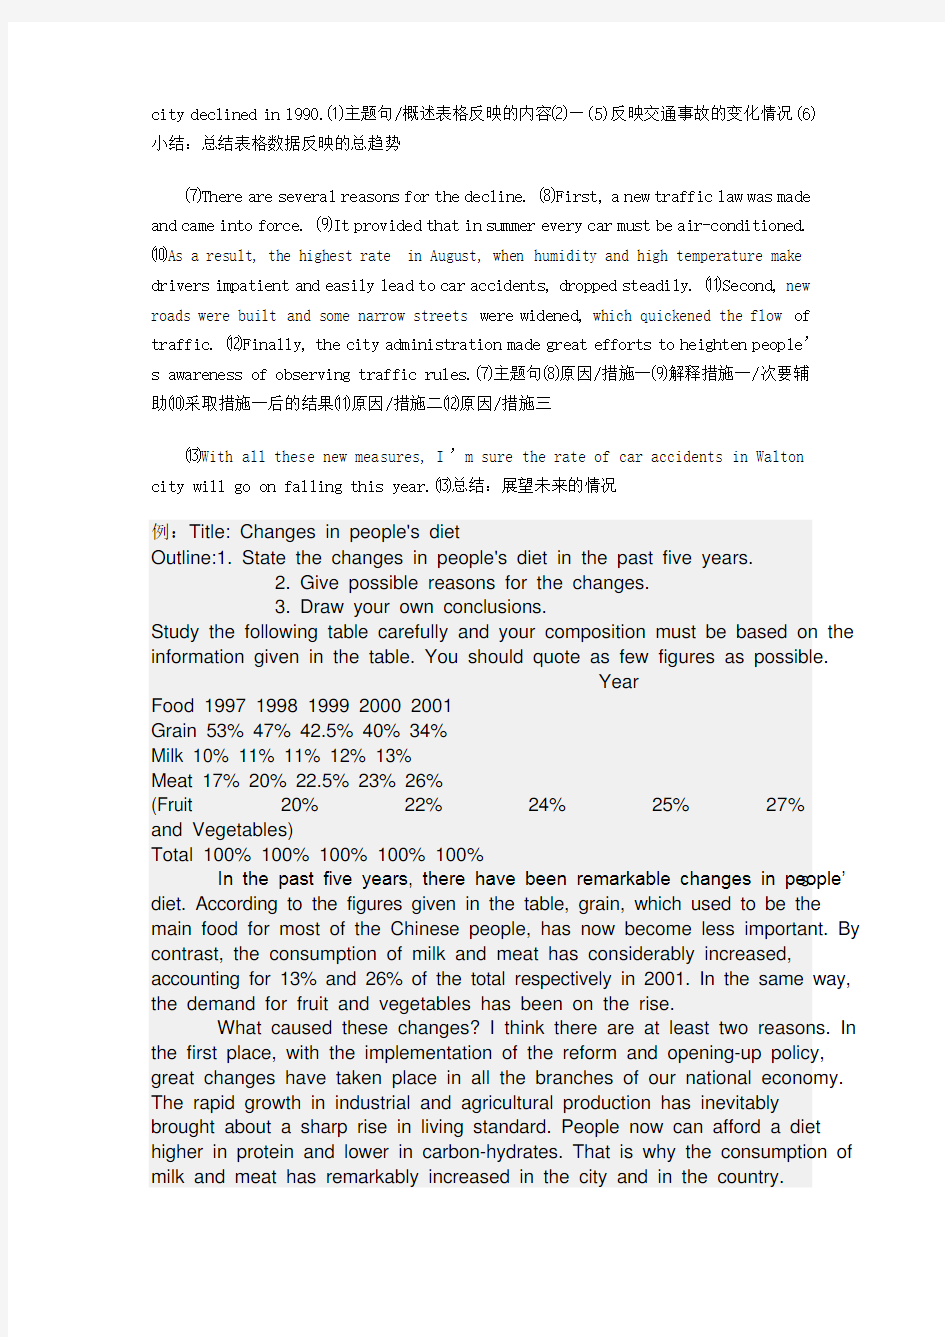
例:Title: Changes in people's diet
Outline:1. State the changes in people's diet in the past five years.
2. Give possible reasons for the changes.
3. Draw your own conclusions.
Study the following table carefully and your composition must be based on the information given in the table. You should quote as few figures as possible.
Year
Food 1997 1998 1999 2000 2001
Grain 53% 47% 42.5% 40% 34%
Milk 10% 11% 11% 12% 13%
Meat 17% 20% 22.5% 23% 26%
(Fruit 20% 22% 24% 25% 27% and Vegetables)
Total 100% 100% 100% 100% 100%
In the past five years, there have been remarkable changes in people’s diet. According to the figures given in the table, grain, which used to be the main food for most of the Chinese people, has now become less important. By contrast, the consumption of milk and meat has considerably increased, accounting for 13% and 26% of the total respectively in 2001. In the same way, the demand for fruit and vegetables has been on the rise.
What caused these changes? I think there are at least two reasons. In the first place, with the implementation of the reform and opening-up policy, great changes have taken place in all the branches of our national economy. The rapid growth in industrial and agricultural production has inevitably brought about a sharp rise in living standard. People now can afford a diet higher in protein and lower in carbon-hydrates. That is why the consumption of milk and meat has remarkably increased in the city and in the country.
Secondly, more attention is now paid to the balanced diet, which is necessary for good health. As a consequence, vegetables and fruit that are rich in vitamins have been in ever-rising demand.
In conclusion, with the change in people’s diet the consumption of fruit, vegetables, milk and meat will gradually increase, while that of grain will continue to decline.
一、图表作文写作常识
1、图形种类及概述法:
泛指一份数据图表:a data graph/chart/diagram/illustration/table
饼图:pie chart
直方图或柱形图:bar chart / histogram
趋势曲线图:line chart / curve diagram
表格图:table
流程图或过程图:flow chart / sequence diagram
程序图:processing/procedures diagram
2、常用的描述用法
The table/chart diagram/graph shows (that)
According to the table/chart diagram/graph
As (is) shown in the table/chart diagram/graph
As can be seen from the table/chart/diagram/graph/figures,
figures/statistics shows (that)……
It can be seen from the figures/statistics
We can see from the figures/statistics
It is clear from the figures/statistics
It is apparent from the figures/statistics
table/chart/diagram/graph figures
(that ) ……
table/chart/diagram/graph
shows/describes/illustrates how…… 3、图表中的数据(Data )具体表达法
数据(Data )在某一个时间段固定不变:fixed in time
在一系列的时间段中转变:changes over time
持续变化的data 在不同情况下:
增加:increase / raise / rise / go up ……
减少:decrease / grow down / drop / fall ……
波动:fluctuate / reboun d / undulate / wave ……
稳定:remain stable / stabilize / level off ……
最常用的两种表达法:
动词+副词形式(Verb+Adverb form )
形容词+名词形式(Adjective+Noun form )
二、相关常用词组
1、主章开头
图表类型:table 、chart 、diagramgraph 、column chart 、pie graph
描述:show 、describe 、illustrate 、can be seen from 、clear 、apparent 、reveal 、represent
内容:figure 、statistic 、number 、percentage 、proportion
2、表示数据变化的单词或者词组
rapid/rapidly 迅速的,飞快的,险峻的
dramatic/dramatically 戏剧性的,生动的
significant/significantly 有意义的,重大的,重要的
sharp/sharply 锐利的,明显的,急剧的 · 全国格斗大赛开始 · 银行卡 安全快捷换Q 币 · 沟通无极限手机Q 时代 · 魔法表情秀出百变心情 · 全国格斗大赛开始 · QQ 秀 秀出个性真自我
steep/steeply 急剧升降的
steady/steadily 稳固的,坚定不移的
gradual/gradually 渐进的,逐渐的
slow/slowly 缓慢的,不活跃的
slight/slightly 轻微的、略微地
stable/stably 稳定的
3、其它在描述中的常用到的词
significant changes 图中一些较大变化
noticeable trend 明显趋势
during the same period 在同一时期
grow/grew 增长
distribute 分布,区别
unequally 不相等地
in the case of adv. 在……的情况下
in terms of / in respect of / regarding 在……方面
in contrast 相反,大不相同
government policy 政府政策
market forces 市场规率
measure n.尺寸,方法,措施v.估量,调节
forecast n.先见,预见v.预测
三、考研英语图表写作套句精选
1.the table shows the changes in the number of……over the period from……to……
该表格描述了在……年之……年间……数量的变化。
2.the bar chart illustrates that……
该柱状图展示了……
3.the graph provides some interesting data regarding……
该图为我们提供了有关……有趣数据。
4.the diagram shows (that)……
该图向我们展示了……
5.the pie graph depicts (that)……
该圆形图揭示了……
6.this is a cure graph which describes the trend of……
这个曲线图描述了……的趋势。
7.the figures/statistics show (that)……
数据(字)表明……
8.the tree diagram reveals how……
该树型图向我们揭示了如何……
9.the data/statistics show (that)……
该数据(字)可以这样理解……
10.the data/statistics/figures lead us to the conclusion that……
这些数据资料令我们得出结论……
11.as is shown/demonstrated/exhibited in the diagram/graph/chart/table……
如图所示……
12.according to the char t/figures……
根据这些表(数字)……
13.as is shown in the table……
如表格所示……
14.as can be seen from the diagram,great changes have taken place in……
从图中可以看出,……发生了巨大变化。
15.from the table/chart/diagram/figure,we can see clearly that……or it is clear/apparent
from the c hart that……
从图表我们可以很清楚(明显)看到……
16.this is a graph which illustrates……
这个图表向我们展示了……
17.this table shows the changing proportion of a & b from……to……
该表格描述了……年到……年间a与b的比例关系。
18.the graph,presented in a pie chart,shows the general trend in……
该图以圆形图形式描述了……总的趋势。
19.this is a column chart showing……
这是个柱型图,描述了……
20.as can be seen from the graph,the two curves show the flutuation of……
如图所示,两条曲线描述了……的波动情况。
21.over the period from……to……the……remained level.
在……至……期间,……基本不变。
22.in the year between……and……
在……年到……期间……
23.in the 3 years spanning from 1995 through 1998……
1995年至1998三年里……
24.from then on/from this time onwards……
从那时起……
25.the number of……remained steady/stable from (month/year) to (month/year)。
……月(年)至……月(年)……的数量基本不变。
26.the number sharpl y went up to……
数字急剧上升至……
27.the percentage of……stayed the same between……and……
……至……期间……的比率维持不变。
28.the figures peaked at……in(month/year)
……的数目在……月(年)达到顶点,为……
29.the percentage remained steady at……
比率维持在……
30.the percentage of……is sightly larger/smaller than that of……
……的比例比……的比例略高(低)。
31.there is not a great deal of difference between……and……
……与……的区别不大。
32.the graphs show a threefold increase in the number of……
该图表表明……的数目增长了三倍。
33……decreased year by year while……increased steadily.
……逐年减少,而……逐步上升。
34.the situation reached a peak(a high point at) of[%].
……的情况(局势)到达顶(高)点,为……百分点。
35.the figures/situation bottomed out in……
数字(情况)在……达到底部。
36.the figures reached the bottom/a low point/hit a trough.
数字(情况)达到底部(低谷)。
37.a is ……times as much/many as b.
a是b的……倍
高中英语作文常用句型和经典句型 这篇关于高中英语作文常用句型和经典句型,是特地为大家整理的,希望对大家有所帮助! 高中英语作文常用句型 一、根据衔接词本身在文章中起到的作用,主要分为以下四类,即“起”、“承”、“转”、“合”。 (一)表示“起”的词/词组:用于开篇引出扩展句。 at first 最初for one thing…(for another) at present 现在;当今首先…(其次)… currently 目前;最后 recently 最近 first(ly)第一 in general 一般说来 in the beginning 起初one the one hand…(on the other hand) to begin with 首先;第一一方面…(另一方面) first of all 首先;第一 generally speaking 一般地说 in the first place 首先;第一 on the whole 总起来说 lately 最近 to start with 首先;第一
presently 现在;此刻 now 现在 (二)有关“承”的常用词语:用来承接上文。 after/after that/afterwards此后 by this time 此时after a few days 几天以后 certainly 无疑地;当然地after a while过了一会儿 therefore 因此;结果 also/too 并且;又 for example 例如 at the same time 同时 for instance 例如 beside 此外 for this purpose 为了这个目的 Besides/what,s more 而且;此外 from now on 从此 in addition 此外 second 第二;第二点 in addition to… 除…之外 secondly 第二 in fact 事实上 similarly 同样地 in other words 换句话说 so 所以 in particular 特别(地) soon 不久 in the same way 同样地 still 仍然 by the way 顺便提一句 then 然后
1 起伏不定go up and down / fluctuate/ be unstable/ be in flexible 2 The first point to note is the huge increase in the number of 需要注意的第一点就是…的急剧增 长 3 The statistics show that 这些数据表明 4 占百分之几 Form/comprise/make up/constitute/ account for ….percent 5 This graph describes the trend of 该图描述了…的趋势
6 The statistics lead us to the conclusion that 由这些数据,我们可以做出如下结论 8 增加:Increase / raise / rise / go up/ soar/ ascend/ mount/ climb 9 减少:Decrease / go down / drop / fall/ reduce/ descend/ shrink /decline/sink 10 稳定:Remain stable / stabilize / level off/ remain unchanged 11 It can be seen from the table that 由表格我们可以看出 12 The table shows the changes in the number of… over the period from…to… 该表格展示了从…到…数据的变化
IELTS套句式写作大全 第一部分:TASK1图表写作套句精选 1.the table shows the changes in the number of...over the period from...to... 该表格描述了在...年之...年间...数量的变化。 2.the bar chart illustrates that... 该柱状图展示了... 3.the graph provides some interesting data regarding... 该图为我们提供了有关...有趣数据。 4.the diagram shows (that)... 该图向我们展示了... 5.the pie graph depicts (that).... 该圆形图揭示了... 6.this is a cure graph which describes the trend of... 这个曲线图描述了...的趋势。 7.the figures/statistics show (that)... 数据(字)表明... 8.the tree diagram reveals how... 该树型图向我们揭示了如何... 9.the data/statistics show (that)... 该数据(字)可以这样理解... 10.the data/statistics/figures lead us to the conclusion that... 这些数据资料令我们得出结论... 11.as is shown/demonstrated/exhibited in the diagram/graph/chart/table... 如图所示... 12.according to the chart/figures... 根据这些表(数字)... 13.as is shown in the table... 如表格所示... 14.as can be seen from the diagram,great changes have taken place in... 从图中可以看出,...发生了巨大变化。 15.from the table/chart/diagram/figure,we can see clearly that...or it is clear/apparent from the chart that... 从图表我们可以很清楚(明显)看到... 16.this is a graph which illustrates... 这个图表向我们展示了... 17.this table shows the changing proportion of a & b from...to... 该表格描述了...年到...年间a与b的比例关系。 18.the graph,presented in a pie chart, shows the general trend in... 该图以圆形图形式描述了...总的趋势。 19.this is a column chart showing... 这是个柱型图,描述了... 20.as can be seen from the graph,the two curves show the flutuation of... 如图所示,两条曲线描述了...的波动情况。 21.over the period from...to...the...remained level. 在...至...期间,...基本不变。 22.in the year between...and... 在...年到...期间... 23.in the 3 years spanning from 1995 through 1998... 1995年至1998三年里... 24.from then on/from this time onwards... 从那时起... 25.the number of...remained steady/stable from (month/year) to (month/year). ...月(年)至...月(年)...的数量基本不变。 26.the number sharply went up to... 数字急剧上升至...
这些常用句型,熟记后,基本都可以在写作文的时候运用上。也不用绞尽脑汁去想如何表达自己的意思了。 1.While many people attach great importance to this issue, no real effective actions have been taken to solve it. Therefore, we should do our utmost in doing something to solve it. 尽管很多人非常重视这个问题,然而一直以来并没有采取真正有效的解决措施,因此,我们应该尽最大努力来解决这一问题。 2.After a good many years of efforts to/ enthusiasm for..., people begin to... 经过许多年的努力/热衷于……多年之后,人们开始…… 例句:After a good many years of enthusiasm for fighting in the city, people begin to try to live a comfortable life in the country. 热衷于在城市拼搏多年之后,人们开始想在小城镇过上舒适的生活。 3.Recently, the problem of...has aroused people's concern. 最近,……问题已引起人们的关注。 例句:Recently, the problem of abandoning animals has aroused people's concern. 最近,遗弃动物这个问题已引起人们的关注。 4.As far as I am concerned, the advantages of...is more than disadvantages. 我认为……利大于弊。 例句:As far as I am concerned, the advantages of establishing library in town is more than disadvantages. 我认为在城镇建立图书馆利大于弊。 5....has been playing an increasingly important role in our day-to-day life. It has brought a lot of benefits but has created some serious problems as well.
英语图表常用句型词组. 英语图表作文写作常识50例 一、图表作文写作常识 1、图形种类及概述法: 泛指一份数据图表:a data graph/chart/diagram/illustration/table 饼图:pie chart 直方图或柱形图:bar chart / histogram 趋势曲线图:line chart / curve diagram 表格图:table
流程图或过程图:flow chart / sequence diagram 程序图:processing/procedures diagram 2、常用的描述用法 The table/chart diagram/graph shows (that) According to the table/chart diagram/graph As (is) shown in the table/chart diagram/graph As can be seen from the table/chart/diagram/graph/figures,figures/statistics shows (that)…… It can be seen from the figures/statistics We can see from the figures/statistics It is clear from the figures/statistics It is apparent from the figures/statistics table/chart/diagram/graph figures (that) …… table/chart/diagram/graph shows/describes/illustrates
雅思基础班图表作文期末汇总卷 Part One 图表作文各部分句型总结: 开头段句型总结: 1. This is a diagram/ chart /figure which shows how people obtain water in the wild in order to survive. 2. This is a chart which shows the trend of oil supply and dema nd. 3. This is a colu mn chart show ing … 4. The diagram illustrates /describes/ depicts the cha nges in nu mber of male teachers from 1998 to 1999 5. The bar chart illustrates the nu mber of overseas stude nts from five develop ing coun tries. 6. The graph, prese nted in a pie form, shows the gen eral trend in … 基本句型: shows /show nu mber 定语从句 betwee n and . 过去分词 + over a spa n of years/ mon ths 现在分词 in the year and . (修饰语/定语) procedure 等 类似句型: The chart + is/are + the proporti on of + A/B + from to . Diagram reflects /reflect average in come Graph states /state sales volume bar chart illustrates/illustrate perce ntages table displays /display expe nse two pie charts compares /compare in come A and B reveals /reveal 等 cha nges/ freque ncy
考研英语图表类作文常用词汇及句型 2015-09-22屠屠英语 1、主章开头 图表类型:table、chart、diagram、graph、column chart、pie graph 描述:show、describe、illustrate、can be seen from、clear、apparent、reveal、represent 内容:figure、statistic、number、percentage、proportion 2、表示数据变化的单词或词组 rapid/rapidly 迅速的,飞快的,险峻的dramatic/dramatically 戏剧性的,生动的 significant/significantly 有意义的,重大的,重要的sharp/sharply 锐利的,明显的,急剧的steep/steeply 急剧升降的steady/steadily 稳固的,坚定不移的 gradual/gradually 渐进的,逐渐的 slow/slowly 缓慢的,不活跃的 slight/slightly 轻微的、略微地stable/stably 稳定的 3、图表中的数据(Data)具体表达法 数据(Data)在某一个时间段固定不变:fixed in time 在一系列的时间段中转变:changes over time 持续变化的data在不同情况下: 增加:increase / raise / rise / go up …… 减少:decrease / grow down / drop / fall …… 波动:fluctuate / rebound / undulate / wave …… 稳定:remain stable / stabilize / level off …… 最常用的两种表达法:动词+副词形式(Verb+Adverb form)形容词+名词形式(Adjective+Noun form) 4、其它在描述中的常用到的词 significant changes 图中一些较大变化noticeable trend 明显趋势during the same period 在同一时期 grow/grew 增长 distribute 分布,区别unequally 不相等地in the case of adv. 在……的情况下 in terms of / in respect of / regarding 在……方面 in contrast 相反,大不相同
英语作文万能句型 1、提出现象句型: ①Nowadays,it is common to find that......(如今,......很常见) ②In recent decades,with the rapid development of......,more and more......(近年来,随着......的快速发展,越来越多......) ③....has been gaining in popularity in recent years in China,particularly among young people.(....近年来在中国变得越来越流行,在年轻人中尤其受欢迎。) 2、引出不同观点句型: ①When it comes to ......, some people like to.......,while others choose to ...... (说到......,有的人喜欢......,有的人则选择......) ②There have been different opinions on this issue.Some people are in favor of.....However, other people hold a quit different point of view.(人们对此看法不一。一些人赞同....。然而,其他人则持不同观点) 3、分析原因句型 This phenomenon can be attributed to several main reasons. First,.....。Second,....。Third,.....。(这个现象可归因于几个主要原因。首先.....其次.....再次......) 4、分析利弊/优缺点句型 As is the case with many issues,...have both merits and dmerits.On the one hand,......On the other hand......(正如其他许多事物一样,......也是有利有弊的。一方面,......。另一方面,......。)
英语作文漫画图表常用句型 1.The cartoon/picture briefs/depicts/shows... 例句:The cartoon briefs the history of commercial fishing in the 20th cent ury. 2.In the picture, ... 例句:In the picture, an American girl looks so pleased in the richly decora ted Chinese national costumes. 3.Looking at the picture, ... 例句:Looking at the picture, many people cannot help laughing. ... 4....。This is what the picture indicates. 例句:It is not unusual for Chinese children to get money from their paren ts, grandparents or relatives during the Spring Festival. ... This is what th e picture indicates. 5.The two pictures here illustrate... 例句:The two pictures here illustrate how a flower in a greenhouse is des troyed when exposed to a storm. 6.In the first picture, .... While in the second one, ... 例句:In the first picture, a lonely small boat, in spite of the good catch, d oes not disturb the fishes that are swimming leisurely. While in the secon d one, the sea is over-crowded with fishing boats, and a lonely fish, desp erately trying to escape, finds no place to hide. 7.As depicted in the picture/As we can see in the picture/As can been se en from the picture/As is shown by the drawing, ... 例句:As can be seen from the picture, the car breaks stops on the way a nd cannot move any further.
图表类英语四级作文常用句型 开篇句式 1)According to the figures given in the table,+ 主题句(the world population is increasing rapidly. 2)The table(pie chart, line graph, bar graph) shows( indicates, illustrates, makes it clear) that +主题句(One’s income is closely linked to one’s age and education) 3) It can be seen from (It is clear from, It is evident from, It is illustrated from the table that + 主题句(the better one is educated , the higher his income is) 4) As the bar chart shows, the number of people below poverty line decreased dramatically during the years of 1978 to 1998. 图表式作文模板 写作模板——图表式作文 It is obvious in the graphic/table that the rate/number/amount of Y has undergone dramatic changes. It has gone up/grown/fallen/dropped considerably in recent years (as X varies). At the point of X1, Y reaches its peak value of …(多少). What is the reason for this change? Mainly there are … (多少)reasons behind the situation reflected in the graphic/table. First of all, …(第一个原因). More importantly, …(第二个原因). Most important of all, …(第三个原因). From the above discussions, we have enough reason to predict what will happen in the near future. The trend described in the graphic/table will continue for quite a long time (if necessary measures are not taken括号里的使用于那些不太好的变化趋势). 1.the table sho ws the changes in the number of……over the period from……to…… 该表格描述了在……年之……年间……数量的变化。 2.the bar chart illustrates that…… 该柱状图展示了…… 3.the graph provides some interesting data regarding…… 该图为我们提供了有关……有趣数据。 4.the diagram shows (that)…… 该图向我们展示了…… 5.the pie graph depicts (that)…… 该圆形图揭示了…… 6.this is a cure graph which describes the trend of……
2 The first point to note is the huge increase in the number of 需要注意的第一点就是…的急剧增长 3 The statistics show that 这些数据表明 4 占百分之几Form/comprise/make up/constitute/ account for ….percen t 5 This cure graph describes the trend of 该曲线图描述了…的趋势 6 The statistics lead us to the conclusion that 由这些数据,我们可以做出如下结论 7 As can be seen from the line graph, 由线状图我们可以看出 8 增加:Increase / raise / rise / go up/ soar/ ascend/ mount/ climb 9 减少:Decrease / grow down / drop / fall/ reduce/ descend/ shrink to/decline 10 稳定:Remain stable / stabilize / level off/ remain unchanged 11 It can be seen from the table that 由表格我们可以看出 12 The table shows the changes in the number of… over the period from…to…该表格展示了从…到…数据的变化 13 The table provides some data of 该表格提供了有关…的数据 14 As can be seen clearly from the table, 从表格中我们可以清楚地看出, 15 As can be seen from the table, great changes have taken place in... 从表格中可以看出,...发生了巨大变化 16 This table illustrates the changing proportion of A and B from...to... 该表格描述了...年到...年间a与b的比例关系 17 急剧地sharply, steeply, dramatically, drastically, suddenly 18 显著地,considerably, significantly, noticeably, remarkably, rapidly 19 稳步地, 逐渐地steadily, moderately, gradually, smoothly 20 轻微地, 缓慢地slightly, slowly, mildly, moderately 21 The following diagram shows the structure of...... 以下的图展示了...的结构 22 The picture illustrates...... 该图展示了... 23 It mainly consists of following steps. 它主要包括以下步骤 24 The whole procedure can be divided into...stages. 整个的过程可以分为...步 25 The first step is to 第一步是...
词语是语言的内容,句型是言语的框架。如果只有词语,而没有组织词语的句型,语言就难有深度,难成逻辑。所以熟记一些在文章的不同位置和用于表达不同逻辑的常用句型是英语初、中级学习者必须完成的一项任务。因此在本章中特别编辑了一些在英语写作中常用的句型,供大家在学习和实践中参考使用。 常用于引言段的句型 1. Some people think that …. To be frank, I can not agree with their opinion for the reasons below. 2. For years, … has been seen as …, but things are quite different now. 3. I believe the title statement is valid because…. 4. I cannot entirely agree with the idea that …. I believe…. 5. My argument for this view goes as follows. 6. Along with the development o f…, more and more…. 7. There is a long-running debate as to whether…. 8. It is commonly/generally/widely/ believed /held/accepted/recognized that…. 9. As far as I am concerned, I completely agree with the former/ the latter. 10. Before giving my opinion, I think it is essential to look at the argument of both sides. 常用于正文段的句型 一、表示比较和对比的常用句型和表达法 1. A is completely / totally / entirely different from B. 2. A and B are different in some/every way / respect / aspect. 3. A and B differ in…. 4. A differs from B i n…. 5. The difference between A and B is/lies in/exists in…. 6. Compared with/In contrast to/Unlike A, B…. 7. A…, on the other hand,/in contrast,/while/whereas B…. 8. While it is generally believed that A …, I believe B…. 9. Despite their similarities, A and B are also different. 10. Both A and B …. However, A…; on the other hand, B…. 11. The most striking difference is that A…, while B…. 二、演绎法常用的句型 1.There are several reasons for…, but in general, they come down to three major ones. 2.There are many factors that may account for…, but the following are the most typical ones. 3.Many ways can contribute to solving this problem, but the following ones may be most effective. 4.Generally, the advantages can be listed as follows. 5.The reasons are as follows. 三、因果推理法常用句型 1. Because/Since we read the book, we have learned a lot. 2. If we read the book, we would learn a lot. 3. We read the book; as a result / therefore / thus / hence / consequently / for this reason / because of this,
英语六级图表作文常用句型总结 为了帮助考生们更好地复习六级考试, 网为各位考生整理了英语六级图表作文常用句型,供考生们参考使用。 以下是图表作文常用的表达法: 1. According to the figures shown in the table/graph we can see/conclude that... 例句:According to the figures shown in the table, we can see that great changes have been taking place in people's diet over the period from 1988 to 1998. 2. We can see/We have noted/It can be seen from the table/chart/graph that... 例句:We have noted from the graph that there is a wide gap between the top ten universities both of China and of the world. 3. The graph/table/chart shows/indicates/reveals/points out that... 例句:The chart reveals that the number of road accidents is spiraling upward every year as more and more highways are constructed all over China. 4. As is shown/can be seen in the chart/graph/diagram
中考英语作文万能模板及万能句型汇总 作文万能模板 一、阐述主题题型 要求从一句话或一个主题出发,按照提纲的要求进行论述. 1.阐述名言或主题所蕴涵的意义.2.分析并举例使其更充实. 二、解决方法题型 要求考生列举出解决问题的多种途径 1.问题现状2.怎样解决(解决方案的优缺点) In recent days,we have to face a problem-----A,which is becoming more and more serious. First,------------(说明A的现状).Second,---------------(举例进一步说明现状)Confronted with A,we should take a series of effective measures to cope with the situation. For one thing,---------------(解决方法一)。For another -------------(解决方法二)。Finally,--------------(解决方法三)。 Personally,I believe that -------------(我的解决方法)。Consequently,I’m confident that a bright future isawaiting us because --------------(带来的好处)。 三、说明利弊题型 这种题型往往要求先说明一下现状,再对比事物本身的利弊,有时也会单从一个角度(利或弊)出发,最后往往要求考生表明自己的态度(或对事物前景提出预测) 1.说明事物现状2.事物本身的优缺点(或一方面)3.你对现状(或前景)的看法Nowadays many people prefer A because it has a significant role in our daily life. Generally,its advantages can be seen as follows. First ----------------(A的优点之一)。Besides -------------------(A的优点之二)。 But every coin has two sides. The negative aspects are also apparent. One of the important disadvantages is that ----------------(A的第一个缺点).To make matters worse,------------------(A的第二个缺点). Through the above analysis,I believe that the positive aspects overweigh the negative ones. Therefore,I would like to ---------------(我的看法).(From the comparison between these positive and negative effects of A,we should take it reasonably and do it according to the circumstances we are in. Only by this way,---------------(对前景的预测).)
图表作文常用句型 ●表示“说明”的常用句式 在说明图表的时候,要使用下列表示“说明”的常用句式,它们可以帮助读者弄清楚所引信息的出处,有效地将你要说的话带出来。 1.As we can see from the chart/graph / table/diagram,…从图表中可以看出…… 2.The chart/graph / table/diagram shows/displays that,…如图所示…… 3.As can be shown in/According to the chart/graph / table/diagram,…如图所示……4.The figures/statistics in the chart reflect/show/reveal that… 图表中的数据表明…… 5.The chart/graph/table/diagram illustrates/describes…图表描述了…… 6.It is clear/apparent from the chart/graph / table/diagram that… 从图表我们可以清楚地看到…… ●表示“数据”的常用句式 1.…had the largest percentage/proportion of… ……在……方面具有很大的百分比。2.…account (s) for/take (s) up 10%.……占有10%。 3.Compared with A, B has a higher percentage. 与A相比,B有更高的比例。 4.On the top of the list is…, which accounts for 60%.占比重最高的是……,占60%。 5.At the b ottom is…, which takes up 20%.占最低比重的是……,占20%。 6.A is second to B. A仅次于B。 7.A is ranked/rated first, followed by B at 30%and C at 25%. A占最高比重,紧随其后的是占30%的B和占25%的C。 ●表示“数据变化”的常用句式 在描述图表的过程中,考生有必要对图表的数据进行描述,因此,掌握相应地表示变化的句式也是相当重要的。 a.表示增加、减少和波动的常用结构 1.The number of (private cars) increased/rose suddenly/rapidly/dramatically/substantially /considerably/sharply/steeply from…to…从……到……期间,(私家车)的数量有了急剧的增长。 2.There was a sudden/rapid/dramatic/substantial/considerable/sharp/steep increase/rise in the number of (pr ivate cars) from…to…从……到……期间,(私家车)的数量有了急剧的增长。 3.There was a boom in the number of (private cars) from…to… 从……到……期间,(私家车)的数量有了急剧的增长。 4.The number of (private cars) climbed/jumped/rose suddenly/went sharply up/soared to…in…在……(时间),(私家车)的数量猛增到……(辆)。 5.There was an evident/apparent/obvious increase in…from…to….从……到……期间,在……方面有明显的增长。 6.The number of (private cars) increased/rose steadily/gradually from…to…从……到……期间,(私家车)的数量有了稳定持续的增长。 7.There was a steady/gradual increase/rise in the number of (private cars) from…to… 从……到……期间,(私家车)的数量有了稳定持续的增长。 8.There was a slight/slow increase/rise in the number of (private cars) from…to…从……到……期间,’ (私家车)的数量有了稍微/缓慢的增长。 9.The number of (private cars)increased/rose slightly/slowly from…to… 从……到……期间,(私家车)的数量有了稍微/缓慢的增长。 10.The number of (private cars) decreased/fell/dropped suddenly/rapidly/dramatically/