巴中市人民政府办公室关于认真做好止滑促升保持工业稳定增长的紧急通知
- 格式:doc
- 大小:25.00 KB
- 文档页数:2

广西鹿寨经济开发区循环化改造示范试点实施方案(修订本)申报单位:广西鹿寨经济开发区管理委员会编制单位:广西华盛工程咨询有限公司编制时间:二○一三年十月主编:宋彦彦黄积候副主编:苏志明徐引想参编:覃秀凤王欣荣黄承都邓菁欧韦福张云天许鹏阳丰元沈琰利杨维庞中健吕广权李永佳马梁安覃耀进赵钢郑幼宁李阳韦晓兰汪盛麒目录前言 (1)第一章鹿寨县及园区现状和发展基础 (1)一、鹿寨县位置、资源、环境和经济社会发展情况 (1)(一)鹿寨县的位置 (1)(二)资源现状 (2)(三)环境现状 (3)(四)社会经济情况 (4)二、园区概况 (5)(一)园区地理位置 (5)(二)园区功能划分 (6)三、园区经济发展和产业基础 (9)四、园区社会发展和基础设施 (14)(一)园区内人口状况和科、教、文、卫状况 (14)(二)园区基础设施状况和道路交通状况 (15)五、园区与周边区域的产业关联、基础设施和服务平台共享情况 (16)(一)产业关联 (16)(二)基础设施共享 (18)(三)服务平台共享 (19)六、园区资源和环境现状 (19)(一)园区主要能源和资源的消耗水平 (19)(二)园区资源产出和“十一五”节能减排目标完成情况 (21)(三)污染源数量和分布 (24)(四)主要污染物特征和产排污量 (26)(五)重点污染源排放达标情况 (27)(六)潜在的环境风险和应急方案 (29)(七)园区建址的环境敏感分析 (31)(八)区域环境质量 (31)(九)区域环境容量和环境承载力 (33)(十)环境法律法规的贯彻执行 (34)(十一)环保投入 (34)(十二)环境管理 (35)第二章园区发展面临的问题和循环化改造的重要意义 (37)一、园区发展面临的主要问题 (37)(一)资源环境承载压力大 (37)(二)资源利用率低 (37)(三)企业产业链条短 (38)(四)土地资源利用率不高 (38)(五)企业创新能力不强 (38)二、园区循环化改造的意义 (39)(一)循环化改造是节能减排的途径 (39)(二)循环化改造是延长产业链的需要 (39)(三)循环化改造是提升地区综合竞争力的途径 (40)(四)循环化改造是优化区域生态环境的重要手段 (41)第三章循环化改造的有利条件和制约因素 (42)一、有利条件分析 (42)(一)产业结构具备循环化改造基础条件 (42)(二)资源环境、基础设施、周边产业配套 (42)(三)企业主动参与循环化改造 (43)(四)技术条件成熟 (43)二、制约因素分析 (43)(一)地块划分松散不规则 (43)(二)基础设施不够完善 (43)(三)改造资金不足 (44)第四章总体思路、原则和目标 (45)一、总体思路 (45)(一)改变经济发展方式 (45)(二)确立园区内化工产业的主导地位 (45)(三)承接柳州市和东部地区产业转移 (45)(四)完善园区公共服务设施建设 (46)二、基本原则 (46)(一)坚持存量优化与增量严控相结合的原则 (46)(二)坚持政府引导与市场运作并举的原则 (47)(三)坚持经济效益和生态环境效益相结合的原则 (47)(四)坚持择优扶强与重点突破相结合的原则 (47)(五)坚持技术进步与强化管理相结合的原则 (48)三、主要目标 (48)(一)总体目标 (48)(二)具体目标 (49)(三)目标可达性分析 (52)(四)园区物质流分析 (55)第五章园区循环化改造主要任务 (61)一、空间布局 (61)(一)优化空间布局 (62)(二)提高土地利用率 (65)(三)构建物质交换系统 (65)(四)布局重要节点企业 (66)(五)优化园区产业布局 (66)二、产业结构调整 (67)(一)做大做强化工产业,增加化肥的比重 (67)(二)加强化工产业的横向联系,构建多种化工产品链 (70)(三)加强建材产业的循环化建设 (71)(四)采用新技术进行节能减排技改 (72)(五)中小企业规模化改造 (73)(六)淘汰落后产能 (73)三、循环经济产业链构建 (74)(一)企业与企业间以物质利用为基础的循环链建设 (74)(二)园区内基础设施建设与共享 (78)四、高效利用能源资源途径 (80)(一)应用先进技术提高能源和资源利用率 (80)(二)提高水资源重复利用率 (80)五、污染治理 (81)(一)固废处理体系 (81)(二)减少废水排放 (81)(三)污水处理 (81)(四)废气减排 (82)(五)环境风险防范措施 (82)六、基础设施优化改造 (84)七、循环化的运行管理 (85)第六章重点支撑项目 (91)一、重点支撑项目概述 (91)(一)拟申请专项资金支持的循环化改造项目 (91)(二)不申请中央财政资金支持的自主实施项目 (92)(三)项目对重点任务的支撑作用 (93)二、申请专项资金支持的重点支撑项目基本情况 (104)(一)广西鹿寨化肥有限公司硫酸尾气二氧化硫减排项目 (104)(二)广西鹿寨化肥有限公司年产3万吨工业磷酸一铵联产复合肥项目 (106)(三)广西鹿寨化肥有限公司硫酸渣制铁精矿粉项目 (109)(四)广西柳化氯碱有限公司利用富余盐酸年产2万吨聚合氯化铝项目 (111)(五)广西柳化氯碱有限公司利用电石渣年产5万吨超细碳酸钙项目 (116)(六)广西柳化氯碱有限公司电石法PVC汞污染综合治理示范项目 (120)(七)柳州化工股份有限公司利用一氧化碳废气年产10万吨甲酸钠项目 (125)(八)柳州化工股份有限公司利用合成氨脱硫废气年产10万吨焦亚硫酸钠项目 (128)(九)广西柳州鹿寨金利水泥有限公司利用煤渣、煤灰生产专用水泥项目 (132)(十)柳州正菱鹿寨水泥有限公司利用废石料和工业废渣年产100万立方米蒸压加气混凝土砌块项目 (135)(十一)柳州正菱鹿寨水泥有限公司利用废渣年产80万立方米商品混凝土、50万吨干混砂浆项目 (138)(十二)广西鹿寨凯浩鹿宝新型建材有限公司利用工业固废生产轻质墙材产业示范项目 (142)(十三)广西京龙生化有限责任公司酒精生产节能降耗及废液处理回用项目 (151)(十四)鹿寨县贵盛蚕丝工贸有限公司缫丝废水再生回用项目 (157)(十五)广西鹿寨联发投资有限责任公司工业园二区污水处理厂及中水回用项目 (161)(十六)广西鹿寨联发投资有限责任公司园区能源梯级利用集中供热管网工程. 165(十七)广西鹿寨联发投资有限责任公司开发区中小企业创业孵化及循环经济技术推广项目 (166)(十八)广西鹿寨联发投资有限责任公司园区雨水收集利用管网、污水管网及暗渠工程 (168)三、不申请专项资金支持的重点支撑项目基本情况 (169)(一)广西鹿寨化肥有限公司年节水345万立方米改造示范项目 (169)(二)广西鹿寨化肥有限公司通过三废炉利用合成氨废弃物项目 (176)(三)广西柳化氯碱有限公司3.54MW屋顶光伏电站金太阳示范工程 (181)(四)柳州化工股份有限公司产业转型和技术升级改造项目 (186)(五)广西鹿寨化肥有限公司年产5万立方米脱硝催化剂项目 (195)(六)广西鹿寨化肥有限公司合成氨净化工序节能改造项目 (198)(七)广西柳州中成化工有限公司年产10万吨保险粉(连二亚硫酸钠)节能减排技术升级改造项目 (202)(八)柳州盛强化工有限公司从化工尾气中提取氢气年产10万吨双氧水项目 .. 210(九)柳州市新泉能源技术开发有限公司水泥余热发电项目 (213)(十)柳州正菱鹿寨水泥有限公司利用矿山废料年产150万吨人工砂项目 (218)(十一)广西鹿寨通用人造板有限公司热能中心综合利用木材废料项目 (221)(十二)广西鹿寨联发投资有限责任公司工业园一区跨洛清江大桥项目 (223)(十三)广西鹿寨联发投资有限责任公司工业园一区消防站项目 (224)(十四)广西鹿寨联发投资有限责任公司园区沿江边坡护堤及泵站项目 (225)(十五)广西鹿寨联发投资有限责任公司优化布局提高园区物流能力的道路改扩建工程 (226)(十六)广西鹿寨联发投资有限责任公司园区南部主给水管网项目 (227)(十七)广西鹿寨联发投资有限责任公司独岭至狮子山110KV城官电线迁移工程 (227)(十八)广西鹿寨联发投资有限责任公司园区路灯节能改造和环境美化工程 (228)(十九)广西鹿寨联发投资有限责任公司园区南部主供电线路改造和通讯光缆迁移工程 (229)(二十)广西鹿寨联发投资有限责任公司利用中水和污泥建设防护绿地项目 (230)(二十一)广西鹿寨联发投资有限责任公司园区垃圾处置项目 (231)(二十二)广西鹿寨川页投资有限公司园区工业固废循环利用运输交换项目 (231)第七章园区循环化改造效益分析 (233)一、经济效益分析 (233)(一)直接经济效益 (233)(二)间接经济效益 (234)二、节能效果分析 (241)三、环境效益分析 (241)(一)环境质量得到改善 (241)(二)废弃物得到资源化利用 (241)(三)减少污染物排放量 (241)四、社会效益分析 (242)(一)促进地方产业结构升级 (242)(二)促进社会和谐发展 (242)(三)改善投资环境 (243)(四)促进城镇化进程 (243)(五)促进教育文化发展 (244)第八章保障措施 (245)一、组织保障措施 (245)二、政策保障措施 (245)三、技术支撑措施 (246)四、公共服务平台建设 (246)五、统计评价考核体系 (248)六、污染防治监督管理体制 (249)七、产业链的风险分担和保障体系 (250)八、公众参与 (251)九、宣传教育 (251)十、其他措施 (251)附件一:《国家发展改革委办公厅财政部办公厅关于同意濮阳经济技术开发区等20个园区的循环化改造实施方案的通知》(发改办环资[2013]2197号)附件二:对《关于广西鹿寨经济开发区循环化改造示范试点实施方案的评审意见》的答复前言循环经济是一种以资源的高效利用和循环利用为核心,以“减量化、再利用、资源化、无害化”为原则,以低消耗、低排放、高效率为基本特征的可持续发展的经济增长模式。

1101.北京市辖区1102.北京市县区12.天津市1201.天津市辖区1202.天津市县13.河北省1301.河北省石家庄市1302.河北省唐山市1303.河北省秦皇岛市1304.河北省邯郸市1305.河北省邢台市1306.河北省保定市1307.河北省张家口市1308.河北省承德市1309.河北省沧州市1310.河北省廊坊市1311.河北省衡水市14.山西省1401.山西省太原市1402.山西省大同市1403.山西省阳泉市1404.山西省长治市1405.山西省晋城市1406.山西省朔州市1407.山西省晋中市1408.山西省运城市1409.山西省忻州市1410.山西省临汾市1411.山西省吕梁市1423.山西省吕梁地区15.内蒙古自治区1501.内蒙古自治区呼和浩特市1502.内蒙古自治区包头市1503.内蒙古自治区乌海市1504.内蒙古自治区赤峰市1505.内蒙古自治区通辽市1506.内蒙古自治区鄂尔多斯市1507.内蒙古自治区呼伦贝尔市1508.内蒙古自治区巴彦淖尔市1509.内蒙古自治区乌兰察布市1521.内蒙古自治区呼伦贝尔盟1522.内蒙古自治区兴安盟1525.内蒙古自治区锡林郭勒盟1526.内蒙古自治区乌兰察布盟1528.内蒙古自治区巴彦淖尔盟1529.内蒙古自治区阿拉善盟3101.上海市市辖区3102.上海市县32.江苏省3201.江苏省南京市3202.江苏省无锡市3203.江苏省徐州市3204.江苏省常州市3205.江苏省苏州市3206.江苏省南通市3207.江苏省连云港市3208.江苏省淮安市3209.江苏省盐城市3210.江苏省杨州市3211.江苏省镇江市3212.江苏省泰州市3213.江苏省宿迁市21.辽宁省2101.辽宁省沈阳市2102.辽宁省大连市2103.辽宁省鞍山市2104.辽宁省抚顺市2105.辽宁省本溪市2106.辽宁省丹东市2107.辽宁省锦州市2108.辽宁省营口市2109.辽宁省阜新市2110.辽宁省辽阳市2111.辽宁省盘锦市2112.辽宁省铁岭市2113.辽宁省朝阳市2114.辽宁省葫芦岛市22.吉林省2201.吉林省长春市2202.吉林省吉林市2203.吉林省四平市2204.吉林省辽源市2205.吉林省通化市2206.吉林省白山市2207.吉林省松原市2208.吉林省白城市2224.吉林省延边朝鲜族自治州23.黑龙江省2301.黑龙江省哈尔滨市2302.黑龙江省齐齐哈尔市2303.黑龙江省鸡西市2304.黑龙江省鹤岗市2305.黑龙江省双鸭山市2306.黑龙江省大庆市2307.黑龙江省伊春市2308.黑龙江省佳木斯市2309.黑龙江省七台河市2310.黑龙江省牡丹江市2311.黑龙江省黑河市2312.黑龙江省绥化市2327.黑龙江省大兴安岭地区33.浙江省3301.浙江省杭州市3302.浙江省宁波市3303.浙江省温州市3304.浙江省嘉兴市3305.浙江省湖州市3306.浙江省绍兴市3307.浙江省金华市3308.浙江省衢州市3309.浙江省舟山市3310.浙江省台州市3311.浙江省丽水市34.安徽省3401.安徽省合肥市3402.安徽省芜湖市3403.安徽省蚌埠市3404.安徽省淮南市3405.安徽省马鞍山市3406.安徽省淮北市3407.安徽省铜陵市3408.安徽省安庆市3410.安徽省黄山市3411.安徽省滁州市3412.安徽省阜阳市3413.安徽省宿州市3414.安徽省巢湖市3415.安徽省六安市3416.安徽省毫州市3417.安徽省池州市3418.安徽省宣城市54.西藏自治区5401.西藏自治区拉萨市5421.西藏自治区昌都地区5422.西藏自治区山南地区5423.西藏自治区日喀则地区5424.西藏自治区那曲地区5425.西藏自治区阿里地区5426.西藏自治区林芝地区61.陕西省6101.陕西省西安市6102.陕西省铜川市6103.陕西省宝鸡市6104.陕西省咸阳市6105.陕西省渭南市6106.陕西省延安市6107.陕西省汉中市6108.陕西省榆林市6109.陕西省安康市6110.陕西省商洛市6125.陕西省商洛地区41.河南省4101.河南省郑州市4102.河南省开封市4103.河南省洛阳市4104.河南省平顶山市4105.河南省安阳市4106.河南省鹤壁市4107.河南省新乡市4108.河南省焦作市4109.河南省濮阳市4110.河南省许昌市4111.河南省漯河市4112.河南省三门峡市4113.河南省南阳市4114.河南省商丘市4115.河南省信阳市4116.河南省周口市4117.河南省驻马店市43.湖南省4301.湖南省长沙市4302.湖南省株洲市4303.湖南省湘潭市4304.湖南省衡阳市4305.湖南省邵阳市4306.湖南省岳阳市4307.湖南省常德市4308.湖南省张家界市4309.湖南省益阳市4310.湖南省郴州市4311.湖南省永州市4312.湖南省怀化市4313.湖南省娄底市4331.湖南省湘西土家族苗族自治州42.湖北省4201.湖北省武汉市4202.湖北省黄石市4203.湖北省十堰市4205.湖北省宜昌市4206.湖北省襄樊市4207.湖北省鄂州市4208.湖北省荆门市4209.湖北省孝感市4210.湖北省荆州市4211.湖北省黄冈市4212.湖北省咸宁市4213.湖北省随州市4228.湖北省恩施土家族苗族自治州4290.湖北省省直辖县级行政单位44.广东省4401.广东省广州市440101.广州市市辖区440103.广州市荔湾区440104.广州市越秀区440105.广州市海珠区440106.广州市天河区440111.广州市白云区440112.广州市黄埔区440113.广州市番禺区440114.广州市花都区440115.广州市南沙区440116.广州市萝岗区440183.广州市增城市440184.广州市从化市4402.广东省韶关市440201.韶关市市辖区440202.韶关市北江区440203.韶关市武江区440204.韶关市浈江区440205.韶关市曲江区440221.韶关市曲江县440222.韶关市始兴县440224.韶关市仁化县440229.韶关市翁源县440232.韶关市乳源县440233.韶关市新丰县440281.韶关市乐昌市440282.韶关市南雄市4403.广东省深圳市440301.深圳市市辖区440303.深圳市罗湖区440304.深圳市福田区440305.深圳市南山区440307.深圳市龙岗区440308.深圳市盐田区4404.广东省珠海市440401.珠海市市辖区440402.珠海市香洲区440403.珠海市斗门区440404.珠海市金湾区4405.广东省汕头市440501.汕头市市辖区440507.汕头市龙湖区440511.汕头市金平区440512.汕头市濠江区440513.汕头市潮阳区440514.汕头市潮南区440515.汕头市澄海区440523.汕头市南澳县4406.广东省佛山市440601.佛山市市辖区440604.佛山市禅城区440605.佛山市南海区440606.佛山市顺德区440607.佛山市三水区440608.佛山市高明区4407.广东省江门市440701.江门市市辖区440703.江门市蓬江区440704.江门市江海区440705.江门市新会区440781.江门市台山市440783.江门市开平市440784.江门市鹤山市440785.江门市恩平市4408.广东省湛江市440801.湛江市市辖区440802.湛江市赤坎区440803.湛江市霞山区440804.湛江市坡头区440805.湛江市经济技术开发区440811.湛江市麻章区440823.湛江市遂溪县440825.湛江市徐闻县440881.湛江市廉江市440882.湛江市雷州市440883.湛江市吴川市440888.湛江市东海岛4409.广东省茂名市440902.茂名市茂南区440903.茂名市茂港区440923.茂名市电白县440981.茂名市高州市440982.茂名市化州市440983.茂名市信宜市4412.广东省肇庆市441201.肇庆市市辖区441202.肇庆市端州区441203.肇庆市鼎湖区441223.肇庆市广宁县441224.肇庆市怀集县441225.肇庆市封开县441226.肇庆市德庆县441283.肇庆市高要市441284.肇庆市四会市441285.肇庆市高新区4413.广东省惠州市441301.惠州市市辖区441302.惠州市惠城区441303.惠州市惠阳区441322.惠州市博罗县441323.惠州市惠东县441324.惠州市龙门县4414.广东省梅州市441401.梅州市市辖区441402.梅州市梅江区441421.梅州市梅县441422.梅州市大埔县441423.梅州市丰顺县441424.梅州市五华县441426.梅州市平远县441427.梅州市蕉岭县441481.梅州市兴宁市4415.广东省汕尾市441501.汕尾市市辖区441502.汕尾市城区441521.汕尾市海丰县441523.汕尾市陆河县441581.汕尾市陆丰市4416.广东省河源市441601.河源市市辖区441602.河源市源城区441621.河源市紫金县441622.河源市龙川县441623.河源市连平县441624.河源市和平县441625.河源市东源县4417.广东省阳江市441701.阳江市市辖区441702.阳江市江城区441721.阳江市阳西县441723.阳江市阳东县441781.阳江市阳春市4418.广东省清远市441801.清远市市辖区441802.清远市清城区441821.清远市佛冈县441823.清远市阳山县441825.清远市连山县441826.清远市连南县441827.清远市清新县441881.清远市英德市441882.清远市连州市4419.广东省东莞市4420.广东省中山市4451.广东省潮州市445101.潮州市市辖区445102.潮州市湘桥区445121.潮州市潮安县445122.潮州市饶平县4452.广东省揭阳市445201.揭阳市市辖区445202.揭阳市榕城区445221.揭阳市揭东县445222.揭阳市揭西县445224.揭阳市惠来县445281.揭阳市普宁市445283.揭阳市渔湖试验区4453.广东省云浮市445301.云浮市市辖区445302.云浮市云城区445321.云浮市新兴县445322.云浮市郁南县445323.云浮市云安县445381.云浮市罗定市51.四川省5101.四川省成都市5103.四川省自贡市5104.四川省攀枝花市5105.四川省泸州市5106.四川省德阳市5107.四川省绵阳市5108.四川省广元市5109.四川省遂宁市5110.四川省内江市5111.四川省乐山市5113.四川省南充市5114.四川省眉山市5115.四川省宜宾市5116.四川省广安市5117.四川省达州市5118.四川省雅安市5119.四川省巴中市5120.四川省资阳市5132.四川省阿坝藏族羌族自治州5133.四川省甘孜藏族自治州5134.四川省凉山彝族自治州52.贵州省5201.贵州省贵阳市5202.贵州省六盘水市5203.贵州省遵义市5204.贵州省安顺市5222.贵州省铜仁地区5223.贵州省黔西南布依族苗族自治州5224.贵州省毕节地区5226.贵州省黔东南苗族侗族自治州5227.贵州省黔南布依族苗族自治州53.云南省5301.云南省昆明市5303.云南省曲靖市5304.云南省玉溪市5305.云南省保山市5306.云南省昭通市5307.云南省丽江市5308.云南省思茅市5309.云南省临沧市5323.云南省楚雄彝族自治州5325.云南省红河哈尼族彝族自治州5326.云南省文山壮族苗族自治州5327.云南省思茅地区5328.云南省西双版纳傣族自治州5329.云南省大理白族自治州5331.云南省德宏傣族景颇族自治州5332.云南省丽江地区5333.云南省怒江傈僳族自治州5334.云南省迪庆藏族自治州5335.云南省临沧地区45.广西壮族自治区4501.广西壮族自治区南宁市4502.广西壮族自治区柳州市4503.广西壮族自治区桂林市4504.广西壮族自治区梧州市4505.广西壮族自治区北海市4506.广西壮族自治区防城港市4507.广西壮族自治区钦州市4508.广西壮族自治区贵港市4509.广西壮族自治区玉林市4510.广西壮族自治区百色市4511.广西壮族自治区贺州市4512.广西壮族自治区河池市4513.广西壮族自治区来宾市4514.广西壮族自治区崇左市4521.广西壮族自治区南宁地区4522.广西壮族自治区柳州地区4524.广西壮族自治区贺州地区4526.广西壮族自治区百色地区4527.广西壮族自治区河池地区46.海南省4601.海南省海口市4602.海南省三亚市4690.海南省省直辖县级行政单位50.重庆市5001.重庆市市辖区5002.重庆市县5003.重庆市市35.福建省3501.福建省福州市3502.福建省厦门市3503.福建省莆田市3504.福建省三明市3505.福建省泉州市3506.福建省漳州市3507.福建省南平市3508.福建省龙岩市3509.福建省宁德市36.江西省 3601.江西省南昌市3602.江西省景德镇市3603.江西省萍乡市3604.江西省九江市3605.江西省新余市3606.江西省鹰潭市3607.江西省赣州市3608.江西省吉安市3609.江西省宜春市3610.江西省抚州市3611.江西省上饶市37.山东省3701.山东省济南市3702.山东省青岛市3703.山东省淄博市3704.山东省枣庄市3705.山东省东营市3706.山东省烟台市3707.山东省潍坊市3708.山东省济宁市3709.山东省泰安市3710.山东省威海市3711.山东省日照市3712.山东省莱芜市3713.山东省临沂市3714.山东省德州市3715.山东省聊城市3716.山东省滨州市3717.山东省菏泽市62.甘肃省6201.甘肃省兰州市6202.甘肃省嘉峪关市6203.甘肃省金昌市6204.甘肃省白银市6205.甘肃省天水市6206.甘肃省武威市6207.甘肃省张掖市6208.甘肃省平凉市6209.甘肃省酒泉市6210.甘肃省庆阳市6211.甘肃省定西市6212.甘肃省陇南市6221.甘肃省酒泉地区6222.甘肃省张掖地区6223.甘肃省武威地区6224.甘肃省定西地区6226.甘肃省陇南地区6227.甘肃省平凉地区6228.甘肃省庆阳地区6229.甘肃省临夏州6230.甘肃省甘南藏族自治州63.青海省6301.青海省西宁市6321.青海省海东地区6322.青海省海北藏族自治州6323.青海省黄南藏族自治州6325.青海省海南藏族自治州6326.青海省果洛藏族自治州6327.青海省玉树藏族自治州6328.青海省海西蒙古族藏族自治州64.宁夏回族自治区6401.宁夏回族自治区银川市6402.宁夏回族自治区石嘴山市6403.宁夏回族自治区吴忠市6404.宁夏回族自治区固原市6405.宁夏回族自治区中卫市6422.宁夏回族自治区固原地区65.新疆维吾尔自治区6501.新疆维吾尔自治区乌鲁木齐市6502.新疆维吾尔自治区克拉玛依市6521.新疆维吾尔自治区吐鲁番地区6522.新疆维吾尔自治区哈密地区6523.新疆维吾尔自治区昌吉州6527.新疆维吾尔自治区博尔塔拉蒙古自治州6528.新疆维吾尔自治区巴音郭楞蒙古自治州6529.新疆维吾尔自治区阿克苏地区6530.新疆维吾尔自治区克孜勒苏柯尔克孜自治州6531.新疆维吾尔自治区喀什地区6532.新疆维吾尔自治区和田地区6540.新疆维吾尔自治区伊犁哈萨克自治州6541.新疆维吾尔自治区伊犁地区6542.新疆维吾尔自治区塔城地区6543.新疆维吾尔自治区阿勒泰地区6590.新疆维吾尔自治区直辖单位71.台湾省81.香港特别行政区82.澳门特别行政区。
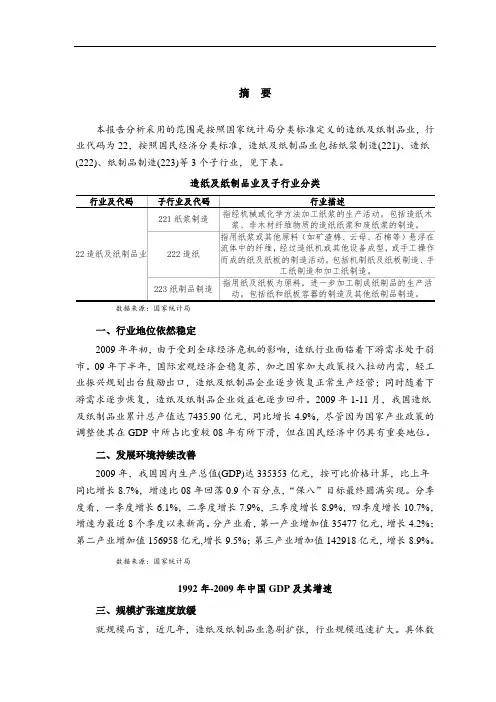
摘要本报告分析采用的范围是按照国家统计局分类标准定义的造纸及纸制品业,行业代码为22,按照国民经济分类标准,造纸及纸制品业包括纸浆制造(221)、造纸(222)、纸制品制造(223)等3个子行业,见下表。
造纸及纸制品业及子行业分类数据来源:国家统计局一、行业地位依然稳定2009年年初,由于受到全球经济危机的影响,造纸行业面临着下游需求处于弱市。
09年下半年,国际宏观经济企稳复苏,加之国家加大政策投入拉动内需,轻工业振兴规划出台鼓励出口,造纸及纸制品企业逐步恢复正常生产经营;同时随着下游需求逐步恢复,造纸及纸制品企业效益也逐步回升。
2009年1-11月,我国造纸及纸制品业累计总产值达7435.90亿元,同比增长4.9%,尽管因为国家产业政策的调整使其在GDP中所占比重较08年有所下滑,但在国民经济中仍具有重要地位。
二、发展环境持续改善2009年,我国国内生产总值(GDP)达335353亿元,按可比价格计算,比上年同比增长8.7%,增速比08年回落0.9个百分点,“保八”目标最终圆满实现。
分季度看,一季度增长6.1%,二季度增长7.9%,三季度增长8.9%,四季度增长10.7%,增速为最近8个季度以来新高。
分产业看,第一产业增加值35477亿元,增长4.2%;第二产业增加值156958亿元,增长9.5%;第三产业增加值142918亿元,增长8.9%。
数据来源:国家统计局1992年-2009年中国GDP及其增速三、规模扩张速度放缓就规模而言,近几年,造纸及纸制品业急剧扩张,行业规模迅速扩大。
具体数据显示,规模以上企业数量及从业人员数量均保持增长,行业生产效率逐步提高;2009年在经济危机的影响下,国内全行业总资产和总负债增速均跌破10%;09年全行业的高利润增长未能持续,尽管国家加大了节能减排和淘汰落后产能政策的实施力度,国内低附加值产品价格被变相抬升,但仍然没能改变造纸及纸制品业利润总额急剧下降的现实。
Shear behaviour of a geogrid-reinforced coarse-grained soil based on large-scale triaxial testsXiaobin Chen a,*,Jiasheng Zhang a,Zhiyong Li ba School of Civil Engineering,Central South University,22Shaoshan Road,Changsha410075,PR Chinab Human Communication Research Institute,472Fu Rong Road,Changsha410008,PR Chinaa r t i c l e i n f oArticle history:Received20June2013Received in revised form7May2014Accepted7May2014Available online2June2014Keywords:Weathered mudstone coarse-grained soil Geogrid reinforcementLarge-scale triaxial testShear behaviourReinforcement coefficientSlip surface a b s t r a c tIn China,weathered mudstone geogrid-reinforced coarse-grained soil is used extensively for road em-bankments.However,the microstructure and disintegration process of weathered mudstone remain unclear.Furthermore,few studies have investigated the shear behaviour of this kind of geogrid-reinforcedfill through large-scale triaxial tests against grain size effects.To bridge this gap,this study reports results from large scale consolidated undrained(CU)and consolidated drained(CD)triaxial tests as well as scanning electron microscopy(SEM),energy-dispersive X-ray(EDX),and disintegration tests on weathered mudstone geogrid-reinforced coarse-grained soil.EDX spectrograms and SEM images show that coarse grains disintegrate rapidly mainly owing to the high clay mineral content and loose microstructure.Therefore,a suitable disintegration time(w15days)is recommended for embankment sits.The shear behaviour of this geogrid-reinforcedfill is investigated in detail through large-scale triaxial tests.The shear deformation tends toward strain hardening behaviour with an increase in the number of geogrid layers and the confining pressure.Geogrids significantly improve the apparent cohesive strength of coarse-grained soil.The pore water pressure is found to develop rapidly in the0% e4%axial strain phase but dissipate slowly in the4%e12%axial strain phase.During shear,the pore pressure coefficient A values of0.2e0.4are indicative of the partial saturation of specimens.Conse-quently,pore water pressure development is mainly attributed to the movement and rearrangement of coarse particles in coarse-grained soil.Experimental data show that the geogrid-reinforcement co-efficients increase with the number of geogrid layers,and a20-cm separation between geogrid layers is recommended for embankment construction sites.The number of geogrid layers influences the geogrid e soil interface’s mobilization and the slip surface type.Test results revealed three types of slip surfaces related to the failure shapes of specimens.Then,based on CU experimental data,the parameters of the Duncan e Chang constitutive model are discussed.Ó2014Elsevier Ltd.All rights reserved.1.IntroductionMudstone,which is widely distributed in the southern part of China,is an extremelyfine-grained sedimentary rock consisting of a mixture of clay and silt-sized particles,generally a mixture of clay minerals with any or all of quartz,feldspar,and mica.Mudstone can be subdivided into siltstone and claystone,in which more than50% of the composition is silt-and clay-sized particles,and both of which have similar mechanical properties.Mudstone is a soft rock, commonly with uniaxial compressive strengths less than15MPa and density less than2.65g/cm3.Therefore,it is generally too soft for construction or similar purposes.However,when naturally weathered,it breaks into blockyflakes and eventually into residual coarse-grained soil,which is often used as afill for constructing embankments in mountainous areas in China.In recent years,geosynthetics,especially geogrids and geo-textiles,have been increasingly used to reinforce embankments.A geogrid-reinforced embankment,by preventing lateral deforma-tion and distributing traffic loading over a larger subgrade area,can often carry higher traffic loading(U.S.Army Corps of Engineers, 2003).Therefore,when weathered mudstone coarse-grained soil are used in highway embankments subjected to traffic loading,they are usually reinforced with geogrids in top layer.In this study,the shear behaviour and influences of geogrid reinforcement on clayey mudstone coarse-grained soil are investigated in detail through large-scale triaxial test results.*Corresponding author.Postal address:22Shaoshan Road,Changsha410075, Hunan province,China.Tel./fax:þ86731-82656812.E-mail addresses:cxb528@,chen_xiaobin@,chenxb@illinois. edu(X.Chen).Contents lists available at ScienceDirectGeotextiles and Geomembranesjou rna l homepage:/locate/geotexmem/10.1016/j.geotexmem.2014.05.0040266-1144/Ó2014Elsevier Ltd.All rights reserved.Geotextiles and Geomembranes42(2014)312e328Many studies have investigated granular soil(or granular mixture)reinforcement mechanisms through laboratory andfield tests.Giroud and Noiray(1981)used geogrids and woven geo-textiles as reinforcements for increasing resistance to traffic load. They,along with many other studies(Berg et al.,2000;Hufenus et al.,2006;Subaida et al.,2009),concluded that geogrids mainly provide reinforcement through lateral restraint,improved bearing capacity,and the tensioned membrane effect.Giroud and Han (2004a,b)presented a design method for geogrid-reinforced un-paved roads in which the influences of the bearing capacity factor (Nc)and interlock among the geogrids were considered.Mekkawy et al.(2011)investigated the shoulder rutting performance of geogrid-reinforced granular shoulders on soft subgrade by per-forming laboratory and full-scale tests.They presented a design chart correlating the rut depth with the number of load cycles to subgrade CBR.This chart was used to optimize granular shoulder design parameters and better predict granular shoulder perfor-mance.Palmeira(2009)analysed the results of large-scale cyclic and monotonic loading tests of unreinforced and geosynthetic-reinforced unpaved roads.They found that the presence of a rein-forcement layer significantly reduced the magnitudes of vertical stress increments transferred to and vertical strain in the subgrade. Their experimental investigations showed that geogrids were more efficient than geotextiles in restraining lateral movement of thefill material.Perkins and Ismeik(1997a,b)also noted the beneficial effects of geosynthetics on reinforced pavements and unpaved roads.Anderson and Killeavy(1989)and Cancelli et al.(1992)noted that the use of geosynthetic reinforcements could reduce pavement thickness by20%e50%.Knapton and Austin(1996)achieved rut depth reductions of up to50%by using geosynthetic re-inforcements,especially geogrids.Raymond and Ismail(2003) noted that the reinforcement layer position influences a road’s performance.Yang et al.(2012)conducted accelerated pavement tests on unpaved road sections with geocell-reinforced sand bases and demonstrated that the NPA geocell significantly improved the stability of unpaved roads with sand bases and reduced permanent deformation.Gourc et al.(1986)proposed a displacement evalua-tion method based on the effect of reinforcement extensibility on the mobilization of interface mechanisms of fabric-retaining walls. Skinner and Rowe(2005)studied the stability of geosynthetic-reinforced retaining walls by analysing a geosynthetic-reinforced soil wall supporting a bridge abutment and approach road con-structed on clayey soil deposit.Ehrlich et al.(2012)presented a physical model study of the influence of compaction on the behaviour of geogrid-reinforced soil walls.Their results showed that the position of maximum tensile force mobilized in the re-inforcements was nearer to the face in the wall with heavy compaction.Weggel and Ward(2012)presented the equations for a numerical model that describes the accumulation offilter cake on a geotextile asflow passes through and solved them numerically using an Eulerfinite difference scheme and an Excel spreadsheet. Sitharam and Hegde(2013)discussed the geotechnical problems at a site,the design of a geocell foundation based on experimental investigation,and the construction sequences of geocell founda-tions in thefield.Yang et al.(2014)focused on soil-rock mixtures as the backfills of geogrid-reinforced soil retaining walls with due concern for their long-term performance and safety.Wang et al. (2014)conducted a numerical compound tensile test(in sand) with one geogrid tensile member by PFC2D to investigate the load transfer behaviour between the geogrid and sand.Moraci and Recalcati(2006)used a large-scale pullout test setup to study the factors influencing the behaviours of geogrid reinforcements embedded in granular soil and evaluated the peak and residual pullout resistance values.Fannin et al.(2005)and Chakraborty and Salgado(2010)studied the dilative behaviour of granular soil.The shear behaviour at the geotextile e granular soil interface influences the stability of a geotextile-reinforced embankment. Many studies conducted direct shear tests on various geotextile interfaces to study their shear stress e shear displacement re-lationships(Gilbert et al.,1996;Triplett and Fox,2001;Zornberg et al.,2005;Bergado et al.,2006;Nye and Fox,2007;Sharma et al.,2007;Suksiripattanaponga et al.,2013).Tran and Meguid (2013)developed a coupledfinite-discrete framework to investi-gate the behaviour of a biaxial geogrid sheet embedded in granular material and subjected to pullout loading.Esmaili et al.(2014) presented the descriptions and results of multi-scale pullout and interface shear tests on a woven polypropylene geotextile rein-forcement material in a marginal quality soil.Khoury et al.(2011) presented the results of a laboratory study on the mechanical behaviour of unsaturated soil e geotextile interfaces using a specially modified direct shear apparatus.Belén et al.(2011)stud-ied the frictional behaviours of geosynthetics used in municipal solid-waste landfills and developed an analytical model to describe the shear behaviour and simulate progressive geomembrane e geotextile interface failure from direct shear tests.Sayeed(2014) used large-size direct shear tests to determine the interfacial shear characteristics of sand e geotextile under three different normal stresses.They investigated the surface morphology of sand particles based on SEM images and quantitatively analysed it using the Wadell roundness and degree of angularity methods.Pitanga et al.(2009)investigated geogrid-reinforced granular soil and found very low dilatancy values between1/300and1/50of the maximum shear displacement in addition to a nonlinear failure envelope in the normal stress ranges.Stark et al.(1996)and Hebeler et al.(2005)studied the geogrid interface interaction mechanisms based on shear tests and found that interbedding and hook control the interface shear strength.Gilbert et al.(1996)and Sharma et al. (2007),among others,developed interface interaction models tofit experimental data.Indraratna et al.(2006,2007),among others, demonstrated the effectiveness of geogrid reinforcements on restricting ballast deformation throughfield tests and simple lab-oratory tests.Coleman(1990)and Shukla and Yin(2006)evaluated the effects of interlocking between railway ballast and geogrid apertures on shearing resistance.Indraratna et al.(2011)described how the ballast e geogrid interface copes with fouling by coalfines. They investigated the stress e displacement behaviours of fresh, fouled,and geogrid-reinforced ballast by performing a series of large-scale shear tests.Dombrow et al.(2009)conducted a series of large-scale shear tests with fresh ballast and ballast fouled by coal to varying degrees.They found that the shear strength decreased steadily as the fouling percentage increased.Tutumluer et al.(2012) studied the shear behaviour of ballast under monotonic and cyclic loading.Chen and McDowell(2012)used the discrete element method to simulate the cyclic loading of geogrid-reinforced ballast under confined and unconfined conditions.Leshchinsky and Ling (2013),based on prior large-scale laboratory tests of ballast em-bankments with geocell confinement and relevant numerical modelling,validated an acceptable material model for a parametric study usingfinite element analysis to investigate the effects of geocell confinement on ballasted embankments when encoun-tering a soft subgrade,weaker ballast,or varying reinforcement stiffnesses.Indraratna et al.(2013)described a novel large-scale process simulation test(PST)apparatus that can capture the lateral strain variation upon loading.They conducted laboratory tests to explore the deformation and degradation response of both unreinforced and reinforced ballast under high-frequency cyclic loading.For coarse-grained soils,Pitman et al.(1994)focused on the ef-fect of the coarse grain content on soil de et al.(1998) investigated the effect of the coarse grain content on theX.Chen et al./Geotextiles and Geomembranes42(2014)312e328313collapsibility of a granular mixture.Vallejo and Mawby (2000)conducted some tests to study the shear strength at different coarse grain contents.Dash and Sitharam (2009)investigated the stress e strain relationships of coarse grained soil,and Bandini and Pham (2011)focused on the critical state characteristics of the same.Zhao and Zhang (2013a,b)conducted drained and undrained triaxial tests on several widely graded soils with different coarse contents at low con fining stress.They found that the soil micro-structure changes from a fine-to a coarse-controlled structure beyond a critical coarse content of w 70%.Zhao and Zhang (2013a,b)investigated the microstructure,compressibility,and shear strength of an unsaturated widely graded coarse-grained soil.Suksiripattanapong et al.(2013)studied the pullout resistance of geogrid reinforcement in coarse-grained soils and presented pullout resistance equations for the bearing reinforcement with different dimensions and spacings between transverse members.Demir et al.(2013)conducted 16field tests to evaluate the effects of replacing natural clay soil with a stiffer granular fill layer and single-multiple layers of geogrid reinforcement placed into the granular fill below circular footings.Moraci and Cardile (2012)analysed the effects of the tensile cyclic load,frequency,and amplitude;vertical con fining stress;and geogrid structure on the pullout behaviour in terms of accumulated displacements and deformations.Shivashankar and Jayaraj (2014)investigated the effects of prestressing the rein-forcement on the strength improvement and settlement reduction of a reinforced granular bed overlying weak soil.Many studies have investigated the effect of the coarse grain content on the stress e strain relationships,shear strength,and critical state properties of coarse grained soil.However,few studies have focused on geogrid-reinforced coarse-grained soils;in particular,few large-scale triaxial experimental investigations have been rge specimens are rarely used to diminish coarse grains ’size effects on the shear behaviour in triaxial tests.Furthermore,the disintegration of coarse grains is always neglec-ted.To better understand the shear behaviour and effects of geogrid-reinforced coarse-grained soil during triaxial testing,a series of large-scale triaxial tests (CU and CD)were conducted in this study.SEM images and EDX spectrograms of mudstone were obtained using a field-emission gun environmental scanning elec-tron microscope (FEG-ESEM).In addition,disintegration tests were conducted to investigate the mudstone grain ’s disintegration when exposed to air and water.In the triaxial experiments,the di-mensions of each specimen are as follows:diameter ¼300mm,height ¼600mm,and thickness of rubber membrane encasing specimen ¼2mm.The relationships between the specimen failure shapes and numbers of geogrid layers were studied,and the pa-rameters of the Duncan and Chang constitutive model were discussed.2.Materials and specimen preparation 2.1.Mudstone grain ’s propertiesMudstone consists of silt-,mud-,and clay-sized particles.The chemical compositions of mudstone grains are summarized in Table 1.The microstructure of the mudstone grain ’s mineral matrix was investigated by SEM,as shown in Fig.1(a e d).These images show that the microstructure of the mudstone grain ’s mineral matrix is relatively loose,and the shape of the clay ’s mineral matrix is mainly blocky and laminated.The loose microstructure suggests that water and air could easily penetrate the mudstone grains,in turn easilyTable 1Chemical compositions of mudstone grains (%,percentage by dry weight).Sample no.Compositions S i O 2Al 2O 3Fe 2O 3CaO MgO Burning loss Others A1(at k6þ060)65.0514.537.80.74 1.647.32 2.92A2(at k14þ130)69.3413.587.270.54 1.13 5.23 2.91A3(at k17þ090)67.2014.057.510.65 1.20 6.86 2.53A4(at k23þ400)69.5013.987.400.55 1.32 4.75 2.50Average67.7714.047.500.621.326.042.71Fig.1.SEM images of weathered mudstone.X.Chen et al./Geotextiles and Geomembranes 42(2014)312e 328314Fig.2.EDX spectrums of weathered mudstone.X.Chen et al./Geotextiles and Geomembranes 42(2014)312e 328315leading to their disintegration.The main minerals in the mudstone grains were analysed based on the EDX spectrograms obtained using an FEG-ESEM,as shown in Fig.2(a e d).The EDX spectrum analysis shows that the minerals in the mudstone grains mainly include clay,quartz (50%e 58%),chlorite (15%e 18%),isinglass (14%e 18%),and feldspar (11%e 12%)by weight.Among these,clay-type minerals d including chlorite,isinglass,and feldspar d constitute 40%e 48%.These fractions can easily be weathered into clayey fine soil.When mudstone grains are exposed to air and water,they disintegrate quickly mainly owing to their high clay mineral con-tent.This disintegration is probably bene ficial for constructing geogrid-reinforced embankments because fills with higher density and degree of compaction can be obtained with the same compaction energy.In this study,the disintegration time and its effects on mudstone grains were investigated through tests.The disintegration test involves the following steps:(1)Weatheredmudstone grains are dried in an electronic oven.(2)Particle size distribution analysis tests are performed using different sieve aperture diameters (63,37.5,19,9.5,2.36,0.6,and 0.3mm),and the initial particle size distribution diagrams are drawn.(3)Dried mudstone grain samples are exposed to air with constant moisture for 2,3,9,15,24,and 35days.(4)After varying exposures intervals,each sample is subjected to particle size distribution analysis again as in step (2),and the disintegrated particle size distribution dia-grams are plotted again.(5)The disintegration is discussed by comparing the particle size distribution diagrams.Fig.3(a)shows a plot of the particle size distributions of mudstone grains during disintegration tests and Fig.3(b)shows the uniformity coef ficients.Fig.3(a)clearly shows that mudstone grain disintegration in-creases with the exposure time.Disintegration is more obvious in the early phase (first 15days),indicating that mudstone grains disintegrate rapidly initially.After 15days,the disintegration speed decreases and most grains (diameter:>60mm)are almost dis-integrated.For instance,when the median grain diameter (d 50)decreases to 50,25,20,6,4,3.1,and 2.0mm,the disintegration times increase to 2,3,9,15,24,and 35days,respectively.Fig.3(b)shows the increase in the uniformity coef ficient of mudstone grain with the disintegration time in the early phase and the decrease in the same with the disintegration time in the later phase (after the first 15days),which also demonstrates that most large grains had already been disintegrated in the early phase.Based on the results,the recommended disintegration time is w 15days for embank-ment construction sites.2.2.Specimen preparationThe properties of commercially available polyvinyl chloride (PVC)geogrids with longitudinal and transverse ribs are summa-rized in Table 2.Field weathered mudstone residual soil is a yellow-cyan coarse-grained soil with irregular oblong-,pyramid-,or chip-shaped grains.This weathered mudstone coarse-grained soil has a me-dian grain size diameter (d 50)of 55mm and a uniformity coef ficient (C u )of 4.0.The maximum void ratio (e max )is 0.85,and the mini-mum void ratio (e min )is 0.46.The field void ratio (e )is 0.72,and the relative density (D r )is 0.31,which indicates the relatively loose condition in field.The basic physical parameters of weathered mudstone coarse-grained soil are listed in Table 3,and its grain size distribution is shown in Fig.4.Not all coarse grains in field can be directly accepted for labo-ratory testing,and the coarse grains ’size effects are obvious (Zekkosa et al.,2008,2012).Several studies have recommended that the largest grain diameter be not greater than 1/6or even 1/10of the specimen diameter for minimizing scale effects (Varadaraja et al.,2003).In this study,the diameter of the largest grain in the sample was not greater than 1/5of the specimen diameter,and the size effects were acceptable (Guo,1999).The specimen dimensions are as follows:diameter ¼300mm,height ¼600mm,and a common height-to-diameter ratio of 2according to ASTM D3999-91.The field grain size distribution was highly imitated using the weight equivalence method (Guo.1999)in this study,and the large-scale triaxial testing samples were prepared by filtering the field mudstone coarse-grained soil with a 60-mm aperturediameterFig. 3.Particle size distribution and uniformity coef ficients during disintegration testing.Table 2Physical dimensions and tensile parameters of polyvinyl chloride geogrids.Aperture length (mm)Aperture width (mm)Longitudinal rib width (mm)Tranverse rib Width (mm)Thickness of rib (mm)Ultimate tensile strength (kN/m)2%Strain tensile strength (kN/m)Longitudinal Tranverse Longitudinal Tranverse 40.038.05.04.03.081.272.568.368.9X.Chen et al./Geotextiles and Geomembranes 42(2014)312e 328316sieve.Thefield and experimental grain size distribution diagrams for weathered mudstone coarse-grained soils are plotted in Fig.4. Although there is a little difference between thefield grain size distribution and the experimental grain size distribution,the de-viation of the testing results and the coarse grain size effects could be acceptable(Guo,1999;Varadaraja et al.,2003).The dry tamping method,moist tamping method,dry pluviation method,and wet pluviation method are commonly used for large-scale reconstituted specimen preparation(Wichtmann et al.,2005). Among these,the moist tamping method allows for specimen preparation with arbitrary relative density and achieves sufficient homogeneity through the application of different compaction ef-forts on each layer,thus compacting each layer to the same density. Considering the characteristics of these methods,the moist tamp-ing method was selected for large-scale triaxial soil specimen preparation in this study.All samples were thoroughly mixed with optimum moisture content(12%).They were then sitting in a curing tank with the same moisture content for at least24h before specimen making.The mudstone coarse-grained soil samples were poured layer-by-layer(five layers)into cylindrical steel moulds. Then,the mudstone coarse-grained soil samples were compacted such that all layers had the same specific density,and the surfaces of each layer were scratched to ensure better bonding with the next layer.The degree of compaction of each layer was95%,and poly-vinyl chloride geogrids were embedded at suitable heights(sepa-ration of30,20,and15cm between layers,respectively).To examine the effects of geogrid reinforcement,specimens with no geogrids as well as one,two,and three layers of geogrids were prepared in this study.The specimen symbols and testing programs used in these large-scale triaxial tests are summarized in Table4.2.3.Experimental procedureCU and CD triaxial tests were conducted using a large-scale triaxial setup based on the BS1377-8standards(1990,Methods of test for soils for civil engineering purposes Shear strength tests). Most of the tests performed are CU tests,with CD tests only being performed for volumetric strain analysis.All specimens were tested under fully saturated conditions.A combination of the back pres-sure saturation method and the CO2flushing saturation method was used for achieving sufficient degrees of saturation.The Skempton pore pressure parameter(B¼D u/Ds3)was used as an indicator of the degree of saturation as the specimen was saturated. It is widely accepted that when B>0.95in testing,the degree of saturation,S,reaches100%(Karg and Haegeman,2009).However,it is very difficult to achieve B!0.95for the laboratory testing of large-scale coarse-grained soil specimens,especially for the clayey soils.In practice,it is presumed that B>0.85indicates a degree of saturation of at least99.5%(Thooft,1991).In the mudstone geogrid-reinforced coarse-grained soil triaxial tests,the B values of all samples were0.90e0.95,indicating that all the samples were sufficiently saturated.When the saturation procedure was completed,the isotropic consolidation procedure was applied with the specimen drainage valves left open;the time required for full consolidation was8e12h during testing.After consolidation,a shear deviator stress(s1e s3)was applied to the specimens,and the resulting shear behaviours were observed.In the shear test,the shearing speeds were controlled by the axial deformation rates of 0.01cm/min(CU)and0.005cm/min(CD).The shear test was terminated when the axial strain reached15%or the stress reached the critical condition(Torav,1985;Zhu,2003).During testing,the shear stress,shear strain,pore water pressure,and specimen failure shapes were investigated.The obtained critical stress states are summarized in Table5.3.Tests results and analysis3.1.Shear behaviourThe failure shapes of specimens are shown in pared with the original shape,three main types of failure shapes are typically observed:shear banding,middle bulging,and top bulging. These failure shapes are likely related to the embedded geogrid layers.For example,shear banding failure is more likely to occur in non-reinforced specimens;middle bulging failure,in specimens reinforced with two geogrid layers;and top bulging failure,in specimens reinforced with three geogrid layers.The middle and top bulging failure specimens show a clear bulge at a height of0.5e 0.7H and0.7e0.8H,respectively.The experimental principal stresses,principal strains,and pore water pressures during shear testing were focused on,and all of them were automatically recorded by the triaxial setup.Under different confining pressures,the critical deviatoric stresses,axial strains,and shear e induced pore water pressures of mudstone geogrid-reinforced coarse-grained soil specimens are plotted in Fig.6.In determining the specimens’shear behaviour,the effects of geogrids are as evident as those of the confining pressure.As shown in Fig.6,the S1group specimens exhibit a strain-softening trendTable3Basic physical parameters of weathered mudstone coarse-grained soil.Density/g/cm3Relative density/Dr Natural water content/%Optimum water content/%Fine particles liquid limit/%Fine particles plastic limit/%1.930.3117123215.9C.B.R.value at different compact degree MLR(Sulphate invading)/%Void ratio Saturation degree90%93%95%n(%)S r(%)39.645.547.0 1.57267.5Note:C.B.R.is the California Bearing Ratio Test.MLR is the Mass Loss Rate when sulphate corrosioninvade.Fig.4.Particle size distribution of weathered mudstone coarse-grained soil.X.Chen et al./Geotextiles and Geomembranes42(2014)312e328317under low con fining pressures;however,the geogrid-reinforced specimens tend to undergo strain hardening,especially the S3group specimens.These experimental results show that the geogrid likely leads to strain hardening under shearing,and the magnitude of this strain hardening is possibly related to the extensile force applied to the geogrid.However,the geogrid ’s extensile force takes obvious effect until its strains accumulate to a suitable level.During shearing,the effect of the geogrid is not obvious when the total axial strain is less than 1%(εa <1%),and the shear curves are very close (as shown in Fig.6).The effect of geogrids becomes more obvious when the axial strain is larger than 1%(εa >1%).Under a con fining pressure of 50kPa,when the shear strain reaches 5%,the shear force (s 1e s 3)reaches 153,195.3,214.4,and 233.1kPa,respectively,for the unreinforced specimen and specimens rein-forced with one,two,and three geogrid layers.The extensile force of the geogrid gradually contributes to the improvement of the reinforced specimens ’shear strength with an increase in the shear strain.Shear deformation leads to strain hardening as the con fining pressure and number of reinforcing geogrid layers increase.Based on experimental data,εa vs.(s 1Às 3)/εa curves of the weathered mudstone coarse-grained soil specimens are plotted in Fig.7.The values of (s 1Às 3)/εa decrease with an increase in the axial strain,and the number of geogrid layers in fluences the curves ’slopes as well as the con fining pressure.The εa vs.(s 1Às 3)/εa curves for the unreinforced samples are linear,as shown in Fig.7(a),which suggests that these specimens ’shear behaviours potentially tend toward shear dilatancy and strain softening.With the presence of geogrid layers,εa vs.(s 1Às 3)/εa curves of the reinforced samples become nonlinear (Fig.7(c e d)).The nonlinear shapes of the curves indicate that the shear behaviour tends toward shear contractancy or strain hardening because of geogrid reinforcement.It is commonly accepted that the volume deformation of a specimen equals the volume of water drained from the specimen in the CD triaxial tests.Therefore,the volume deformation of spec-imen can be determined by measuring the volume of drained wa-ter.During the large-scale consolidated drained triaxial tests,the volume of drained water was measured.Therefore,the specimen ’s volume deformation was obtained indirectly,and the relationshipsTable 4Programs for mudstone coarse-grained soil in large-scale triaxial tests.Test methodSpecimen symbol Embedded geogridsDry density (g/cm 3)Con fining pressure s 3/kPa (CU and CD)method outlined in Standard ASTM D3999-91S1group No geogrid1.8950,100,150,200S2group One layer of geogrid (30cm per layer)50,100,150,200S3group Two layers of geogrid (20cm per layer)50,100,150,200S4groupThree layers of geogrid (15cm per layer)50,100,150,200Table 5Critical stress conditions and residual pore water pressure during axial CU testing.Specimen group Load step s 3(kPa)s 1(kPa)s 1e s 3(kPa)Max pore water pressure u w (kPa)Failure shape description S1150156.2106.238.5Shear band 2100251.5151.539.5Shear band 3150309.4159.459.1Shear band 4200399.2199.263.8Middle bulge S2150186.4136.441.8Middle bulge 2100287.6187.642.3Shear band 3150381.0231.070.2Middle bulge 4200447.2247.273.5Middle bulge S3150231.0181.048.6Middle bulge 2100322.5222.559.2Middle bulge 3150411.5261.578.7Top bulge 4200478.3278.386.9eS4150261.5211.553.5Top bulge 2100360.5260.569.3Top bulge 3150434.1284.192.0Total bulge 4200500.0300.0105.2TopbulgeFig.5.Sketch of specimen failure shapes.X.Chen et al./Geotextiles and Geomembranes 42(2014)312e 328318。
湖北省市场监督管理局关于下达2021年地方标准制修订项目计划(第一批)的通知
文章属性
•【制定机关】湖北省市场监督管理局
•【公布日期】2021.07.12
•【字号】鄂市监标函〔2021〕116号
•【施行日期】2021.07.12
•【效力等级】地方规范性文件
•【时效性】现行有效
•【主题分类】标准定额
正文
湖北省市场监督管理局关于下达2021年地方标准制修订项目
计划(第一批)的通知
各市、州、直管市、神农架林区市场监管局,省局各直属事业单位,各专业标准化技术委员会,各有关单位:
根据《标准化法》和《湖北省地方标准管理办法》,我局按照《2021年湖北省地方标准立项指南》组织了2021年度第一批地方标准项目征集,经政策审查、专家组评审、公示等程序,确定《水稻育秧中心建设技术规范》等137项制定项目和《中药材黄连种苗繁育及质量分级规程》等13项修订项目,以及《地理标志产品南乡萝卜》等3个地理标志产品项目列为2021年湖北省地方标准项目立项计划(第一批)。
咨询方式:省市场监管局标准化处************;邮箱:hbbzhc 。
附件:2021年度湖北省地方标准制修订项目计划表(第一批)
湖北省市场监督管理局
2021年7月12日附件。
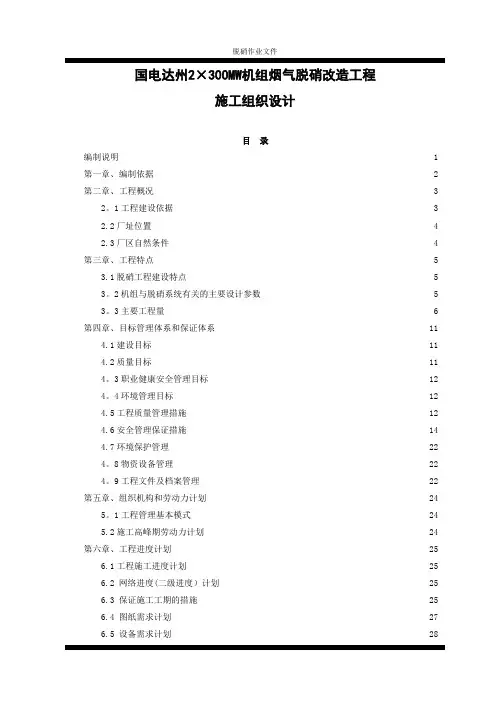
国电达州2×300MW机组烟气脱硝改造工程施工组织设计目录编制说明 1 第一章、编制依据 2 第二章、工程概况 3 2。
1工程建设依据 32.2厂址位置 42.3厂区自然条件 4 第三章、工程特点 53.1脱硝工程建设特点 53。
2机组与脱硝系统有关的主要设计参数 5 3。
3主要工程量 6 第四章、目标管理体系和保证体系114.1建设目标114.2质量目标114。
3职业健康安全管理目标12 4。
4环境管理目标124.5工程质量管理措施124.6安全管理保证措施144.7环境保护管理224。
8物资设备管理22 4。
9工程文件及档案管理22 第五章、组织机构和劳动力计划24 5。
1工程管理基本模式245.2施工高峰期劳动力计划24 第六章、工程进度计划256.1工程施工进度计划256.2 网络进度(二级进度)计划256.3 保证施工工期的措施256.4 图纸需求计划276.5 设备需求计划286.6 主要施工机械的配备29 第七章、施工临设及总平面规划307.1 主要吊车布置307。
2 施工用地307.3 施工用电及通讯317.4 氧气、乙炔、氩气的供应317.5 压缩空气的供应317.6 施工用水317。
7 施工排水布置31 第八章、施工和设备招标计划33 8。
1施工招标划分338.2设备招标划分33 第九章、整体施工方案349.1原则性整体施工方案349.1。
1 工艺部分介绍349。
1。
2 电气工程介绍34 9。
1。
3 热控工程介绍349.1。
4 脱硝装置施工程序349。
1.5 施工原则34 9。
1.6 安装、调试重要工序表35 9。
2 钢架、催化剂安装36 9。
2。
1钢架安装369.2.2催化剂安装369.3 烟道安装369。
3.1 烟道组装原则36 9。
3。
2 施工准备379.3。
3 支吊架的安装379。
3.4 烟道吊装379.3。
5 半成品的技术规范见北京国电龙源标准379。
4 电缆施工37 9。
Experimental investigation and numerical simulation for weakening the thermal fluctuations in aT-junctionK.Gao a ,P.Wang b ,T.Lu a ,⇑,T.Song caCollege of Mechanical and Electrical Engineering,Beijing University of Chemical Technology,Beijing 100029,China bSchool of Energy and Power Engineering,Dalian University of Technology,Dalian 116024,China cChina Nuclear Power Technology Research Institute Co.,Ltd,Shenzhen 518124,Chinaa r t i c l e i n f o Article history:Received 25August 2014Received in revised form 17November 2014Accepted 4January 2015Available online 17January 2015Keywords:Experimental investigation Numerical simulation Tee junctionThermal fluctuationa b s t r a c tIn this work,the mixing processes of hot and cold fluids with and without a distributor are predicted by experiments and numerical simulations using large-eddy simulation (LES)on FLUENT platform.Temperatures at different positions of the internal wall and mixing conditions caused by T-junctions at different times are obtained,then the simulated normalized mean and root-mean square (RMS)temperature,velocity vector and temperature contour for the two structures,namely with and without a distributor,are compared.The results show that,compared with the a T-junction without a distributor,the mixing region of hot and cold water in the T-junction with distributor moves to the middle of the pipe,and the inclusion of the distributor reduces the temperature fluctuations of internal wall noticeably and makes the mixing of hot and cold water more efficient.Ó2015Elsevier Ltd.All rights reserved.1.IntroductionTee junction is a familiar structure that is universally used in pipeline systems of power plants,nuclear power plants and chemi-cal plants,it is often applied to mix hot and cold fluid of main and branch pipes.The fluctuations of fluid temperature are transported to the solid walls by heat convection and conduction.This can cause cyclical thermal stresses and subsequent thermal fatigue cracking of the piping (Lee et al.,2009).So far,leakage accidents took place in several light water and sodium cooled reactors due to thermal fati-gue.In 1998,a crack was discovered at a mixing tee in which cold water from a branch pipe flowed into the main pipe in the residual heat removal (RHR)system in a reactor in Civaux,France.Metallur-gical studies concluded that the crack was caused by a high degree of cycle thermal fatigue (Eric Blondet,2002).In 1990,sodium leak-age happened in the French reactor Superphenix (Ricard and Sperandio,1996).It has been established that mixing hot and cold sodium can induce temperature fluctuations and result in thermal fatigue (IAEA,2002).Therefore,it is significant to study how to weaken thermal fatigue of the piping wall to ensure the integrity and safety of the piping system in a nuclear power plant.In the analysis of thermal fatigue,temperature fluctuation is a very important evaluation parameter.A reliable lifetime assess-ment of these components is difficult because usually only thenominal temperature differences between the hot and cold fluids are known,whereas the instantaneous temperatures and heat fluxes at the surface are unknown (Paffumi et al.,2013).Kamaya and Nakamura (2011)used the transient temperature obtained by simulation to assess the distribution of thermal stress and fati-gue when cold fluid flowed into the main pipe from a branch pipe.Numerical simulation of flow in the tee has been carried out Simoneau et al.(2010)to get temperature and its fluctuation curves,and the numerical results were in good agreement with the experimental data.Through the analysis on thermal fatigue stress,it draw the conclusion that the enhanced heat transfer coef-ficient and the temperature difference between hot and cold fluids were primary factors of thermal fatigue failure of tees.Many numerical simulations and experiments have been carried out to evaluate the flow and heat transfer in a mixing tee junction (Metzner and Wilke,2005;Hu and Kazimi,2006;Hosseini et al.,2008;Durve et al.,2010;Frank et al.,2010;Jayaraju et al.,2010;Galpin and Simoneau,2011;Aulery et al.,2012;Cao et al.,2012).Turbulent models such as Reynolds-averaged Navier–Stokes (RANS),Unsteady Reynolds averaged Navier Stokes (URANS),Scale-Adaptive Simulation (SAS),Reynolds stress model (RSM),detached eddy simulations (DES),and LES have all been used in industrial applications.As one of the choices of turbulent model for predicting the mixing flow in tee junctions,the RSM can bemused to describe the momentum conservation of the mixing (Durve et al.,2010;Frank et al.,2010).Turbulent mixing phenomena in a T-junction have been numerically investigated using the k $x/10.1016/j.anucene.2015.01.0010306-4549/Ó2015Elsevier Ltd.All rights reserved.Corresponding author.based baseline Reynolds stress model(BSL RSM)(Frank et al.,2010) for two different cases.Durve et al.(2010)applied the RSM to pre-dict the velocityfield of three non-isothermal parallel jetsflowing in an experiment setup used to simulate theflow occurring at the core outlet region of a fast breeder reactor(FBR),with a Reynolds number of1.5Â104.Theflow in tube of different Reynolds numbers (Re)andflow velocity ratio were studied experimentally with three-dimensional scanning using particle image velocimetry(3D-SPIV) (Brücker,1997).Large-eddy simulation(LES)is an alternative turbulence model with different subgridscale models often employed to predict velocity and temperaturefluctuations.Indeed many numerical studies have shown the capability of LES to model thermalfluctu-ations in turbulent mixing.LES was performed(Lee et al.,2009)to analyze temperaturefluctuation in the tee junction and the simu-lated results were in good agreement with the experimental data. Thermal striping phenomena in the tee junction had been numer-ically investigated using LES(Hu and Kazimi,2006)for two differ-ent mixing cases,and the simulated normalized mean and root-mean square(RMS)was consistent with experimental results. LES in a mixing tee were carried out(Galpin and Simoneau, 2011)in order to evaluate the sensitivity of numerical results to the subgrid scale model by comparing the experimental results, and to investigate the possibility of reducing thefluid computa-tional domain at the inlet.Another simulation that mixing of a hot and a coldfluid stream in a vertical tee junction with an upstream elbow main pipe was carried out with LES(Lu et al., 2013).And the numerical results show that the normalized RMS temperature and velocity decrease with the increases of the elbow curvature ratio and dimensionless distance.In the meantime,many scholars have studied how to weaken the thermalfluctuation.Experiments and simulation were con-ducted(Wu et al.,2003)on a tee junction geometry with a sleeve tube in it.Theflow is divided into three types of jets by theflow velocity ratio in main and branch pipes.Through the analysis of flowfield and velocityfield of various jets types,it indicate that the addition of sleeve tube relieve the thermal shock caused by the coldfluid injection rge-eddy simulation have been used(Lu et al.,2010)to evaluate the thermal striping phe-nomena in tee junctions with periodic porous media,the temper-ature and velocityfield inside the tubes are obtained.The research revealed that the addition of a porous reduces the tem-perature and velocityfluctuations in the mixing tube.As mentioned above,experiments and numerical simulations for both tee junction geometry with a sleeve tube in it(Wu et al., 2003)and for a mixing tee with periodic porous media in it(Lu et al.,2010)have been carried out.The results of previous researches provide a good reference value for this work that anal-yses the role of distributor in weakening the thermalfluctuation of internal piping wall,and this structure has not been studied to date,to the best of our knowledge.In this work,mixing processes have been studied by the experiment and numerically predicted with LES.Then the simulated normalized mean and root-mean square(RMS)temperature,velocity vector and temperature con-tour of the two tees are compared.2.Experiment systemThe Experimentflowchart is presented in Fig.1.The experimen-tal system consists of four main components,a cold water supply line,a hot water supply line,a test section,and a data acquisition unit.The experiment device is shown in Fig.2.Experimentfluid was adjusted to the desired temperature by the heater and chiller, and then was pumped to the test section.After mixing thefluid is returned to the heater for recycling,some of the excessfluid is dis-charged through the overflow pipe.During the mixing of thefluids, the temperature of the mixingfluid is collected and recorded by the thermocouple probe installed on the tube wall.The experiment requires two different structures of the test sec-tion,Fig.3is the T-junction section without the branch liquid dis-tributor and Fig.4is that with the branch liquid distributor.The addition of this structure has two main functions:(1)changing the mixing position of hot and coldfluids:moving the mixing zone to the middle of the tube,and away from the main pipe wall;(2) increasing the intensity of mixing process:adding the fence near the outlet of distributor enhanced the mixed disturbance and the exacerbatedfluid mixing of the inner tube.For the convenience of observing and adjusting the mixing process,the test section is a round pipe made of plexiglass,and other pipes are made of steel. Fig.5is the physical model of the branch liquid distributor.The test conditions in the present experiment are shown in Table1.We collected the instantaneous temperature data of every measurement points by the data collector.The distribution of sam-pling points are shown in Fig.6,there are total eight thermocou-ples in the circumferential direction at each plane.In the T-junction section without the branch liquid distributor,the number of the collected plane is6(x/d m=1,2,3,4,6,8).That is to say there are48thermocouples in the structure without distributor.And in the T-junction section with the branch liquid distributor,the num-ber of the collected plane is5(x/d m=2,3,4,6,8),which means there are40thermocouples in the structure that with the distrib-utor.In both structures,the distance between measuring point the thermocouple probe and the inner wall is30mm.Since the collect-ing frequency of the collector is limited,we use1Hz as the collect-ing frequency after theflowfield is stable,and the total number of collection is800s.Table1shows the specific parameters of the test conditions.NomenclatureT time(s)Pr Prandtl numberLs mixing length of subgrid grid(m)T temperature(K)G acceleration of gravity(m/s2)K von Karman numberCs Smagorinsky numberS ij subgrid strain rate tensorM R momentum ratio of main pipe and branch pipe TÃnormalized mean temperaturesTÃrms normalized RMS temperaturesR d diameter ratioR v velocity ratiox,y,z axial coordinate(m)Greek symbolsqfluid density(kg/m3)b coefficient of thermal expansionl viscosity(Pa s)ltturbulent viscosity(Pa s)k thermal conductivity(w/(m k))C P heat capacity(J/(kg°C))K.Gao et al./Annals of Nuclear Energy78(2015)180–187181182K.Gao et al./Annals of Nuclear Energy78(2015)180–1871\4\11-thermometers 2\5\10-pressure gauge 3\9-flow meter 6-c ooler 7-heater8-overflow 12-test sec tion 13-thermoc ouple data c ollec torFig.1.Experimentflow chart.Fig.5.Physical model of the branch liquid distributor(a)the whole graph(b)theprofile map.Fig.2.Experiment device of thermalfluctuation.Fig.3.Schematic diagram of the T-junction section without the branch liquid distributor.Fig.4.Schematic diagram of the T-junction section with the branch liquid distributor.3.Numerical simulationFig.7is the numerical model based on the experimental section of T junction.The size of the model,boundary conditions are con-sistent with the experiment.In which,hot water enters from the left of main pipe,and cold water enters from the branch pipe,finally the mixingfluidflow out of the right of the main pipe.Dur-ing the calculation,the steady results offlowfield and heat transfer are obtained by Reynolds stress model(RSM)firstly,and then set @q@tþ@q u i@x i¼0ð1Þ@q u i@tþ@q u i u j@x j¼À@ p@x iÀq0bðTÀT0Þgþ@@x jlþltÀÁ@ u i@x jþ@ u j@x i!ð2Þ@q T@tþ@q Tu j@x j¼@@x jkc p@T@x jÀq T00u00j!ð3ÞIn these equations,q,b,l,l t,k and c p represent the density,ther-mal expansion coefficient,molecular viscosity,turbulent viscosity, thermal conductivity and specific heat capacity,respectively.The Smagorinsky–Lilly model is used for the turbulent viscosity,which is described as:lt¼q L2s j S jð4Þj S jTable1Experimental conditions.Main pipe Branch pipeFlow rate (m3/h)Temperature(K)Flow rate(m3/h)Temperature(K)Without distributor0.645304.650.270287.65With distributor0.645304.650.266287.65Fig.6.The distribution of sampling points on the planes.Physical model of T-junction(a)without the branch liquid distributor;(b)with the branch liquid distributor.K.Gao et al./Annals of Nuclear Energy78(2015)180–187183ij ¼12@ u i@x jþ@ u j@x ið7Þwhere k is the Von Karman constant of0.42;d is the distance to the closest wall;C s is the Smagorinsky constant of0.1;V is the volume of the computational cell.4.Results and discussionThe normalized mean and root-mean square temperature are used to describe the time-averaged temperature and temperature fluctuation intensity.The normalized temperature is defined as:ü1NX Ni¼1TÃið8ÞN is the total number of sample times.TÃi¼T iÀT cT hÀT cð9Þwhere T i is the transient temperature,T c is the coldfluid inlet tem-perature and T h is hotfluid inlet temperature.The root-mean square(RMS)of the normalized temperature is defined as:TÃrms¼ffiffiffiffiffiffiffiffiffiffiffiffiffiffiffiffiffiffiffiffiffiffiffiffiffiffiffiffiffiffiffiffiffiffiffiffiffiffiffiffi1X Ni¼1TÃiÀTÃ2rð10Þ184K.Gao et al./Annals of Nuclear Energy78(2015)180–187parison of experimental and numerical resultsAs can be seen from the Fig.8,the numerical normalized mean temperature distributions at the plane x/d m=1and the plane x/ d m=2are in good qualitative agreement and in adequate quantita-tive agreement,and most of them are within the experimental deviation of±20%.Meanwhile,the lifting trends of the data are the same.In the direction of180°,the mean temperatures are both minimal.And with the angle decrease to0°,the temperatures are gradually increased.Quantitative differences between the experi-ment and numerical results are that the normalized mean temper-atures given by LES are larger than the experimental data.That is because we did not add insulation unit on tube wall in the exper-iment,leading the transfer of some heat into the air.And in the process of numerical simulation,we ignored the convective heat transfer between the wall and the air.As shown in Fig.9,although the numerical results and experi-mental results have a little difference at the plane x/dm=2around the location of225°and the plane x/dm=2around the location of 0°and315°,all of them are within the error range that can be accepted.Both the simulations and experimental results give a lar-ger mean temperature in the top half of the main pipe than in the bottom half.This verifies the validity of the LES model for predict-ing the mixing of hot and coldfluids in a tee junction.The normalized RMS temperature on the plane x/d m=1and plane x/d m=2are shown in Fig.10,respectively.Similar to the nor-malized mean temperature,the normalized RMS temperature lines agree very well with the experiment ones.Both of the maximum values appear at the bottom half of the pipe.This indicates that the maximum temperaturefluctuations of main pipe appear on the opposite of the branch pipe inlet in this condition.As shown in Fig.11,the numerical results and the experimental results have the same trend and the numerical data are agreed well with the experimental ones.By comparison with Figs.4and5,dif-ferent from the temperaturefluctuations distribution which with-out the branch liquid distributor,there are two peaks of high fluctuation located at the90°and270°directions along with the tube.This is because the direction is that of the outlet of branch liquid distributor,the coldfluidflowing out from the outlet of branch liquid distributor mixes very fast with the hotfluid,leading to dramatic changes of temperature.In summary,the LES simulation results obtained are generally in good qualitative and quantitative agreement with the experi-mental data for the case of T-junction with/without the branch liquid distributor.Based on this,we analyzed the numerical results further.And the results are reported in the section below.4.2.Numerical results with/without branch liquid distributorThe numerical data were sampled on the inner wall in the plane x/ d m=À1,À0.5,0,0.5,1,2,3,4,6and8.At the same time,the numer-ical data were sampled from points every5mm along the intersec-tional lines of planes of y/d m=0and sections of x/d m=À2,À1,0,1,2, 3,4,5and6,to get the points with the maximum normalized rootK.Gao et al./Annals of Nuclear Energy78(2015)180–187185mean square temperatures in the tee and on the top and bottom walls.Here,the temperature and velocityfields were determined with LES simulations for the case of tee junction with/without branch liquid distributor.The temperature contours and velocity vectors for the T-junction are shown in Figs.12and13,respectively.As can be seen in Fig.12,due to the large branch pipeflow velocity,hot and coldfluid mixing zone is mainly located in both upstream and downstream region of the intersections of the main pipe and the branch pipe.The vigorous mixing offluids in the tube leads to thermalfluctuation on the wall.But in the T-junction with the branch liquid distributor,the mixing region moves to the lower half and downstream region of the main pipe.This indicates that the distributor is advantageous to weaken thermalfluctuations on the wall.The same conclusion can be seen from Fig.13,the dis-tributor weaken thermalfluctuations on the wall of downstream region and the top of the main pipe.186K.Gao et al./Annals of Nuclear Energy78(2015)180–187Fig.14compares the normalized mean temperatures between two tees of different structures.As can be seen,wall temperature changes great in the direction of90°,135°,225°and270°in T-junc-tion with the distributor,because the directions are the distributor outlet directions.This indicates that the coldfluid mixes with hot fluid on the wall afterflows out of the distributor.At the same time,the temperature in the direction of180°also changes dra-matically.That is because the coldfluid moves down in the effects of gravity and buoyancy.As shown in Fig.15,for the tee with distributor,the maximum values of normalized RMS temperature are smaller than that of the tee without distributor in most directions.This indicates that the adding of the distributor can relieve thermalfluctuations on the wall to some extent.And for the T-junction with distributor,tem-perature tends to be stable after the plane of x/d m=6,which indi-cates that twofluids have made a full mixing,while for the initial tee,temperature is still in the dramatic change,and this shows that the improved structure can effectively reduce the mixing length.Fig.16shows the maximum normalized instantaneous temper-aturefluctuations in the tee and on the top and bottom walls in the plane y/d m=0.In the tee,the maximum normalized instantaneous temperaturefluctuations of the case without distributor vary from 0.45to0.8,which means that the hot and coldfluids alternate in this location.However,for the case with distributor,the tempera-turefluctuations in the tee as well as on the top and bottom walls are much smaller than those of the case without distributor.That also implies that the distributor can reduce the temperaturefluctu-ation effectively.The normalized instantaneous temperaturefluctuations cannot describe the relationship between power spectrum density(PSD) and frequency of the temperaturefluctuation.PSD against fre-quency is one of the most important parameter for thermal fatigue analysis,which can directly show how PSD is in a certain fre-quency.The PSDs of the points with maximum temperaturefluctu-ation for the cases with and without distributor against frequency were recorded by fast Fourier transform(FFT)and shown in Fig.17. The temperaturefluctuation of the case without distributor has the highest PSD,at the frequency of0.04Hz,whereas the distributor significantly reduces the PSD of the temperaturefluctuations with the frequency from0.01to0.1Hz.In addition,the PSD of temper-aturefluctuations decreases with the frequency increasing.5.ConclusionsAs thermal stratification can result in thermal fatigue in the pip-ing system of a nuclear power plant,safety and integrity evaluation of the piping system has become an important issue.In this work the temperaturefluctuation has been studied by the experiment and numerically predicted by LES for two types of vertical tee junc-tion:one with distributor in the branch pipe and another without. The numerical results of normalized mean and RMS temperatures for the two structures have been found to be in good qualitative and quantitative agreement with the experimental data,which val-idates the use of LES simulations to evaluate convective mixing in such geometries.At the same time,the simulated normalized mean and root-mean square(RMS)temperature,velocity vector and temperature contour of the two tees are compared.The numerical results show that thefluctuations of temperatures of the tee without the distrib-utor are larger than those of the tee with the distributor,which can be explained by the branch liquid distributor enhancing the mix-ing.Although both tees give the same momentum ratio between the main pipeflow and the branch pipeflow,mixing and convec-tive heat transfer are greatly enhanced by the presence of the branch liquid distributor.These all show that the structure is effec-tive for weakening the thermalfluctuation of tee piping wall when hot and coldfluids mix,and it can make the mixing more sufficient.AcknowledgementsThis work was supported by projects of the National Natural Science Foundation of China(No.51276009),Program for New Century Excellent Talents in University(No.NCET-13-0651),and the National Basic Research Program of China(No.2011CB706900). ReferencesAulery, F.,Toutant, A.,Monod,R.,Brillant,G.,Bataille, F.,2012.Numerical simulations of sodium mixing in a T-junction.Appl.Therm.Eng.37,38–43.Brücker,C.,1997.Study of the three-dimensionalflow in a T-junction using a dual-scanning method for three-dimensional scanning-particle-image velocimetry (3-D SPIV).Exp.Therm.Fluid Sci.14,35–44.Cao,Q.,Lu,D.,Lv,J.,2012.Numerical investigation on temperaturefluctuation of the parallel triple-jet.Nucl.Eng.Des.249,82–89.Durve,A.,Patwardhan,A.W.,Banarjee,I.,Padmakumar,G.,Vaidyanathan,G.,2010.Thermal striping in triple jetflow.Nucl.Eng.Des.240,3421–3434.Eric Blondet, C.F.,2002.High cycle thermal fatigue in french PWR.In:10th International Conference on Nuclear Engineering.Arlington,Virginia,USA,pp.429–436.Frank,T.,Lifante,C.,Prasser,H.M.,Menter,F.,2010.Simulation of turbulent and thermal mixing in T-junctions using URANS and scale-resolving turbulence models in ANSYS CFX.Nucl.Eng.Des.240,2313–2328.Galpin,J.,Simoneau,J.P.,rge Eddy Simulation of a thermal mixing tee in order to assess the thermal fatigue.Int.J.Heat Fluid Flow32,539–545. Hosseini,S.M.,Yuki,K.,Hashizume,H.,2008.Classification of turbulent jets in a T-junction area with a90-deg bend upstream.Int.J.Heat Mass Transfer51,2444–2454.Hu,L.-W.,Kazimi,M.S.,2006.LES benchmark study of high cycle temperature fluctuations caused by thermal striping in a mixing tee.Int.J.Heat Fluid Flow 27,54–64.IAEA,2002.Validation of Fast Reactor Thermomechanical and Thermohydraulic Codes,Vienna.Jayaraju,S.T.,Komen,E.M.J.,Baglietto,E.,2010.Suitability of wall-functions in Large Eddy Simulation for thermal fatigue in a T-junction.Nucl.Eng.Des.240,2544–2554.Kamaya,M.,Nakamura, A.,2011.Thermal stress analysis for fatigue damage evaluation at a mixing tee.Nucl.Eng.Des.241,2674–2687.Lee,J.I.,Hu,L.-W.,Saha,P.,Kazimi,M.S.,2009.Numerical analysis of thermal striping induced high cycle thermal fatigue in a mixing tee.Nucl.Eng.Des.239, 833–839.Lu,T.,Jiang,P.X.,Guo,Z.J.,Zhang,Y.W.,Li,H.,rge-eddy simulations(LES)of temperaturefluctuations in a mixing tee with/without a porous medium.Int.J.Heat Mass Transfer53,4458–4466.Lu,T.,Liu,S.M.,Attinger,D.,rge-eddy simulations of structure effects of an upstream elbow main pipe on hot and coldfluids mixing in a vertical tee junction.Ann.Nucl.Energy60,420–431.Metzner,K.J.,Wilke,U.,2005.European THERFAT project—thermal fatigue evaluation of piping system‘‘Tee’’-connections.Nucl.Eng.Des.235,473–484. Paffumi, E.,Radu,V.,Nilsson,K.F.,2013.Thermal fatigue striping damage assessment from simple screening criterion to spectrum loading approach.Int.J.Fatigue53,92–104.Ricard,J.B.,Sperandio,M.,1996.Fracture mechanics applied to superphenix reactor components.Int.J.Pressure Vessels Piping65,295–301.Simoneau,J.-P.,Champigny,J.,Gelineau,O.,2010.Applications of large eddy simulations in nuclearfield.Nucl.Eng.Des.240,429–439.Wu,H.L.,Peng,X.F.,Chen,T.K.,2003.Influence of sleeve tube on theflow and heat transfer behavior at a T-junction.Int.J.Heat Mass Transfer46,2637–2644.K.Gao et al./Annals of Nuclear Energy78(2015)180–187187。
Part I ListeningSection IDirections: In this part you will hear ten ATC clearances\instructions or statements, each ATC clearances\instructions or statements will be spoken only once. A question will be asked after each ATC clearances\instructions or statements, there are four answers marked a,b,c,and d, choose the most appropriate answer from the four choices according to what you have heard .1.G-CD, one aircraft on runway vacating. Land at your discretion, surface wind 260, 6 kts. Question: what should the pilot do?nd normally.b.Hold until the aircraft has vacated the runway.c.He can not land due wind.d.Fly to the alternate.Correct answer: a2.Air China 162, hold position, your departure is delayed due to a bird flock upwind of your departurerunway.Question: What is the reason for the pilot to be instructed to hold?a.Traffic on the departure runway.b.Bird strike occurred.c.Birds over the taxiway.d.Bird strike danger.Correct answer: d3.KAL 436, an airbus 340 11 o’clock position, moving left to right, 2 and half a mile ahead, reporttraffic in sight.Question: Where is the other plane?a.11 o’clock, left to right, 2 and half a mileb.11 o’clock, right to left, 2 and half a milec.7 o’clock right to left, 2 and half a miled.7 o’clock left to right, 2 and half a milecorrect answer: a4.Cathy pacific 401, Hong Kong departure, cancel SID turn right heading 230 to intercept CH190radial.Question: Why is the pilot instructed to turn right and intercept CH190 radial?a.SID is cancelledb.STAR is cancelledc.To intercept to a new heading 230d.To intercept to a new heading 320.Correct answer: a5.Fastair 350, turn right heading 190 base leg, no A TC speed restriction.Question:What speed instruction should the pilot to follow?a.350 ktsb.190 ktsc.at the pilot’s own discretiond.follow ATC instructioncorrect answer: c6.KLM 345, braking action medium, heavy rain, time of measurement 0830.Question: What makes the runway surface less favorable?a.rainingb.snowingc.iced.sandcorrect answer: a7.JAL 706, displaced threshold runway 27 500 feet due broken surface.Question: What happens?a.runway unavailable due broken surfaceb.runway partially unavailable due broken surfacec.The broken surface does not affect the runway.d.The landing length will be lengthened.Correct answer; b8.GC 136 TB200, from mike kilo to zulu golf, VFR 2500 feet regional QNH 1011, estimating zoneboundary 52, zulu golf 02, information Kilo.Question: What is the ETA to zone boundary?a.1000b.1011c.1052d.1102correct answer: c9.Southern 445, yaw damper inoperative. Are we likely to run into turbulence on our route? That mightmake us tough to fly.Question: What will the malfunction lead to?a.running into turbulenceb.run to the wrong routec.difficulty to controld.other problemscorrect answer: c10.Panpan, panpan, panpan, Beijing approach, Russian air 151, heading 190, above cloud, unsure ofmy position, request heading to Beijing.Question:What do you learn from this statement?a.The pilot is unsure of the weatherb.The pilot is unsure of the present headingc.The pilot is unsure of the heading to the airportd.The pilot is unsure of the approach procedureCorrect answer: cSection IIDirections:In this part you will hear five RTF exchanges between pilots and air traffic controllers, eachexchange will be spoken only once. A question will be asked after each exchange, there are four answers marked a,b,c,and d, choose the most appropriate answer from the four choices according to what you have heard .1.C: Southwest 459, ground, is it possible to delay your departure time to 54?P: 459, negative. Cannot depart before 05 due de-icing procedures?C: Roger, 459, call me when ready to startup.Question:Why the crew can not depart as the controller instructed?a.departure delayb.deicing procedurec.startup delayd.not ready to start upcorrect answer: b2.C: Southern 344, approved to taxi via taxi way b to holding point runway 36 left.P: Taxiway b, 36 left, roger. Southern 344.P: Ground, southern 344, request return to the apron due to malfunction indication of hydraulic system. Present position, interception of taxiway b and c.C: 344, hold your position.Question: Why does the pilot want to go back to the apron?a.Because there is a malfunction of instruments.b.Because there is some mechanical problem.c.Because taxiway b is blocked.d.Because runway 34 is not available.Correct answer: b3.C: Air China 981, a flock of birds north of runway 31near taxiway a12. hold your position. Iwill call you back.P: Holding position. Air China 981.Question: Why does the controller instruct the pilot to hold?a.Due to danger of bird strike.b.Due runway 31 blocked.c.Due to work in progress on taxiway a12.d.Due to birds flying over runway 12.Correct answer: a4.C: Southern 302, for your information, taxiway C center line lighting unserviceable.P: 302 roger.Question: What do you learn from the exchange between the pilot and the controller?a.There is a danger of lightening.b.The information broadcast is not serviceable.c.The taxiway is not available.d.The runway centerline lights are out.Correct answer: c5.P: Hong Kong delivery, China Southern 309, stand 28, we are bound for Beijing, five minutesbefore start.C: China Southern 309, Hong Kong delivery, I have not got your flight plan. Standby, while I check.P: Delivery, 309, as far as we are concerned, it was filed an hour ago.C: 309, the computer has failed to produce a strip for you, call you back.Question: What is wrong?a.The pilot is asked to standby due to delay of startup.b.The crew has not sent the flight plan.c.Something wrong with the computer.d.Five minutes are not enough for the controller.Answer: cSection IIIDirections: In this section you will hear two passages. each passage will be spoken only once. After each passage five questions will be asked, for each question there are four answers marked a,b,c,and d, choose the most appropriate answer from the four choices according to what you have heard .Passage IClimb performance is important from both economic and flight safety points of view. In a climb the potential energy of the aircraft is increased and fuel energy must be expended to achieve this. The fuel required to climb to a given height can be minimized by the used of the correct climb technique and optimum economy of operation can be attained. Economy, however, is not the only criterion of operation. The safety of the aircraft depends on its ability to climb above obstructions at all points on the flight path. Sufficient excess thrust must be available to ensure that the aircraft can meet certain minimum gradients of climb in any of the safety critical segments of the flights.Following questions are based on the passage you have just heard.1.Why is climb performance important?a.Due to economic factor.b.Due to safety factor.c.Considering both economic and safety factors.d.Due to the need of fuel saving.Answer: c2.According to the passage, what is the use of the correct climb technique?a.To reach to a given height quickly.b.To use least fuel.c.To achieve the ability to climb above obstructions.d.To ensure safety.Answer: b3.Why is sufficient excess thrust necessary?a.Because safety can be ensured.b.Because of the economic purpose.c.To climb as fast as possible.d.To save as much fuel as possible.Answer; a4.According to the passage, what is the other criterion of operation?a.Fuel saving.b.Time saving.c.Ability of clearing obstructions.d.Safety ensuring.Answer: d5.What do you think is the best title for the passage you have just heard?a.The economic factors of climb performanceb.How to climb safelyc.Minimizing the fuel required in climbingd.Factors considered in climb performanceAnswer: dPassage IIMany air carrier aircraft have a flight engineer as a required flight crewmember. The aircraft ‘type certificate’ shows whether or not a flight engineer is needed. On each flight that requires a flight engineer, at least one flight crewmember, besides the flight engineer, must be qualified to provide emergency performance of the flight engineer’s functions for the safe completion of the flight if the flight engineer becomes ill or is otherwise incapacitated. A pilot need not hold a flight engineer’s certificate to perform the flight eng ineer functions in such a situation.The following questions are based on the passage you have just heard.1.What kinds of aircrafts require a flight engineer on board?a.It depends on the type of the aircraft.b.It depends on the certificate of the aircraft type.c.The captain decides it.d.The company decides it.Answer: b2.Who is qualified to perform the flight engineer’s function in emergency?a.All the crewmembers including the flight engineer.b.No one except the flight engineer.c.The first officer of the flightd.At least one member other than the flight engineer.Answer: d3.What if the flight engineer has a heart attack during a flight?a.Anyone of the crewmembers who is qualified.b.One of the crewmembers designated by type certificate.c.One of the crewmembers designated by the captain.d.One of the crewmembers designated by the company.Answer: a4.What does a pilot need to perform the function of the flight engineer?a.He needs a flight engineer’s certificate.b.He doesn’t need a flight engineer’s certificate.c.He must be authorized by the company with a written form.d.He may be authorized by the company orally.Answer: b5.what do you think is the most suitable title for this passage?a.Flight engineer requirementsb.How can a pilot become a flight engineerc.Qualification of a pilot to perform as a flight engineerd.Flight function in emergency situationAnswer: aSection IVDirections: In this section there are some ATC clearances\instructions or pilot’s reports\requests. These above words are spoken only once. In each spoken part some words are missing. Listen carefully and fill the blanks with what you have just heard.1.GRTWS you have a heavy__________ ahead, and he's about twenty knots slower, that's due to thewinds. I've got to need you to slow twenty knots ___________.2.Abbair zero five two heavy, you are one five miles from the outer marker, maintain ___________until established on the localizer, cleared ILS __________3.Ameri five eight zero, ah, I'm going to bring you about fifteen miles ____, and then turn you backonto the approach, is that fine with you and your ______l?4.GCS the Boeing collided with a television antenna on top of Mount while approaching runway 30.The ____________ separated and the aircraft crashed at _____________.5.Air France 140 there is aircraft ten minutes ago loss of engine thrust during takeoff due to________ of birds resulting in loss of control. The _________ are extensive about1.GRTWS you have a heavy jet seven miles ahead, and he's about twenty knots slower, that's due tothe winds. I've got to need you to slow twenty knots in three or four miles.2.Abbair zero five two heavy, you are one five miles from the outer marker, maintain two thousanduntil established on the localizer, cleared ILS 23 left3.American five eight zero, ah, I'm going to bring you about fifteen miles northeast, and then turnyou back onto the approach, is that fine with you and your fuel?4.GCS the Boeing collided with a television antenna on top of Mount while approaching runway 30.The left wing separated and the aircraft crashed at 3400 feet.5.Air France 140 there is aircraft ten minutes ago loss of engine thrust during takeoff due to ingestionof birds resulting in loss of control. The bird activities are extensive about.Section VDirections: In this section there is an exchange between pilots and controllers, the exchange will be spokenDirections: In this part, you are a pilot. Your aircraft callsign is ABCDE. Your flight is from Bluenard to Greenard , alternate is Blackyard. Complete your communication with ATC according to the controllers instructions and the prompt. Your voice will be recorded when you see a microphone on the screen.1. Pre-flight 14(You are at Gate F52, you are bound for Greenard, all flights have been delayed due to weather, you will be ready soon, ask Blueyard Ground what about the delays. )P: Blueyard Ground ABCDE we are bound for Greenard, we’ll be ready soon, what are the delays like?C: A DE Blueyard Ground delays are minimal on your route. There’s likely to be a delay of ten or twenty minutes for you.(You want to change route through COL to save delay.)P: Blueyard Ground A DE Can we change route through COL, it’ll save us a delay.C: Negative ADE you have to be subject to regulation. standby, I’ll call you back.P: Roger, standing by ADE.(You want to check your time, call Ground)P: Blueyard Ground A DE request time check.C: A DE Blueyard Ground time is 1247 and a half.P: 1247 and a half A DE.(Call Ground , you want to start-up.)P: Blueyard Ground ADE Gate F52, information K request start-up for Greenard.C: ADE Blueyard Ground departure time 55, start up at your discretion.P: departure time 55, start up at own discretion ADE.(you want push back)P: Blueyard Ground A DE request push back from F52C: A DE Blueyard Ground hold position . There is a light aircraft passing behind you.P: holding position, ADE.C: ADE Blueyard Ground pushback approved. Caution, there seems to be a bus behind you.P: Pushing back, ABCDE.(You complete pushback and ready to taxi)P: Ground ADE pushback complete, request taxi.C: ADE give way to a 737 crossing you from right to left, you are No. 2 to him.P: No.2, behind 737 ADE.(you are not so familiar with the airport, request detailled taxi instruction.)P: Ground ABCDE request taxi instruction.C: ADE taxi via taxiways E, D to holding point r/w 26L.P: taxiways E, D to holding point r/w 26L ADE.B. Departure 8(call tower you are ready for departure)P: Blueyard Tower ABCDE ready for departureC: ABCDE cleared for take off wind 310/8P: cleared for take off ABCDEC: A DE contact departure 120.5P: 120.5 A DE(contact departure)P: Blueyard Departure ABCDEC: A DE cancel SID turn left to intercept DR 300 radial climb to 9000ft report reaching P: Cancel SID left turn to intercept DR 300 radial climb to 9000ft wlico A DEC: ADE expedite climb due trafficP: Expediting climb ADE(you are reaching 9000ft)P: Blueyard Departure A DE reaching 9000ftC: A DE maintain 9000ft until further advisedP: Maintaining 9000ft ADEC. En route 5(contact Blueyard control)P: Blueyard control ABCDE good morningC: ABCDE Blueyard Control go ahead(report you are over DOK at 30 FL 230 Estimating TUF 45)P: Blueyard Control ABCDE over DOK at 30 FL 230 Estimating TUF 45C: ADE maintain FL230 until boundary.P: Maintaining FL230 ADE(you want higher level)P: A DE Blueyard Control request higher levelC: ADE negative for now contact Greenard Control on 132.1 for higher level.P: 132.1 for higher level ADED. Descend and approachC: ABCDE Greenard Control request flight condition.(you are very bumpy at this level, you want to have FL320)P: Greenard Control ABCDE Conditions are very bumpy at this level. Can we have FL120? C: ADE negative, there’s a traffic right with you at FL320. Can you accept FL300?(You can.)P: Affirm, ADE.(you are descending, received information L, contact Greenard Approach )P: Greenard Approach, ABCDE, descending, information L received.C: A DE Greenard Approach, descend to 8000ft, Squawk 3421, make your heading 085. P: descending to 8000ft, Squawking 3421, heading 085 ABCDE.(Contact Greenard Tower you are on approach for ILS r/w35R.)P: Tower ABCDE ILS approach r/w35RC: A DE continue approach report outer markerP: wilco (report outer marker) A DE(you are over outer marker)P: Tower ABCDE outer markerC: ADE cleared to land r/w35RP: cleared to land ADEE. Landing and after landing(you have just landed on r/w35R)C: ADE backtrack the r/w and vacate via t/w E2 and contact ground on 121.7P: Backtrack t/wE2 121.7 ADE(contact ground)P: Greenard Ground ABCDE good morningC: A DE good morning taxi to stand A19 via t/w F and M.P: taxiway F and M to standA19 ADEC: ADE you can not turn into taxiway G, taxiway G is closed backtrack next rightP: backtrack next right ADEC: ADE after turn right taxi straight ahead for stand A19Directions:. In this part, you are a pilot. Your aircraft callsign is ABCDE. Complete your communication with ATC according to the controllers instructions and the prompt. Your voice will be recorded when you see a microphone on the screen.Item 1(You are 50 miles East of Blueyard, at FL 250, and have a depressurization. Send a distress message to Blueyard Control)PIL: MAYDAY, MAYDAY, MAYDAY, Blueyard Control, ABCDE .Squaking A 7700. Position 50 miles East of Blueyard. Leaving flight level 300 due decompression.CTL: Roger, ADE, descend to flight level 100. Report reaching.PIL: (Read back) Roger ADE, Flight level 100.PIL: (Report reaching): ADE, reaching flight level 100CTL: Roger, ADE.Item 2(You are 40 miles West of Blueyard, Heading 230 at FL270. You have a bomb scare, a man on board claims that he has bomb ,call Blueyard Control in urgency and you decide to return for landing)PIL: PAN PAN, PAN PAN, PAN PAN, Blueyard Control ABCDEWe are coming back to Blueyard. A man clamed to have bomb on board.Position 40 miles west of Blueyard, heading 230, flight level 270Request priority landing and emergency service.CTL: Roger, ADE, continue present heading, descend to flight level 150. Report reaching.PIL: (Read back). Descend to flight level 150, heading230, ADE.PIL: (Report reaching) ADE, reaching FL150CTL: Roger, ADE. I’ll call you backItem 3( Your no.2 engine is in failure, call Blueyard Radar in urgency)PIL: PAN, PAN, PAN, Blueyard Radar. We are in trouble. We have an failure on no.2 engineCTL: Roger, ADE, report your position.PIL (50 miles East of Blueyard, heading 200, FL 180). We are 50 miles East of Blueyard, heading 200, at flight level 180. ADECTL: Roger, ADE, are you able to maintain present altitude?PIL: (Unable, request lower) Requesting lower level, ADECTL: Roger, ADE. Turn right heading heading 230,descend to flight level 100. Advise passing 120PIL: (Read back) Right heading 230.Leaving 180 for 100. I’ll advise you passing 120.ADEPart III Oral responsesNarrationDirections: In this part, you are going to listen to two accident narratives, after each narrative three questions will be asked, make your answer be recorded when you see a microphone on the screen.Accident narrativeOn 5 JAN 1969, Arina Afgan Flight 701, a Boeing 727, was flying from Frankfurt International Airport to London-Gatwick Airport. During approach, the crew were carrying out a runway 27 approach with the autopilot coupled to the ILS, because of bad weather (freezing fog and an RVR of 100m).The 'stabilizer out of trim' warning light illuminated shortly after glide slope capture. The captain responded by disconnecting the autopilot. After passing the Outer Marker flaps were changed from 15deg to 30deg and the rate of descent increased. The aircraft descended below the glide slope until the pilot realised that the aircraft was too low (200 feet agl). A missed approach was executed, but the descent was not stopped in time to avoid a collision with trees and a house.Question 1: Please retell the accident in your own words?Question 2: what causes of the accident can you conclude from the narrative?Question 3: If you were the flying pilot, what can you do to avoid the accident?。
附件:湖南省新增19个国家重点生态功能区产业准入负面清单(试行)2018年11月— 1 —目录1、茶陵县产业准入负面清单 (3)2、南岳区产业准入负面清单 (11)3、绥宁县产业准入负面清单 (19)4、新宁县产业准入负面清单 (27)5、城步县产业准入负面清单 (32)6、安化县产业准入负面清单 (39)7、资兴市产业准入负面清单 (44)8、东安县产业准入负面清单 (50)9、江永县产业准入负面清单 (56)10、江华县产业准入负面清单 (62)11、洪江市产业准入负面清单 (69)12、沅陵县产业准入负面清单 (74)13、会同县产业准入负面清单 (82)14、新晃县产业准入负面清单 (89)15、芷江县产业准入负面清单 (94)16、靖州县产业准入负面清单 (101)17、通道县产业准入负面清单 (107)18、新化县产业准入负面清单 (113)19、吉首市产业准入负面清单 (119)— 2 —1、茶陵县产业准入负面清单茶陵县属于水源涵养型重点生态功能区。
本负面清单涉及国民经济7门类22大类45中类56小类。
其中禁止类涉及国民经济2门类7大类9中类10小类;限制类涉及国民经济7门类19大类34中类46小类。
清单编制的总体原则和要求如下:1、清单所列产业不涉及由国家规划布局的产业(如核电、航空运输、跨流域调水等)。
2、清单所列产业以《产业结构调整指导目录(2011年本)》(修正)(以下简称《指导目录》)、《市场准入负面清单草案(试点版)》《中共中央国务院关于加快推进生态文明建设的意见》(中发〔2015〕12号)、《生态文明体制改革总体方案》和地方性相关规划、意见、方案中已经明确的限制类和禁止类产业作为底线,从严提出需要限制、禁止的产业类型。
列入清单限制类产业有:《指导目录》中的限制类以及与所处重点生态功能区发展方向和开发管制原则不相符合的允许类、鼓励类产业。
列入清单禁止类产业有:《指导目录》中的淘汰类,以及不具备区域资源禀赋条件、不符合所处重点生态功能区开发管制原则的限制类、允许类、鼓励类产业。
巴中市人民政府办公室关于认真做好止滑促升保持工业稳定
增长的紧急通知
【法规类别】机关工作综合规定
【发文字号】巴府办发[2014]5号
【发布部门】巴中市政府
【发布日期】2014.03.23
【实施日期】2014.03.23
【时效性】现行有效
【效力级别】XP10
巴中市人民政府办公室关于认真做好止滑促升保持工业稳定增长的紧急通知
(巴府办发〔2014〕5号)
各县(区)人民政府,市级相关部门,巴中经济开发区管委会:
今年以来,我市工业大幅回落,形势异常严峻,严重影响全年经济预期目标的实现。
按照3月18日全省工业经济稳增长座谈会省政府工作部署,为迅速扭转下滑趋势,确保全年目标任务圆满完成,现就认真做好止滑促升、保持工业经济稳定增长紧急通知如下。
一、加快工业项目建设
(一)狠抓项目竣工投产。
在保证安全、质量的前提下,督促企业抢时间、赶进度,力争早竣工、早投产,形成新的产能,全年投产项目不低于50个以上。
其中,4月底前
中兴纺织、鑫锐齿轮,6月底前海螺水泥、渝翔机械二期,9月底前达芙妮二期、兆润摩托二期、摩根LED塑材加工,年底前同凯能源、建丰林业、普瑞制药投产。
〔责任单位:各县(区)人民政府、巴中经济开发区管委会,市经信委、市发展改革委、市投促委〕
(二)促进项目新开工。
加快项目前期工作,积极创造开工条件,成熟一个、开工一个。
特别要抓紧促成渝青机械、中盟紫薯、重庆科恩新材料、碧海蓝天新型环保设备、重庆三圣特种建材尽快落地开工,全年新开工项目达到50个以上。
〔责任单位:各县(区)人民政府、巴中经济开发区管委会,市经信委、市发展改革委、市投促委〕(三)强化工业投资。
全面梳理今年计划投产、新开工、招商引资项目,列清单,排进度,落实责任人,逐个项目制定具体的推进措施,确保按期达到投资进度,全年完成工业投资140亿元。
〔责任单位:各县(区)人民政府、巴中经济开发区管委会,市经信委、市发展改革委、市投促委〕
二、一企一策盘活存量
(四)搞好企业分类指导。
南矿集团、铁山冶金、德源食品、胡婆婆食品等生产下滑严重企业要抓紧摸排影响产销的原因,点对点落实解困措施,尽快实现企业稳定增长。
全丰酒业、山霸王、科伦医贸、安庆矿业等生产放缓企业要挖掘生产潜力,拓展销售市场。
兆润摩托、渝翔机械、华盛玻璃等运行良好的企业要提升产能负荷,扩产多销,多做贡献。
〔责任单位:各县(区)人民政府、巴中经济开发区管委会,市经信委〕(五)推进企业退城入园。
认真执行《巴中市人民政府办公室关于巴城工业企业退城入园工作的意见》,强化企业退城入园推进工作执行机制。
巴州区要加大企业“退城”遗留问题处置力度,巴中经济开发区要做好企业“入园”建设和投产促进工作。
有关方面要按照市委、市政府发展“飞地工业”的意见,落实企业。