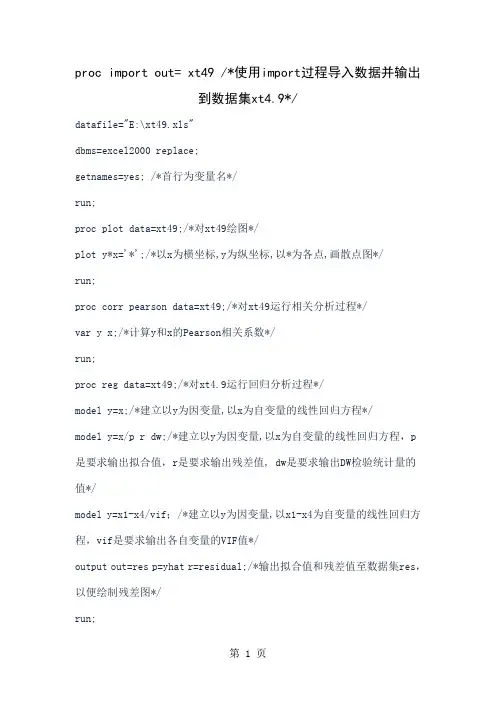
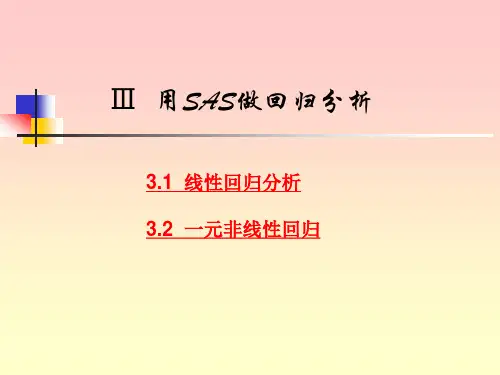
sas线性回归分析案例(Case study of SAS linear regressionanalysis)linear regression20094788 Chen Lei calculates 2Southwest Jiao Tong UniversitySouthWest JiaoTong University-------------------------------------------------------------------Linear regression is divided into single linear regression and multiple linear regression.The model of unary linear regression isY=..0+..1X+ epsilon,HereXIndependent variable,YDependent variable,Epsilon is a random error term.It is usually assumed that the mean of the random error isZeroThe variance is(..2..2>0),..2 andXValue independent. If further assumptionsRandom errorThe difference follows a normal distribution, which is called a normal linear model. In general, withKAn independent variable and a dependent variable, dependent variableThe value can be broken down into two parts: part is due to theinfluence of the independent variable, that is to sayFunction as an argumentAmong them, the function form is alreadyKnow, but contain some unknown parameters; another part is due to other UN considered factors and random effects, that is, random errors.When a function is a linear function of unknown parameters, it is called a linear regression analysis model.If there are multiple dependent variables, the regression model is:Y=..0+..1X1+..2X2+.+..IXi+..Due to the linear dieThe model contains random errors, so the regressionThe straight line reflected by the model is uncertain. The main purpose of regression analysis is to derive from theseIn the uncertain straight line, find a line which can best fit the original data information and describe it as a regression modelRelationship between independent variables,The straight line is called the regression equation.throughOften in regression analysis, yesEpsilon has the most commonly used classical assumptions.1. The expected value of epsilon isZero2, epsilon for allXFor example, it has the same variance.3, epsilon obeys normal distribution and is independent of each otherVariable.Explanation of linear regression,This paperBased on examples.In the following example, there is a one element regression analysis, and another twoMeta regression analysis.Examples(Data analysis method_exercises2.4_page79)A company manager who knows about the monthly sales of a cosmetics in a cityY(unit: box) with the middle of the cityThe number of people who use the cosmetics..1 (unit: thousand persons) and their per capita monthly income..2 (unit: yuan) betweenIn a certain monthFifteenThree cities were surveyed to obtain the above views Measured values, such as tableTwo point one twoAs shown.surfaceTwo point one twoCosmetics sales dataCitySales volume (y)Number of people (x1)Income (x2)CitySales volume (y)Number of people (x1)Income (x2)OneOne hundred and sixty-twoTwo hundred and seventy-fourTwo thousand four hundred and fiftyNineOne hundred and sixteenOne hundred and ninety-fiveTwo thousand one hundred and thirty-seven TwoOne hundred and twentyOne hundred and eightyThree thousand two hundred and fifty-four TenFifty-fiveFifty-threeTwo thousand five hundred and sixtyThreeTwo hundred and twenty-threeThree hundred and seventy-fiveThree thousand eight hundred and two ElevenTwo hundred and fifty-twoFour hundred and thirtyFour thousand and twentyFourOne hundred and thirty-oneTwo hundred and fiveTwo thousand eight hundred and thirty-eight TwelveTwo hundred and thirty-twoThree hundred and seventy-twoFour thousand four hundred and twenty-seven FiveSixty-sevenEighty-sixTwo thousand three hundred and forty-seven ThirteenOne hundred and forty-fourTwo hundred and thirty-sixTwo thousand six hundred and sixtySixOne hundred and sixty-nineTwo hundred and sixty-fiveThree thousand seven hundred and eighty-twoFourteenOne hundred and threeOne hundred and fifty-sevenTwo thousand and eighty-eight SevenEighty-oneNinety-eightThree thousand and eightFifteenTwo hundred and twelveThree hundred and seventyTwo thousand six hundred and five EightOne hundred and ninety-twoThree hundred and thirtyTwo thousand four hundred and fiftyhypothesisYand..1,Linear regression relation is found between..2 ....=..0+..1....1+..2....2+..,..=1,2,... 15.amongIndependent and identically distributed... (0,..2)(One)Coefficient of linear regression..0,..1,Least squares estimation and error variance of..2..2 estimates, writes regression equations, and...Regression coefficientInterpret;(Two)The ANOVA table was used to explain the significance of linear regression test. Square of the coefficient of the complex correlation..2valueAnd explain its meaning;(ThreeSeparately seek..1 andThe confidence of..2 is95%Confidence interval;(Four)YesThe number of people tested by alpha =0.05 ..1 and income..2Sales volumeYIs the effect significant?Regression coefficientTest of general hypothesis test method ..1 andThe interaction of..2 (i.e...1..2) yesYIs the effect significant?;Data importEdit window inputThis questionTheData import code:TitleData analysis method_exercises2.4_page79"; / *Title, omission does not affect analysis results * /DataMylib.ch2_2_4;*First, a new logical library,Logical LibrariesMylibCreate data setCh2_2_4*/Input y X1 x2 @ @ /*@@; Represents a continuous input,YDependent variable,X1,X2Independent variable* /Cards; / *Start input data* /1622742450120180, 32542233753802131205283867862347, 1692653782819830081923302450, 1161952137Fifty-five532560252430402023, 37244271442362660103157, 20882123702605;*Missing data"."Otherwise, the corresponding set of data will be automatically deleted* /Run/*runStatement is used to illustrate all rows before the statement in the current procedure step* /PressF8After run,Open logical libraryMylibYou can see the new data setCh2_2_4.SASA variety of imports are provided According to the manner, for example: One,Read data from file,INFILEF:\Mylib\CH2_2_4.txt";TwoAnd the use of established data sets,Proc reg data=mylib.ch2_2_4;You can also import directly from outsideExcelOther ways. The program above is entered directly in the editbox.procedure callThe procedure to call in this questionyesProc regProcess.Proc regProcess isSASsystemMany regression analysis process of the system in the Except that it can fit the general linear regression model,A variety of optimal model selection methods and model checking methods are also provided.Among themOneTwo)ThreeThe results of multivariate linear regression analysis are mainly used. (Four) will use a linear regression analysisResults.(I)Yand..,Linear regression analysisProcReg*transferRegProcess use* /MOdel y=x1 x2;*Dependent variableYThe independent variable is X1,X2*/Run;ModelStatement: used to define the model's dependent variables, arguments, model options, and output options.Common options areSelection=,Specifies the variable selection method:FORWARD(forward input method),BACKWARDXiang HoushanDivision),STEPWISE(stepwise regression),ADJRSQ(modified multiple correlation coefficient criterion),CP(Cp criterionEtc..NOINTSaid, is often included in the modelNumber item;STBThe regression coefficient, output standard;CLIThe output of single predictive value, confidence interval; RResidual scores are performedAnalysis of results of the analysis and output; IOutput(XTX).1matrix.Format:MODELDependent variable name=Argument rankingTheseoption]Cases:Model y=x1 / x2 selection=stepwise / *; stepwise regression* /After running the program, get the results Parameter estimation table(One)Least squares estimation:= = (0,... 1,... 2) = (3.45261,0.49600,0.00920) Regression equation:Y=3.45261+0.49600..1+0.00920..2ANOVA table(TwoError variance estimate:... 2=MSE=4.74040Multiple correlation coefficientSquares:..2=0.9989(R-Square)Significance: from the value of the complex correlation coefficient, it can be seen that it is highly significantand..1,..2)Multiple correlation coefficient SquaresCan also passBy calculation:..2=SSR/SST=53845/53902=0.9989 (Three)Confidence interval:K+....t1..2 (N.P) s...)...0.975 (12) =2.17881 (via check) T distribution table obtained) You can also pass the functionY=TINV(P,DFObtain...1=0.496+/-2.179*0.00605Draw (Zero point four eight two eight ,Zero point five zero nine two )..2=0.0092+/-2.179*0.00096811,DrawZero point zero zero seven one ,Zero point zero one one three )(Two)YandLinear regression analysisProcRegData=mylib.ch2_2_4; / *Direct reference data set* /Model y=x1;Run;(FourThe coefficient of multiple correlation is: Zero point nine nine one zeroX1YesYSignificant influence(Three)YandLinear regression analysis ProcRegData=mylib.ch2_2_4; / * Direct reference data set * /Model y=x2;Run;(Four)The coefficient of quadratic correlation is square: Zero point four zero eight seven,X2YesYThe effect is not significant(Four)YandLinear regression analysis of... Data mylib.ch2_2_4;Set mylib.ch2_2_4;*Read data set* /Z=x1*x2;*New argumentZ*/Run;Proc reg;Model y=z;*Argument isZ*/Run;(Four)The square of the complex correlation coefficient is: Zero point nine zero three zero,X1X2YesYSignificant impactLinear regression analysis using modules (I)Linear regression analysisstart-upSASSystem, and click "solution" in turn"->"Analysis"->"Analysts"And then click "file""->Open, open the data set"Ch2_2_4.sas7bdat",FigureVariable listindependent variable dependent variableThe value of confidence a Click "Statistics" in turn" ->"Regression"->"Simple" pop-up dialog boxOne)Variable settingsOn the left hand side of the variables listCentral ElectionYClick"DependentThe button is set as dependent variable ;SelectedX2Click"Explanatory"Button, set it as an argument."ModelIn the settings bar, select by default" Linear"" means linear regression.(Two)TestsSet upClick"TestsButton to eject the dialog boxConfidence defaults toZero Point Zero FiveMay change.Click"OK".(Three)PlotsSet upClick"Plots"Button" pops up the plotting Options dialog boxChoice"ResidulTab."Studentized"Represents a student residual," Normal quantile-Quantile plot"Stands for normality."QQGraph check.Settings as shownResidual columnNormal inspectionTest barVariable columnvariance analysisparameter estimationClick"OK"And click on the main settings dialog box "OK",ThereforeAnd get resultsregression equationClick"Analysis (new, project) "Dialog box""Plot of RSTUDENTVsX2"" pops up the residual graph Dialog boxClick again"Plot of RSTUDENTVsNQQ"Pop upQQchartThe normal state of the residual by the studentQQIt can be seen that the model error term is approximately normal distribution.Independent variable selection(two) manyLinear regression analysisstart-upSASSystem, click "solution" in turnResolution"->"Analysis">"Analyst", and then click "file"" ->Open, open the data set"Ch2_2_4.sas7bdat".Click "Statistics" in turn"->"Regression"->"Linear" pop-up dialog boxSelect argumentX1,X2Dependent variableY. Click"ModelButton to eject the dialog boxIn"Selection method"Column" provides independent variable selection, such as: Stepwise selectionExpressStep regression method;Adjusted R-SquareIndicates the modified multiple correlation coefficient criterion. This example selectsStepwise regression method. Click"OK".PlotsThe setting is similar to the one element regression analysis. Last click"OK".Multivariate linear analysis:Residual plotQQIn addition, click"Analysis (New project)"Dialog box"Code"Pop-up program dialog box.The above process is mainly explained by linear regressionSASThe use of the system, and therefore less analysis of the results. For example: byQQAs can be seen from the graphspotApproach a straight line, IndicateError termApproximatejuststateDistribution.。