国外矿产资源储量分类((李裕伟))
- 格式:ppt
- 大小:2.45 MB
- 文档页数:136

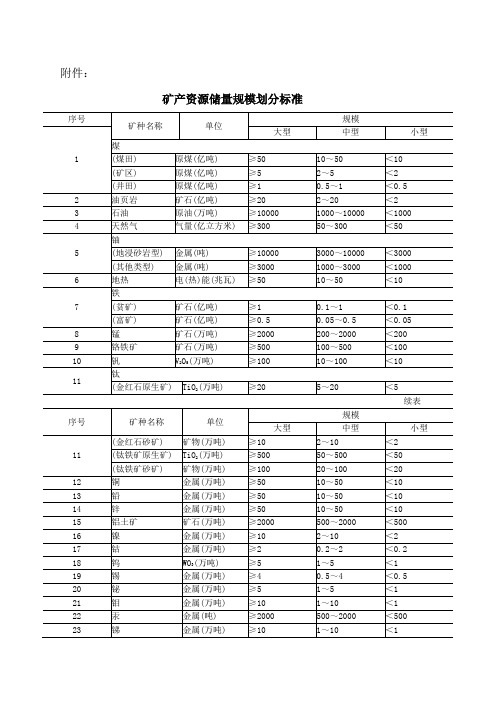
矿产资源储量规模划分标准(2000年4月24日国土资源部国土资发[2000]133号)序号矿种名称 单位规模1大型中型小型煤(煤田) 原煤(亿吨) ≥50 10~50 <10 (矿区) 原煤(亿吨) ≥5 2~5 <2 (井田)原煤(亿吨) ≥1 0.5~1 <0.5 2 油页岩 矿石(亿吨) ≥20 2~20<23 石油 原油(万吨)≥100001000~10000 <1000 4天然气 气量(亿立方米) ≥30050~300<505铀(地浸砂岩型) 金属(吨) ≥10000 3000~10000 <3000 (其他类型) 金属(吨)≥30001000~3000 <1000 6地热 电(热)能(兆瓦) ≥5010~50<107铁(贫矿) 矿石(亿吨) ≥1 0.1~1 <0.1 (富矿)矿石(亿吨) ≥0.5 0.05~0.5 <0.05 8 锰 矿石(万吨) ≥2000 200~2000 <200 9 铬铁矿 矿石(万吨) ≥500 100~500 <100 10 钒 V 2O 5(万吨)≥10010~100<1011钛(金红石原生矿) TiO2(万吨)≥205~20<5续表序号 矿种名称单位规模大型 中型 小型11(金红石砂矿) 矿物(万吨)≥102~10<2(钛铁矿原生矿) TiO2(万吨) ≥50050~500 <50 (钛铁矿砂矿) 矿物(万吨) ≥10020~100 <2012 铜金属(万吨) ≥5010~50 <1013 铅金属(万吨) ≥5010~50 <1014 锌金属(万吨) ≥5010~50 <1015 铝土矿矿石(万吨) ≥2000500~2000 <50016 镍金属(万吨) ≥102~10 <217 钴金属(万吨) ≥20.2~2 <0.218 钨WO3(万吨) ≥51~5 <119 锡金属(万吨) ≥40.5~4 <0.520 铋金属(万吨) ≥51~5 <121 钼金属(万吨) ≥101~10 <122 汞金属(吨) ≥2000500~2000 <50023 锑金属(万吨) ≥101~10 <124 镁(冶镁白云岩)(冶镁菱镁矿)矿石(万吨) ≥50001000~5000 <100025 铂族金属(吨) ≥102~10 <226 金(岩金) 金属(吨) ≥205~50 <5 (砂金) 金属(吨) ≥82~8 <227 银金属(吨) ≥1000200~1000 <20028 铌(原生矿) Nb2O5(万吨) ≥101~10 <1 (砂矿) 矿物(吨) ≥2000500~2000 <50029 钽(原生矿) Ta2O5(吨) ≥1000500~1000 <500 (砂矿) 矿物(吨) ≥500100~500 <10030 铍BeO(吨) ≥100002000~10000 <200031 锂(矿物锂矿) Li2O(万吨) ≥101~10 <1(盐湖锂矿) LiCl(万吨) ≥5010~50 <1032 锆(锆英石) 矿物(万吨) ≥205~20 <5继表序号矿种名称单位规模大型中型小型33 锶(天青石) Sr SO4(万吨) ≥205~20 <534 铷(盐湖中的铷另计)Rb2O(吨) ≥2000500~2000 <50035 铯Cs2O(吨) ≥2000500~2000 <50036 稀土(砂矿)独居石(吨) ≥100001000~10000 <1000磷钇矿(吨) ≥5000500~5000 <500(原生矿) TR2O3(万吨) ≥505~50 <5 (风化壳矿床)(铈族氧化物)(万吨)≥101~10 <1 (风化壳矿床)(钇族氧化物)(万吨)≥50.5~5 <0.537 钪Sc(吨) ≥102~10 <238 锗Ge(吨) ≥20050~200 <5039 镓Ga(吨) ≥2000400~2000 <40040 铟In(吨) ≥500100~500 <10041 铊Tl(吨) ≥500100~500 <10042 铪Hf(吨) ≥500100~500 <10043 铼Re(吨) ≥505~50 <544 镉Cd(吨) ≥3000500~3000 <50045 硒Se(吨) ≥500100~500 <10046 碲Te(吨) ≥500100~500 <10047 金刚石(原生矿) 矿物(万克拉) ≥10020~100 <20 (砂矿) 矿物(万克拉) ≥5010~50 <1048 石墨(晶质) 矿物(万吨) ≥10020~100 <20(隐晶质) 矿石(万吨) ≥1000100~1000 <10049 磷矿矿石(万吨) ≥5000500~5000 <50050 自然硫S(万吨) ≥500100~500 <10051 硫铁矿矿石(万吨) ≥3000 200~3000 <20052 钾盐(固态) KCl(万吨) ≥1000100~1000 <100(液态) KCl(万吨) ≥5000500~5000 <500续表序号矿种名称单位规模大型中型小型53 硼(内生硼矿) B2O3(万吨) ≥5010~50 <1054 水晶(压电水晶) 单晶(吨) ≥20.2~2 <0.2 (熔炼水晶) 矿物(吨) ≥10010~100 <10 (光学水晶) 矿物(吨) ≥0.50.05~0.5 <0.05 (工艺水晶) 矿物(吨) ≥0.50.05~0.5 <0.0555 刚玉矿物(万吨) ≥10.1~1 <0.156 蓝晶石矿物(万吨) ≥20050~200 <5057 硅灰石矿物(万吨) ≥10020~100 <2058 钠硝石NaNO3(万吨) ≥500100~500 <100 59 滑石矿石(万吨) ≥500100~500 <10060 石棉(超基性岩型) 矿物(万吨) ≥50050~500 <50 (镁质碳酸盐型)矿物(万吨) ≥5010~50 <1061 蓝石棉矿物(吨) ≥1000100~1000 <10062 云母工业原料云母(吨)≥1000200~1000 <20063 钾长石矿物(万吨) ≥10010~100 <1064 石榴子石矿物(万吨) ≥50050~500 <5065 叶蜡石矿石(万吨) ≥20050~200 <5066 蛭石矿石(万吨) ≥10020~100 <2067 沸石矿石(万吨) ≥5000500~5000 <50068 明矾石矿物(万吨) ≥1000200~1000 <20069 芒硝Na2SO4(万吨) ≥1000100~1000 <100(钙芒硝) Na2SO4(万吨) ≥100001000~10000 <100070 石膏矿石(万吨) ≥30001000~3000 <100071 重晶石矿石(万吨) ≥1000200~1000 <20072 毒重石矿石(万吨) ≥1000200~1000 <20073 天然碱(Na2CO3+NaHCO3)(万吨)≥1000200~1000 <20074 冰洲石矿物(吨) ≥10.1~1 <0.175 菱镁矿矿石(亿吨) ≥0.50.1~0.5 <0.1续表序号矿种名称单位规模大型中型小型76 萤石(普通萤石) CaF2(万吨) ≥10020~100 <20 (光学萤石) 矿物(吨) ≥10.1~1 <0.177 石灰岩(电石用灰岩)(制碱用灰岩)(化肥用灰岩)(熔剂用灰岩)矿石(亿吨) ≥0.50.1~0.5 <0.1(玻璃用灰岩)(制灰用灰岩)矿石(亿吨) ≥0.10.02~0.1 <0.02 (水泥用灰岩,包括白垩)矿石(亿吨) ≥0.80.15~0.8 <0.1578 泥灰岩矿石(亿吨) ≥0.50.1~0.5 <0.179 含钾岩石(包括矿石(亿吨) ≥10.2~1 <0.2含钾砂页岩)80 白云岩(冶金用)(化肥用)(玻璃用)矿石(亿吨) ≥0.50.1~0.5 <0.181 硅质原料(包括石英岩、砂岩、天然石英砂、脉石英、粉石英)(冶金用)(水泥配料用)(水泥标准砂)矿石(万吨) ≥2000 200~2000 <200 (玻璃用) 矿石(万吨) ≥1000200~1000 <200 (铸型用) 矿石(万吨) ≥1000100~1000 <100 (砖瓦用) 矿石(万立方米) ≥2000500~2000 <500 (建筑用) 矿石(万立方米) ≥50001000~5000 <1000 (化肥用) 矿石(万吨) ≥100002000~10000 <2000 (陶瓷用) 矿石(万吨) ≥10020~100 <2082 天然油石矿石(万吨) ≥10010~100 <1083 硅藻土矿石(万吨) ≥1000200~1000 <20084 页岩(砖瓦用) 矿石(万立方米) ≥2000200~2000 <200(水泥配料用) 矿石(万吨) ≥5000500~5000 <500续表序号矿种名称单位规模大型中型小型85 高岭土(包括陶瓷土)矿石(万吨) ≥500100~500 <10086 耐火粘土矿石(万吨) ≥1000200~1000 <20087 凹凸棒石矿石(万吨) ≥500100~500 <10088 海泡石粘土(包括伊利石粘土、累托石粘土)矿石(万吨) ≥500100~500 <10089 膨润土矿石(万吨) ≥5000500~5000 <50090 铁矾土矿石(万吨) ≥1000200~1000 <20091 其他粘土(铸型用粘土) 矿石(万吨) ≥1000200~1000 <200 (砖瓦用粘土) 矿石(万吨) ≥2000500~2000 <500 (水泥配料用粘土)(水泥配料用红土)(水泥配料用黄土)(水泥配料用泥岩)矿石(万吨) ≥2000500~2000 <500 (保温材料用粘土) 矿石(万吨) ≥20050~200 <5092 橄榄岩(化肥用) 矿石(亿吨) ≥10.1~1 <0.193 蛇纹岩(化肥用) 矿石(亿吨) ≥10.1~1 <0.1 (熔剂用) 矿石(亿吨) ≥0.50.1~0.5 <0.194 玄武岩(铸石用) 矿石(万吨) ≥1000200~1000 <20095 辉绿岩(铸石用) 矿石(万吨) ≥1000200~1000 <200 (水泥用) 矿石(万吨) ≥2000200~2000 <20096 水泥混合材(安山玢岩)(闪长玢岩)矿石(万吨) ≥2000200~2000 <20097 建筑用石材矿石(万立方米) ≥50001000~5000 <100098 饰面用石材矿石(万立方米) ≥1000200~1000 <20099 珍珠岩(包括黑曜岩、松脂岩)矿石(万吨) ≥2000500~2000 <500100 浮石矿石(万吨) ≥30050~300 <50续表序号矿种名称单位规模大型中型小型101 粗面岩(水泥用)(铸石用)矿石(万吨) ≥1000200~1000 <200102 凝灰岩(玻璃用) 矿石(万吨) ≥1000200~1000 <200 (水泥用) 矿石(万吨) ≥2000200~1000 <200103 大理石(水泥用) 矿石(万吨) ≥2000200~2000 <200 (玻璃用) 矿石(万吨) ≥50001000~5000 <1000104 板岩(水泥配料用)矿石(万吨) ≥2000200~2000 <200105 泥炭矿石(万吨) ≥1000100~1000 <100106 矿盐(包括地下卤水)NaCl(亿吨) ≥101~10 <1107 镁盐MgCl2/MgSO4(万吨)≥50001000~5000 <1000108 碘碘(吨) ≥5000500~5000 <500 109 溴溴(吨) ≥500005000~50000 <5000 110 砷砷(万吨) ≥50.5~5 <0.5111 地下水允许开采量(立方米/日)≥10000010000~100000 <10000112 矿泉水允许开采量(立方米/日)≥5000500~5000 <500113 二氧化碳气气量(亿立方米)≥30050~300 <50说明:1. 确定矿产资源储量规模依据的单元:(1) 石油:油田天然气、二氧化碳气:气田(2) 地势:地热田;(3) 固体矿产(煤除外):矿床;(4) 地下水、矿泉水:水源地。

P1、P2、P3指SEC、SPE的储量分类范畴。
按照地质认识程度,资源分为4大类产量(production),储量(reserve),潜在资源(contingent resource)和远景资源(prospective resource)其中,储量分3级,即P1:证实储量(proved reserves)P2:概算储量(probable reserves)P3:可能储量(possible reserves)我们常说的1P=P1,2P=P1+P2,3P=P1+P2+P31C表示条件潜在储量的低估算量方案。
2C表示条件潜在储量的最佳估算量方案。
3C表示条件潜在储量的高估算量方案。
1P等同于证实储量;表示储量的低估算量方案。
2P等同于证实储量与可能储量的和;表示储量的最佳估算量方案。
3P等同于证实储量加上可能储量加上潜在(可采)储量的和;表示储量的高估算量方案。
探明的P1 储量1)探明储量是已完成有评价探井、测井、岩心、生产测试等资料,储量参数取全或基本取全并被探明了的储量。
该储量是编制油(气)田开发方案、进行油(气)田开发建设投资决策和油(气)田开发分析的重要基础。
探明储量又分为已开发(Proved Developed),简称P1的PD储量类型;未开发(Proved Undeveloped),简称P1 的PUD 储量类型。
探明可采储量实际采出的油量将等于或超过评估值的概率至少有90%。
2)已开发PD 的探明储量是指根据开发方案要求已经钻完开发井及已建成地面集输工程的储量。
已开发探明的可采储量根据生产情况又分为已生产PDP(ProvedDeveloped Producing)和未生产PDNP (Proved Developed Non producing)的储量。
已开发未生产PDNP 的储量是指在评估时已射孔但尚未投产井层的储量;由于市场条件或管理要求关掉井层的储量;管外储量,亦即是在现有生产井中可以补孔或重新完井可获得有关层段的可采储量。

欧洲的矿产资源及分布:各国家都有哪些矿产资源?1,挪威:石油、铝、镁、天然气。
该国是世界第八大石油出口国。
该国是西欧最大的铝生产国和出口国。
该国镁的产量居世界第2位。
※2,瑞典:铁矿、石油、煤。
该国是欧洲最大的铁矿砂出口国。
※该国的合金钢、特种钢在世界上享有盛名。
※3,芬兰:森林覆盖率高达80%。
该国机械制造具有世界先进水平。
该国是世界第2大纸张、纸板出口国和世界第四大纸浆出口国。
4,丹麦:石油、天然气。
该国奶酪、猪肉和黄油出口量居世界前列。
该国是世界上最大的貂皮生产和出口国之一。
该国是欧盟最大的渔业国。
5,爱沙尼亚:油页岩、泥炭、磷钙石。
6,拉脱维亚:泥炭、白云石、石英砂、石膏。
7,立陶宛:泥炭。
8,白俄罗斯:泥炭、岩盐、钾盐、石油。
9,乌克兰:煤、铁、锰的储量居世界前列。
10,摩尔多瓦:褐煤、磷钙石。
11,俄罗斯:石油、煤、泥炭、铁、铝、磷灰石、钾、有色金属和稀有金属储量均居世界前列。
※该国天然气储量居世界首位。
该国煤储量居世界第5位。
该国铁蕴藏量居世界第一位。
※该国铝储量居世界第2位。
该国水资源居世界第2位。
该国森林覆盖面积居世界第一位。
该国黄金和铀的储量居世界前三位。
※12,德国:煤、钾盐。
该国是世界第2大商品出口国和世界第4大经济强国。
13,波兰:煤、硫磺。
该国硬煤储量居世界前列,褐煤储量居欧洲第3位。
该国硫磺储量居欧洲首位。
14,捷克:褐煤、硬煤。
该国褐煤储量居世界第3位。
该国硬煤储量居欧洲第5位。
15,匈牙利:铝土矿蕴藏量居欧洲第3位。
16,罗马西亚:石油、天然气位居欧洲前列。
该国是欧洲第2大成衣制造国,也是欧洲主要的粮食生产国和出口国。
17,保加利亚:玫瑰油的产量和出口量均占世界首位。
18,希腊:铅矾土、褐煤。
19,阿尔巴尼亚:石油、沥青、铬、铜、镍、铁、煤。
20,波斯尼亚和黑塞哥维那:褐煤、铝矾土、铅锌矿。
该国食用盐储量为欧洲第一。
21,塞尔维亚:铜、铅、锌.煤。
22,北马其顿:煤、铁、铅、班脱土、石膏、石英、蛋白石。

联合国能源和矿产资源的分类框架分类分类因素术语:经济的(Economic):E1、E2、E3可行性研究/采矿报告的(Feasibility Study):F1 , F2 , F3地址的(Geologic):G1、G2、G3、G4’类型因素级别E1 Economic 经济的E1.1 Normal Economic 正常经济的E1.2 Exceptional Economic 期望经济的E2 Potentially 潜在经济的E2.1 Marginal Economic 边际经济的E2.2 sub-Marginal Economic 次边际经济的E3 Intrinsically Economic 内蕴经济的F1 Mining Report and /or Feeasibility Study 采矿报告/或可行性研究F1.1 Mining Report 采矿报告F1.3 Feasibility Study 可行性报告F2 pre-feasibility Study 预可行性研究F3 Geological Study 地质研究G1 Detailed Exploration 详细勘探G2 General Exploration 初步勘探G3 Prospecting 普查G4 Reconnaissance Study 踏勘阐述煤、铁、铜、岩金矿床勘查的勘查类型的划分依据、划分的勘查类型及工程间距概念:按勘查的难易程度对矿床所划分的类型称为矿床的勘查类型。
一、矿床勘查类型1、确定勘查类型的主要地质依据。
依据矿体规模、矿体形态的复杂程度、构造复杂程度和矿石有用组分分布均匀程度,将勘查类型划分为三个类型。
其中第Ⅰ勘查类型为简单型,矿体规模为大型,矿体形态和构造变化均简单,矿石有用组分分布均匀。
第Ⅱ类勘查类型为中等型,矿体规模为中等,矿体形态和构造变化中等,矿石有用组分分布较均匀。
第Ⅲ类勘查类型为复杂型,矿体规模小型,矿体形态和构造变化复杂。


采矿权和探矿权在资产价值上没有区别——兼谈某些矿产资源管理名词的完善咨询委员李裕伟对于同一个矿产地,说起采矿权,人们总觉得它的价值要高于探矿权,其实这是一种误解。
在法律的层面上,探矿权和采矿权是有区别的;但在经济的层面上,探矿权与采矿权并无区别。
首先我们需要引入矿产资源资产(以下简称矿资产)的概念,它同这宗资产是在探矿权名下还是在采矿权名下无关。
譬如说有一宗煤炭资源的矿产资源资产,经评估其价值为2000万元,那么不论该资产是作为探矿权出让,还是作为采矿权出让,其价值均应为2000万元。
正是因为在我国的矿产资源法规体系中没有引入矿资产的概念,而是用矿业权代表矿资产,具体讲是用探矿权和采矿权代表矿资产,这就使得“矿业权”一词具承担了双重责任:其一是矿产资源的法律保障,其二是矿产资源的资产实物。
基于这种把矿产资源的法律属性和经济属性混合成一个词的现实,于是“矿业权”既作为一种权属在政府部门审批,又作为一种资产在市场上转让,但到底在什么情况下矿业权是权力的代表,什么时候是资产的代表,人们很难说得清楚。
在许多情况下是其权力属性与资产属性混在一起,从而导致政府行为与市场行为混在一起,不利于政府清晰地执行其矿产资源的行政审批和资产监管职能。
国外矿业权和矿产资源资产是两个概念,用两个名词来表示。
矿业权(mining title 或 mining right)是对某一特定矿产地开展矿业活动的法律保障;矿资产(mineral property)是在该矿产地中的矿产资源实物,包括资源/储量、矿床、矿体、矿化、异常、远景区等,对它们应进行了圈定和评估。
矿资产有两个基本权属主体:所有者和使用者。
在我国,所有者是国家,使用者是企业。
按照国外惯例,从矿业公司(使用者)的角度,矿资产等于该矿产地的全部价值减去权利金及其他形式的矿产资源所有者提取部分。
假定该矿产地的全部价值为Q,国家作为所有者占有P,矿资产R=Q-P。
R是矿资产,而矿业权是对R进行法律保护。

Mineral Reservesand Mineral Resources Defi nitionsA mineral resource is a concentration or occurrence of diamonds, natural solid inorganic material, or natural solid fossilized organic material including base and precious metals, coal, and industrial minerals in or on the Earth’s crust in such form and quantity and of such a grade or quality that it has reasonable prospects for economic extraction. The location, quantity, grade, geological characteristics and continuity of a mineral resource are known, estimated or interpreted from specifi c geological evidence and knowledge. Mineral resources are sub-divided, in order of increasing geological confi dence,into inferred, indicated and measured categories.An inferred mineral resource is that part of a mineral resource for which quantity and grade or quality can be estimated on the basis of geological evidence and limited sampling and reasonably assumed, but not verifi ed, geological and grade continuity. The estimate is based on limited information and sampling gathered through appropriate techniques from locations such as outcrops, trenches, pits, workings and drill holes.An indicated mineral resource is that part of a mineral resource for which quantity, grade or quality, densities, shape and physical characteristics, can be estimated with a level of confi dence suffi cient to allow the appropriate application of technical and economic parameters, to support mine planning and evaluation of the economic viability of the deposit. The estimate is based on detailed and reliable exploration and testing information gathered through appropriate techniques from locations such as outcrops, trenches, pits, workings and drill holes that are spaced closely enough for geological and grade continuity to be reasonably assumed.A measured mineral resource is that part of a mineral resource for which quantity, grade or quality, densities, shape and physical characteristics are so well established that they can be estimated with confi dence suffi cient to allow the appropriate application of technical and economic parameters, to support production planning and evaluation of the economic viability of the deposit. The estimate is based on detailed and reliable explo r ation, sampling and testing information gathered through appropriate techniques from locations such as outcrops, trenches, pits, workings and drill holes that are spaced closely enough to confi rm both geological and grade continuity.Mineral resources, which are not mineral reserves, do not have demonstrated economic viability.A mineral reserve is the economically mineable part of a measured or indicated mineral resource demonstrated by at least a preliminary feasibility study. This study must include adequate information on mining, processing, metallurgical, economic and other relevant factors that demonstrate, at the time of reporting, that economic extraction can be justifi ed.A mineral reserve includes diluting materials and allowances for losses that may occur when the materialis mined. Mineral reserves are sub-divided in order of increasing confi dence into probable mineral reserves and proven mineral reserves. A probable mineral reserve is the economically mineable part of an indicated and, in some circumstances, a measured mineral resource demonstrated by at least a preliminary feasibility study. This study must include adequate information on mining, processing, metallurgical, economic and other relevant factors that demonstrate, at the time of reporting, that economic extraction can be justifi ed.A proven mineral reserve is the economically mineable part of a measured mineral resource demonstrated by at least a preliminary feasibility study. This study must include adequate information on mining, processing, metallurgical, economic and other relevant factors that demonstrate, at the time of reporting, that economic extraction is justifi ed.The tables on the next seven pages set forth Barrick’s interest in the total proven and probable gold and copper reserves and in the total measured and indicated gold, copper and nickel resources and certain related information at each property. For further details of proven and probable mineral reserves and measured, indicated and inferred mineral resources by category, metal and property, see pages 182 to 188.The Company has carefully prepared and verifi ed the mineral reserve and mineral resource fi gures and believes that its method of estimating mineral reserves has been verifi ed by mining experience. These fi gures are estimates, however, and no assurance can be given that the indicated quantities of metal will be produced. Metal price fl uctuations may render mineral reserves containing relatively lower grades of mineralization uneconomic. Moreover, short-term operating factors relating to the mineral reserves, such as the need for orderly development of ore bodies or the processing of new or different ore grades, could affect the Company’s profi tability in any particular accounting period.181Summary Gold Mineral Reserves and Mineral Resources1,2,3For the years ended December 312011 2010OuncesTons Grade Ounces TonsGradeBased on attributable ounces (000s) (oz/ton) (000s) (000s)(000s)(oz/ton)North AmericaGoldstrike Open Pit (proven and probable)97,325 0.096 9,34295,865 0.101 9,656(mineral resource)4,612 0.032 1474,694 0.037 173Goldstrike Underground (proven and probable)11,895 0.255 3,03510,872 0.272 2,958(mineral resource)6,077 0.301 1,8286,771 0.298 2,020 Goldstrike Property Total (proven and probable)109,220 0.113 12,377106,737 0.118 12,614(mineral resource)10,689 0.185 1,97511,465 0.191 2,193 Pueblo Viejo (60.00%) (proven and probable)188,729 0.080 15,173168,417 0.084 14,195(mineral resource)120,194 0.055 6,59796,807 0.059 5,675Cortez (proven and probable)306,879 0.047 14,488317,081 0.046 14,494(mineral resource)54,391 0.069 3,75760,463 0.071 4,320Red Hill – Goldrush (proven and probable)– – –– – –(mineral resource)11,221 0.113 1,273– – – Bald Mountain (proven and probable)307,162 0.017 5,102246,711 0.019 4,748(mineral resource)123,191 0.013 1,623151,944 0.011 1,680 Turquoise Ridge (75.00%) (proven and probable)11,986 0.442 5,2949,254 0.456 4,224(mineral resource)62,394 0.122 7,64164,219 0.131 8,415Round Mountain (50.00%) (proven and probable)82,688 0.017 1,41173,017 0.018 1,319(mineral resource)83,420 0.016 1,33850,865 0.022 1,107South Arturo (60.00%) (proven and probable)28,237 0.050 1,39827,358 0.051 1,391(mineral resource)21,482 0.039 82816,041 0.043 692Ruby Hill (proven and probable)16,778 0.058 97817,182 0.065 1,122(mineral resource)107,626 0.021 2,24561,530 0.023 1,390Hemlo (proven and probable)16,620 0.069 1,13918,388 0.074 1,362(mineral resource)4,735 0.087 4104,184 0.071 299 Marigold Mine (33.33%) (proven and probable)77,285 0.015 1,19447,843 0.016 775(mineral resource)10,977 0.012 13526,842 0.014 387Golden Sunlight (proven and probable)8,932 0.055 4879,649 0.056 539(mineral resource)716 0.041 291,231 0.047 58Donlin Gold (50.00%) (proven and probable)– – –– – –(mineral resource)298,358 0.065 19,503322,485 0.060 19,357South AmericaCerro Casale (75.00%) (proven and probable)990,088 0.018 17,4341,002,722 0.017 17,377(mineral resource)245,990 0.010 2,494199,842 0.012 2,376Pascua-Lama (proven and probable)424,117 0.042 17,861423,931 0.042 17,845(mineral resource)269,930 0.025 6,734231,590 0.027 6,260Veladero (proven and probable)481,153 0.022 10,558483,181 0.023 11,291(mineral resource)44,029 0.011 46451,130 0.012 600Lagunas Norte (proven and probable)214,418 0.029 6,151210,104 0.031 6,618(mineral resource)35,164 0.014 50540,529 0.019 756Pierina (proven and probable)67,865 0.011 77159,947 0.013 791(mineral resource)10,243 0.013 13218,288 0.015 2731. Resources which are not reserves do not have demonstrated economic viability.2. See accompanying footnote #1.3. Measured plus indicated resources.182Summary Gold Mineral Reserves and Mineral Resources1,2,3For the years ended December 312011 2010OuncesTons Grade Ounces TonsGradeBased on attributable ounces (000s) (oz/ton) (000s) (000s)(000s)(oz/ton) Australia PacificPorgera (95.00%) (proven and probable) 75,372 0.084 6,36683,611 0.089 7,432(mineral resource) 27,369 0.071 1,93319,535 0.074 1,449 Kalgoorlie (50.00%) (proven and probable) 108,843 0.040 4,39470,860 0.053 3,780(mineral resource) 23,211 0.033 76646,907 0.025 1,152Cowal (proven and probable) 65,280 0.034 2,20971,050 0.035 2,478(mineral resource) 37,191 0.032 1,18747,349 0.032 1,503 Plutonic (proven and probable) 2,987 0.135 4022,078 0.202 420(mineral resource) 2,451 0.275 6753,130 0.262 820 Kanowna Belle (proven and probable) 5,861 0.142 8326,813 0.159 1,086(mineral resource) 6,326 0.124 7867,201 0.125 901Darlot (proven and probable) 2,805 0.127 3573,241 0.124 403(mineral resource) 1,345 0.192 2581,676 0.153 256 Granny Smith (proven and probable) 4,034 0.157 6354,018 0.154 617(mineral resource) 2,507 0.166 4173,419 0.175 599 Lawlers (proven and probable) 1,669 0.140 2342,124 0.166 352(mineral resource) 977 0.289 2821,118 0.249 278Reko Diq (37.50%)4(proven and probable) – – –– – –(mineral resource) 1,232,986 0.008 9,5061,232,986 0.008 9,506AfricaBulyanhulu (73.90%) (proven and probable) 22,963 0.342 7,85723,903 0.341 8,147(mineral resource) 14,472 0.154 2,2309,011 0.236 2,128North Mara (73.90%) (proven and probable) 28,997 0.089 2,57522,502 0.093 2,096(mineral resource) 13,025 0.082 1,06415,183 0.089 1,355 Buzwagi (73.90%) (proven and probable) 50,036 0.043 2,15445,277 0.047 2,137(mineral resource) 28,910 0.033 94714,727 0.028 417 Nyanzaga (73.90%) (proven and probable) – – –– – –(mineral resource) 60,186 0.043 2,572– – –Tulawaka (51.73%) (proven and probable) 135 0.348 47261 0.188 49(mineral resource) 500 0.160 80422 0.159 67Other(proven and probable) 173 0.306 53210 0.400 84(mineral resource) 37 0.351 13163 0.307 50Total(proven and probable) 3,701,312 0.038 139,9313,557,470 0.039 139,786(mineral resource) 2,966,243 0.027 80,3992,812,282 0.027 76,3191. Resources which are not reserves do not have demonstrated economic viability.2. See accompanying footnote #1.3. Measured plus indicated resources.4. See accompanying footnote #2.183Gold Mineral Reserves1As at December 31, 2011Proven Probable TotalContained Contained ContainedTons Grade ounces Tons Grade ounces Tons Grade ounces ounces (000s) (oz/ton) (000s) (000s) (oz/ton) (000s) (000s) (oz/ton) (000s) attributableonBasedNorth AmericaGoldstrike Open Pit 58,885 0.092 5,427 38,440 0.102 3,915 97,325 0.096 9,342Goldstrike Underground 4,071 0.330 1,344 7,824 0.216 1,691 11,895 0.255 3,035 Goldstrike Property Total 62,956 0.108 6,771 46,264 0.121 5,606 109,220 0.113 12,377 Pueblo Viejo (60.00%) 23,925 0.098 2,342 164,804 0.078 12,831 188,729 0.080 15,173Cortez 30,714 0.070 2,153 276,165 0.045 12,335 306,879 0.047 14,488Bald Mountain 86,914 0.019 1,614 220,248 0.016 3,488 307,162 0.017 5,102 Turquoise Ridge (75.00%) 5,000 0.444 2,222 6,986 0.440 3,072 11,986 0.442 5,294 Round Mountain (50.00%) 27,521 0.020 562 55,167 0.015 849 82,688 0.017 1,411South Arturo (60.00%) – – – 28,237 0.050 1,398 28,237 0.050 1,398Ruby Hill 965 0.060 58 15,813 0.058 920 16,778 0.058 978Hemlo 3,661 0.102 375 12,959 0.059 764 16,620 0.069 1,139 Marigold Mine (33.33%) 13,232 0.017 221 64,053 0.015 973 77,285 0.015 1,194Golden Sunlight 2,689 0.057 153 6,243 0.053 334 8,932 0.055 487South AmericaCerro Casale (75.00%) 189,900 0.019 3,586 800,188 0.017 13,848 990,088 0.018 17,434Pascua-Lama 43,514 0.050 2,167 380,603 0.041 15,694 424,117 0.042 17,861Veladero 36,931 0.022 828 444,222 0.022 9,730 481,153 0.022 10,558Lagunas Norte 17,132 0.036 625 197,286 0.028 5,526 214,418 0.029 6,151Pierina 6,813 0.015 103 61,052 0.011 668 67,865 0.011 771 Australia PacificPorgera (95.00%) 18,267 0.117 2,138 57,105 0.074 4,228 75,372 0.084 6,366Kalgoorlie (50.00%) 67,193 0.030 2,047 41,650 0.056 2,347 108,843 0.040 4,394Cowal 14,774 0.024 353 50,506 0.037 1,856 65,280 0.034 2,209Plutonic 1,015 0.025 25 1,972 0.191 377 2,987 0.135 402Kanowna Belle 3,403 0.146 497 2,458 0.136 335 5,861 0.142 832Darlot 1,627 0.126 205 1,178 0.129 152 2,805 0.127 357Granny Smith 1,060 0.158 168 2,974 0.157 467 4,034 0.157 635Lawlers 859 0.157 135 810 0.122 99 1,669 0.140 234Henty – – – – – – – – – AfricaBulyanhulu (73.90%) 1,002 0.314 315 21,961 0.343 7,542 22,963 0.342 7,857North Mara (73.90%) 9,367 0.081 761 19,630 0.092 1,814 28,997 0.089 2,575Buzwagi (73.90%) 4,039 0.032 129 45,997 0.044 2,025 50,036 0.043 2,154Tulawaka (51.73%) 36 0.111 4 99 0.434 43 135 0.348 47Other131 0.344 45 42 0.190 8 173 0.306 53Total 674,640 0.045 30,602 3,026,672 0.036 109,329 3,701,312 0.038 139,931 Copper Mineral Reserves1As at December 31, 2011Proven Probable TotalContained Contained ContainedTons Grade lbs Tons Grade lbs Tons Grade lbs(millions) (000s) (%)(millions) pounds (000s) (%)(millions) (000s) (%)BasedonattributableZaldívar 425,791 0.528 4,496 211,304 0.498 2,106 637,095 0.518 6,602Lumwana 147,415 0.587 1,731 322,535 0.493 3,178 469,950 0.522 4,909Jabal Sayid 16,500 2.206 728 10,315 2.201 454 26,815 2.204 1,182Total 589,706 0.590 6,955 544,154 0.527 5,738 1,133,860 0.560 12,6931. See accompanying footnote #1.184Gold Mineral Resources1,2As at December 31, 2011Measured (M) Indicated (I) (M) + (I) InferredContained Contained Contained ContainedTons Grade ounces Tons Grade ounces ounces Tons Grade ounces attributable(oz/ton) (000s) ounces (000s) (oz/ton) (000s) (000s) (oz/ton) (000s) (000s) (000s) onBasedNorth AmericaGoldstrike Open Pit 886 0.032 28 3,726 0.032 119 147 564 0.055 31 Goldstrike Underground 985 0.341 336 5,092 0.293 1,492 1,828 2,698 0.298 805 Goldstrike Property Total 1,871 0.195 364 8,818 0.183 1,611 1,975 3,262 0.256 836 Pueblo Viejo (60.00%) 2,296 0.062 143 117,898 0.055 6,454 6,597 14,970 0.047 701 Cortez 3,159 0.038 121 51,232 0.071 3,636 3,757 21,881 0.074 1,615 Red Hill – Goldrush – – – 11,221 0.113 1,273 1,273 41,290 0.139 5,748 Bald Mountain 34,428 0.014 480 88,763 0.013 1,143 1,623 72,491 0.011 787 Turquoise Ridge (75.00%) 7,995 0.128 1,024 54,399 0.122 6,617 7,641 25,494 0.130 3,303 Round Mountain (50.00%) 17,795 0.022 400 65,625 0.014 938 1,338 38,847 0.012 464 South Arturo (60.00%) – – – 21,482 0.039 828 828 10,458 0.023 236 Ruby Hill 1,331 0.024 32 106,295 0.021 2,213 2,245 5,779 0.034 196 Hemlo 2,000 0.110 220 2,735 0.069 190 410 2,937 0.127 374 Marigold Mine (33.33%) 683 0.012 8 10,294 0.012 127 135 3,674 0.013 48 Golden Sunlight 121 0.041 5 595 0.040 24 29 1,605 0.036 57 Donlin Gold (50.00%) 4,261 0.073 313 294,097 0.065 19,190 19,503 50,825 0.059 2,997 South AmericaCerro Casale (75.00%) 19,356 0.008 164 226,634 0.010 2,330 2,494 413,013 0.011 4,513 Pascua-Lama 23,420 0.031 722 246,510 0.024 6,012 6,734 35,590 0.034 1,215 Veladero 3,800 0.009 36 40,229 0.011 428 464 74,600 0.008 573 Lagunas Norte 884 0.014 12 34,280 0.014 493 505 7,920 0.014 109 Pierina 581 0.012 7 9,662 0.013 125 132 9,474 0.006 61 Australia PacificPorgera (95.00%) 9,065 0.080 724 18,304 0.066 1,209 1,933 22,671 0.130 2,936 Kalgoorlie (50.00%) 6,054 0.035 212 17,157 0.032 554 766 348 0.078 27 Cowal – – – 37,191 0.032 1,187 1,187 12,418 0.030 374 Plutonic 240 0.117 28 2,211 0.293 647 675 3,975 0.298 1,183 Kanowna Belle 2,776 0.128 354 3,550 0.122 432 786 5,631 0.104 588 Darlot 766 0.187 143 579 0.199 115 258 1,043 0.215 224 Granny Smith 403 0.159 64 2,104 0.168 353 417 5,316 0.237 1,261 Lawlers – – – 977 0.289 282 282 472 0.316 149 Reko Diq (37.50%)3718,521 0.009 6,466 514,465 0.006 3,040 9,506 1,192,569 0.005 6,399 AfricaBulyanhulu (73.90%) – – – 14,472 0.154 2,230 2,230 6,776 0.350 2,372 North Mara (73.90%) 2,222 0.061 136 10,803 0.086 928 1,064 1,269 0.075 95 Buzwagi (73.90%) 110 0.036 4 28,800 0.033 943 947 8,390 0.034 283 Nyanzaga (73.90%) – – – 60,186 0.043 2,572 2,572 7,381 0.060 442 Tulawaka (51.73%) – – – 500 0.160 80 80 95 0.168 16 Other34 0.353 12 3 0.333 1 13 4 0.250 1 Total864,172 0.014 12,194 2,102,071 0.032 68,205 80,399 2,102,468 0.019 40,183Copper Mineral Resources1,2As at December 31, 2011Measured (M) Indicated (I) (M) + (I) InferredContained Contained Contained ContainedTons Grade lbs Tons Grade lbs lbs Tons Grade lbs Based on attributable pounds (000s) (%) (millions) (000s) (%) (millions) (millions) (000s) (%) (millions) Zaldívar 78,576 0.433 680 59,006 0.462 545 1,225 40,439 0.543 439 Lumwana 4,698 0.713 67 162,737 0.619 2,015 2,082 882,479 0.604 10,660 Jabal Sayid 1,984 1.890 75 4,212 2.077 175 250 19,436 0.962 374 Reko Diq (37.50%)3718,521 0.536 7,697 514,465 0.392 4,034 11,731 1,192,569 0.352 8,393 Total803,779 0.530 8,519 740,420 0.457 6,769 15,288 2,134,923 0.465 19,8661. Resources which are not reserves do not have demonstrated economic viability.2. See accompanying footnote #1.3. See accompanying footnote #2.185186Contained Silver Within Reported Gold Reserves 1For the year ended In proven In probable December 31, 2011gold reservesgold reservesTotalContained Contained Contained ProcessTons Grade ounces Tons Grade ounces Tons Grade ounces recovery Based on attributable ounces(000s) (oz/ton) (000s)(000s) (oz/ton) (000s)(000s) (oz/ton) (000s) %North AmericaPueblo Viejo (60.00%) 23,925 0.76 18,144 164,804 0.47 77,956 188,729 0.51 96,100 87.1%South AmericaCerro Casale (75.00%) 189,900 0.06 10,565 800,188 0.04 33,451 990,088 0.04 44,016 69.0% Pascua-Lama 43,514 1.73 75,454 380,603 1.58 600,795 424,117 1.59 676,249 81.6% Lagunas Norte 17,132 0.12 2,021 197,286 0.11 21,884 214,418 0.11 23,905 21.6% Veladero 26,689 0.38 10,259 444,222 0.42 187,436 470,911 0.42 197,695 6.2% Pierina6,813 0.58 3,945 61,052 0.32 19,319 67,865 0.34 23,264 37.0% AfricaBulyanhulu (73.90%) 1,002 0.2120721,9610.286,07922,963 0.276,286 75.0%Total308,9750.39 120,595 2,070,116 0.46 946,920 2,379,0910.45 1,067,515 65.3%1. Silver is accounted for as a by-product credit against reported or projected gold production costs.Contained Copper Within Reported Gold Reserves 1For the year endedIn proven In probableDecember 31, 2011gold reservesgold reservesTotalContained Contained Contained ProcessTons Grade lbs Tons Grade lbs Tons Grade lbs recovery Based on attributable pounds(000s) (%) (millions)(000s) (%) (millions)(000s) (%) (millions) %North AmericaPueblo Viejo (60.00%) 23,925 0.080 38.3 164,804 0.096 316.0 188,729 0.094 354.3 79.5% South AmericaCerro Casale (75.00%) 189,900 0.190721.3 800,188 0.226 3,613.3 990,088 0.219 4,334.6 87.4% Pascua-Lama 43,514 0.096 83.7 380,603 0.075 574.4 424,117 0.078 658.1 63.0% AfricaBulyanhulu (73.90%) 1,002 0.369 7.4 21,961 0.683 299.9 22,963 0.669 307.3 95.0% Buzwagi (73.90%) 4,039 0.068 5.5 45,997 0.118 108.3 50,036 0.114113.870.0% Total262,380 0.163856.21,413,553 0.1744,911.91,675,933 0.172 5,768.184.2%1. Copper is accounted for as a by-product credit against reported or projected gold production costs.Contained Silver Within Reported Gold Resources1For the year ended December 31, 2011Measured (M) Indicated (I) (M) + (I) InferredContained Contained Contained ContainedTons Grade ounces Tons Grade ounces ounces Tons Grade ounces ounces (000s) (oz/ton) (000s) (000s) (oz/ton) (000s) (000s) (000s) (oz/ton) (000s) attributableBasedonNorth AmericaPueblo Viejo (60.00%) 2,296 0.37 839 117,898 0.30 35,723 36,562 14,970 0.37 5,572 South AmericaCerro Casale (75.00%) 19,356 0.04 720 226,634 0.03 7,257 7,977 413,013 0.03 12,594 Pascua-Lama 23,420 0.71 16,708 246,510 0.68 168,459 185,167 35,590 0.45 16,055 Lagunas Norte 884 0.06 50 34,280 0.05 1,778 1,828 7,920 0.05 397 Veladero 3,800 0.16 614 40,229 0.35 14,049 14,663 74,600 0.33 24,523 Pierina 581 0.22 128 9,662 0.19 1,820 1,948 9,474 0.31 2,928 AfricaBulyanhulu (73.90%) – – – 14,472 0.13 1,829 1,829 6,529 0.30 1,949230,915 249,974 562,096 0.11 64,01819,059 689,685 0.33Total50,337 0.381. Resources which are not reserves do not have demonstrated economic viability.Contained Copper Within Reported Gold Resources1For the year ended December 31, 2011In measured (M) In indicated (I)gold resources gold resources (M) + (I) InferredContained Contained Contained ContainedTons Grade lbs Tons Grade lbs lbs Tons Grade lbs Based on attributable pounds (000s) (%) (millions) (000s) (%) (millions) (millions) (000s) (%) (millions) North AmericaPueblo Viejo (60.00%) 2,296 0.12 5.5 117,898 0.084 198.3 203.8 14,970 0.077 23.0 South AmericaCerro Casale (75.00%) 19,356 0.126 48.7 226,634 0.161 730.5 779.2 413,013 0.191 1,580.1 Pascua-Lama 23,420 0.061 28.7 246,510 0.053 261.0 289.7 35,590 0.047 33.7 AfricaBuzwagi (73.90%) 110 0.09 0.2 28,800 0.098 56.7 56.9 8,390 0.089 14.9 Total45,182 0.092 83.1 619,842 0.101 1,246.5 1,329.6 471,963 0.175 1,651.7 1. Resources which are not reserves do not have demonstrated economic viability.Nickel Mineral Resources1For the year ended December 31, 2011Measured (M) Indicated (I) (M) + (I) InferredContained Contained Contained ContainedTons Grade lbs Tons Grade lbs lbs Tons Grade lbs Based on attributable pounds (000s) (%) (millions) (000s) (%) (millions) (millions) (000s) (%) (millions) AfricaKabanga (50.00%) 7,606 2.490 378.8 12,897 2.720 701.6 1,080.4 11,464 2.600 596.1 1. Resources which are not reserves do not have demonstrated economic viability.187Mineral Reserves and Resources Notes1. Mineral reserves (“reserves”) and mineral resources (“resources”) have been calculated as at December 31, 2011 in accordance with National Instrument43-101 as required by Canadian securities regulatory authorities. For United States reporting purposes, Industry Guide 7, (under the Securities and Exchange Act of 1934), as interpreted by Staff of the SEC, applies different standards in order to classify mineralization as a reserve. Accordingly, for U.S. reporting purposes, approximately 2.15 million ounces of reserves at Pueblo Viejo (Barrick’s 60% interest) is classified as mineralized material. In addition, while the terms “measured”, “indicated” and “inferred” mineral resources are required pursuant to National Instrument 43-101, the U.S. Securities and Exchange Commission does not recognize such terms. Canadian standards differ significantly from the requirements of the U.S. Securities and Exchange Commission, and mineral resource information contained herein is not comparable to similar information regarding mineral reserves disclosed in accordance with the requirements of the U.S. Securities and Exchange Commission. U.S. investors should understand that “inferred” mineral resources have a great amount of uncertainty as to their existence and great uncertainty as to their economic and legal feasibility. In addition, U.S. investors are cautioned not to assume that any part or all of Barrick’s mineral resources constitute or will be converted into reserves. Calculations have been prepared by employees of Barrick, its joint venture partners or its joint venture operating companies, as applicable, under the supervision of Rick Sims, Senior Director, Resources and Reserves of Barrick, Chris Woodall, Senior Director, Mining of Barrick and John Lindsay, Senior Director Metallurgy, of Barrick. Except as noted below, reserves have been calculated using an assumed long-term average gold price of $US 1,200 ($Aus.1,330) per ounce, a silver price of $US 22.00 per ounce, a copper price of $US 2.75 per pound and exchange rates of 1.0 $Can/$US and 0.90 $US/$Aus. Reserves at Plutonic have been calculated using an assumed long-term average gold price of $US 1,250. Reserve calculations incorporate current and/or expected mine plans and cost levels at each property. Varying cut-off grades have been used depending on the mine and type of ore contained in the reserves. Barrick’s normal data verification procedures have been employed in connection with the calculations. Resources as at December 31, 2011 have been estimated using varying cut-off grades, depending on both the type of mine or project, its maturity and ore types at each property. For a breakdown of reserves and resources by category and for a more detailed description of the key assumptions, parameters and methods used in calculating Barrick’s reserves and resources, see Barrick’s most recent Annual Information Form/Form 40-F on file with Canadian provincial securities regulatory authorities and the U.S. Securities and Exchange Commission.2. In November 2011, the Government of the Province of Balochistan rejected the application for a mining lease in respect of the Reko Diq project. TethyanCopper Company (“TCC”) has commenced international arbitration proceedings asserting, among other things, that its local operating subsidiary is legally entitled to the mining lease subject only to “routine” government requirements. For additional information regarding this matter, see pages 44 and 178 to 179 of this Annual Report 2011.188。

矿区矿产资源储量规模划分标准
国土资发[2000]133号
国土资源部2000-04-24发布
说明:
1、确定矿产资源储量规模依据的单元:
⑴石油:油田
天然气、二氧化碳气:气田
⑵地热:地热田;
⑶固体矿产(煤除外):矿床
⑷地下水、矿泉水:水源地
2、确定矿产资源储量规模依据的矿产资源储量:
⑴ 石油、天然气、二氧化碳气:地质储量;
⑵地热:电(热)能;
⑶ 固体矿产:基础储量+资源量(仅限331、332、333), 相当于《固体矿产地质勘探规模总则》(GB13908—92)中的A+ B+C+D+E级(表内)储量;
⑷地下水、矿泉水:允许开采量。
3、存在共生矿产的矿区,矿产资源储量规模以矿产资源储量规模最大的矿种确定。
4、中型及小型规模不含其上限数字。


(特约专稿:李裕伟)边界品位确定方法及其在矿产勘查中的应用导读边界品位是估计矿产资源量和储量的关键参数,用于区分矿石和岩石。
一个符合矿床开发技术经济特征的边界品位,将为采矿项目带来应有的利润。
常用的边界品位确定方法有盈亏平衡点法、演进法和蓝氏法。
盈亏平衡点法简单易行,体现了成本-价格-利润之间的基本规律,在矿产勘查、矿山项目可行性研究和矿山生产阶段均可使用。
演进法和蓝氏法细化了经济技术因素,适合在可行性研究与矿山生产阶段使用。
本文在一般介绍各种边界品位估计方法的基础上,重点阐述盈亏平衡点法在矿产勘查中的应用。
本文引用信息李裕伟,边界品位确定方法及其在矿产勘查中的应用[J].中国国土资源经济,2022(03):04-15边界品位(cut off grade)是矿产勘查、矿山项目可行性研究、矿山设计和矿山生产中的一个重要技术概念。
在价格不变的条件下,一个经勘查发现的矿化体是不是矿,有多少矿,平均品位是多少,全凭边界品位“一锤定音”。
有了边界品位,才有了矿的一切;没有了边界品位,就没有了矿的一切。
因此,边界品位在矿产勘查中“一言九鼎”。
对如何确定边界品位,必须遵循矿业经济规律,彰显科学依据。
首先,要搞清楚边界品位是一个什么性质的参数。
对此不外有两种可能:一是资源性质的参数,二是经济性质的参数。
从表面上看,边界品位确实是资源性质的参数,因为它表述的对象是资源量和储量;但从本质上看,边界品位是一个经济指标,矿业项目是否盈利,盈利多少,全靠对它的调节来确定。
边界品位对市场和成本的灵敏度极高,在矿产品价格为5万元/吨时不盈利,到5.5万元/吨时就盈利了;在采选冶成本为80元/吨时不盈利,到85元/吨时就盈利了。
因此,要从经济的角度来确定边界品位的指标值。
边界品位是一个决定矿石和废石界限的指标:边界品位以上是矿石,以下是废石。
决定这个指标有两个核心因素:成本和价格。
当价格固定时,成本上升则边界品位提高,成本下降则边界品位降低;当成本固定时,价格上升则边界品位降低,价格下降则边界品位提高。
附件:
矿产资源储量规模划分标准
继表
续表
续表
续表
说明:
1.确定矿产资源储量规模依据的单元:
(1)石油:油田
天然气、二氧化碳气:气田
(2)地势:地热田;
(3)固体矿产(煤除外):矿床;
(4)地下水、矿泉水:水源地。
2.确定矿产资源储量规模依据的矿产资源储量:
(1)石油、天然气、二氧化碳气:地质储量;
(2)地热:电(热)能;
(3)固体矿产:基础储量+资源量(仅限331、332、333),相当于《固体矿产地质勘探规
范总则》(GB1390892)中的A+B+C+D+E级(表内)储量;
(4)地下水、矿泉水:允许开采量。
3.存在共生矿产的矿区,矿产资源储量规模以矿产资源储量规模最大的矿种确定。
4.中型及小型规模不含其上限数字。


世界主要矿物资源的储备和开采情况摘要世界经济的高速发展致使资源的消耗不断增加,并已经引起某些资源的供求失衡,价格上涨。
随着世界资源储量同需求的矛盾进一步发展,资源将在诸生产要素中的地位上升。
对此,不少国家采取了多种应对措施:一是提高资源的利用效率,降低消耗;二是更加重视资源的科学开发;三是通过协调销售策争取最大经济利益;四是加强短缺资源的战略储备;五是寻找新的替代产品。
世界主要矿物资源的储备和开采情况摘要(供参考)一、锑锑在地壳中的自然储量为390万吨,可开采储量180万吨。
2004年世界开采量为11.3万吨。
其中,中国开采100000吨,南非5300吨,玻利维亚3000吨,塔吉克2000吨。
二、砷砷在地壳中的可开采储量约125万吨。
2004年世界开采量为49500吨。
其中,中国开采30000吨,智利8000吨,贝鲁3500吨,墨西哥1800吨,哈萨克斯坦和俄罗斯1500吨。
三、铍铍在地壳中的可开采储量不详。
2004年世界开采量为114吨。
其中,美国开采90吨,中国20吨,莫桑比克3吨,哈萨克斯坦1吨。
四、铋铋在地壳中的自然储量为68万吨,可开采储量33万吨。
2004年世界开采量为5100吨。
其中,中国开采2500吨,墨西哥1100吨,贝鲁1000吨,哈萨克斯坦150吨,加拿大145吨。
五、铯铯在地壳中的自然储量为11万吨,可开采储量至少7万吨。
2005年世界铯开采量几十吨,其中,75%在加拿大开采。
六、锡锡在地壳中的自然储量为1100万吨,可开采储量610万吨。
2004年,世界开采锡209755吨,其中,中国开采110000吨,印度尼西亚66000吨,贝鲁42000吨,玻利维亚16800吨,巴西12200吨。
七、钾钾是地壳中常见的矿物。
八、铝铝矾土在地壳中的自然储量为320亿吨,可开采储量250亿吨。
2004年,世界铝矾土开采量为1.59亿吨,其中,澳大利亚开采5660万吨,巴西1850万吨,几内亚1600万吨,中国1500万吨,牙买加1330万吨。