14-9 A Chi-Square Test for Goodness of Fit
- 格式:ppt
- 大小:126.50 KB
- 文档页数:14
χ2检验一、概述χ2检验(chi-square test )既可用于推断某个变量是否服从某种特定分布的拟合优度检验(goodness of fit test ),也可用于推断两个离散型变量是否存在依从关系的独立性检验(test of independence )或推断几次重复试验的结果是否相同的同质性检验(test of homogeneity )。
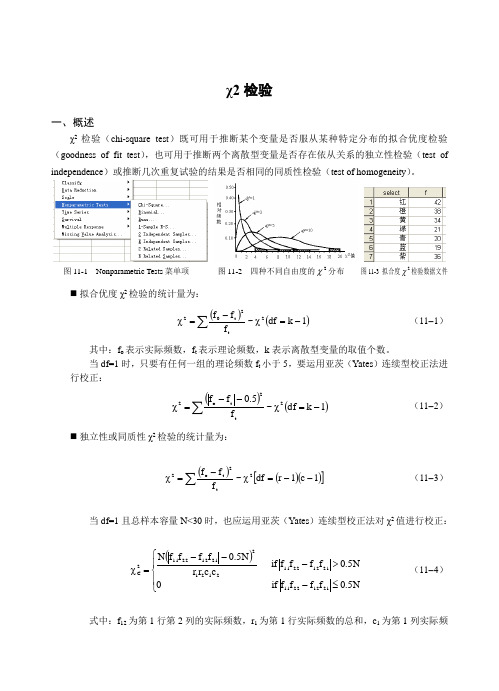
图11-1 Nonparametric Tests 菜单项 图11-2 四种不同自由度的2χ分布 图11-3 拟合度2χ检验数据文件⏹ 拟合优度χ2检验的统计量为:()()1k df ~f f f 2t2t 02-=χ-=χ∑(11-1)其中:f o 表示实际频数,f t 表示理论频数,k 表示离散型变量的取值个数。
当df=1时,只要有任何一组的理论频数f t 小于5,要运用亚茨(Yates )连续型校正法进行校正:()()1k df ~f 5.0f f2t2t o2-=χ--=χ∑(11-2)⏹ 独立性或同质性χ2检验的统计量为:()()()[]1c 1r df ~f f f 2t2t o 2--=χ-=χ∑(11-3)当df=1且总样本容量N<30时,也应运用亚茨(Yates )连续型校正法对χ2值进行校正:()⎪⎩⎪⎨⎧≤->---=χN5.0f f f f if 0N 5.0f f f f if c c r r N 5.0f f f f N 211222112112221121212211222112C (11-4)式中:f 12为第1行第2列的实际频数,r 1为第1行实际频数的总和,c 1为第1列实际频第十一章非参数检验151数的总和,其余类推。
因此,χ2值大于等于0,其大小随实际频数与理论频数之差的变化而变化。
二者之差越小,χ2值也越小,说明样本分布与假设的理论分布越一致;二者之差越大,χ2值也越大,说明样本分布与假设的理论分布越不一致。

数学专业词汇及翻译一、字母顺序表 (1)二、常用的数学英语表述 (7)三、代数英语(高端) (13)一、字母顺序表1、数学专业词汇Aabsolute value 绝对值 accept 接受 acceptable region 接受域additivity 可加性 adjusted 调整的 alternative hypothesis 对立假设analysis 分析analysis of covariance 协方差分析analysis of variance 方差分析 arithmetic mean 算术平均值 association 相关性assumption 假设 assumption checking 假设检验availability 有效度average 均值Bbalanced 平衡的 band 带宽 bar chart 条形图beta-distribution 贝塔分布 between groups 组间的 bias 偏倚 binomial distribution 二项分布 binomial test 二项检验Ccalculate 计算 case 个案 category 类别 center of gravity 重心central tendency 中心趋势chi-square distribution 卡方分布chi-square test 卡方检验classify 分类cluster analysis 聚类分析coefficient 系数 coefficient of correlation 相关系数collinearity 共线性 column 列 compare 比较 comparison 对照 components 构成,分量compound 复合的 confidence interval 置信区间 consistency 一致性 constant 常数continuous variable 连续变量 control charts 控制图 correlation 相关 covariance 协方差 covariance matrix 协方差矩阵critical point 临界点critical value 临界值crosstab 列联表cubic 三次的,立方的cubic term 三次项cumulative distribution function 累加分布函数 curve estimation 曲线估计Ddata 数据default 默认的definition 定义deleted residual 剔除残差density function 密度函数dependent variable 因变量description 描述design of experiment 试验设计deviations 差异df.(degree of freedom) 自由度diagnostic 诊断dimension 维discrete variable 离散变量discriminant function 判别函数discriminatory analysis 判别分析distance 距离distribution 分布D-optimal design D-优化设计Eeaqual 相等 effects of interaction 交互效应 efficiency 有效性eigenvalue 特征值equal size 等含量equation 方程error 误差estimate 估计estimation of parameters 参数估计estimations 估计量evaluate 衡量exact value 精确值expectation 期望expected value 期望值exponential 指数的exponential distributon 指数分布extreme value 极值F factor 因素,因子 factor analysis 因子分析 factor score 因子得分 factorial designs 析因设计factorial experiment 析因试验fit 拟合fitted line 拟合线fitted value 拟合值 fixed model 固定模型 fixed variable 固定变量fractional factorial design 部分析因设计frequency 频数F-test F检验full factorial design 完全析因设计function 函数Ggamma distribution 伽玛分布geometric mean 几何均值group 组Hharmomic mean 调和均值 heterogeneity 不齐性histogram 直方图homogeneity 齐性homogeneity of variance 方差齐性hypothesis 假设 hypothesis test 假设检验Iindependence 独立independent variable 自变量independent-samples 独立样本 index 指数 index of correlation 相关指数 interaction 交互作用 interclass correlation 组内相关 interval estimate 区间估计intraclass correlation 组间相关inverse 倒数的iterate 迭代Kkernal 核 Kolmogorov-Smirnov test柯尔莫哥洛夫-斯米诺夫检验 kurtosis 峰度Llarge sample problem 大样本问题layer 层least-significant difference 最小显著差数least-square estimation 最小二乘估计least-square method 最小二乘法 level 水平 level of significance 显著性水平leverage value 中心化杠杆值life 寿命life test 寿命试验likelihood function 似然函数 likelihood ratio test 似然比检验linear 线性的linear estimator 线性估计linear model 线性模型linear regression 线性回归linear relation 线性关系linear term 线性项logarithmic 对数的logarithms 对数 logistic 逻辑的 lost function 损失函数Mmain effect 主效应matrix 矩阵maximum 最大值maximum likelihood estimation 极大似然估计 mean squared deviation(MSD) 均方差 mean sum of square 均方和 measure 衡量 media 中位数 M-estimator M估计minimum 最小值missing values 缺失值mixed model 混合模型 mode 众数model 模型Monte Carle method 蒙特卡罗法moving average 移动平均值multicollinearity 多元共线性multiple comparison 多重比较multiple correlation 多重相关multiple correlation coefficient 复相关系数multiple correlation coefficient 多元相关系数multiple regression analysis 多元回归分析multiple regression equation 多元回归方程 multiple response 多响应 multivariate analysis 多元分析Nnegative relationship 负相关nonadditively 不可加性nonlinear 非线性nonlinear regression 非线性回归noparametric tests 非参数检验 normal distribution 正态分布null hypothesis 零假设 number of cases 个案数Oone-sample 单样本 one-tailed test 单侧检验 one-way ANOVA 单向方差分析one-way classification 单向分类optimal 优化的optimum allocation 最优配制 order 排序order statistics 次序统计量 origin 原点orthogonal 正交的 outliers 异常值Ppaired observations 成对观测数据paired-sample 成对样本parameter 参数parameter estimation 参数估计 partial correlation 偏相关partial correlation coefficient 偏相关系数 partial regression coefficient 偏回归系数percent 百分数percentiles 百分位数pie chart 饼图point estimate 点估计poisson distribution 泊松分布polynomial curve 多项式曲线polynomial regression 多项式回归polynomials 多项式positive relationship 正相关 power 幂P-P plot P-P概率图predict 预测predicted value 预测值prediction intervals 预测区间principal component analysis 主成分分析 proability 概率probability density function 概率密度函数 probit analysis 概率分析proportion 比例Qqadratic 二次的 Q-Q plot Q-Q概率图 quadratic term 二次项quality control 质量控制 quantitative 数量的,度量的 quartiles 四分位数Rrandom 随机的 random number 随机数 random number 随机数random sampling 随机取样random seed 随机数种子random variable 随机变量 randomization 随机化 range 极差rank 秩 rank correlation 秩相关 rank statistic 秩统计量 regression analysis 回归分析regression coefficient 回归系数regression line 回归线reject 拒绝rejection region 拒绝域relationship 关系reliability 可*性repeated 重复的report 报告,报表 residual 残差 residual sum of squares 剩余平方和response 响应risk function 风险函数robustness 稳健性 root mean square 标准差 row 行 run 游程run test 游程检验Sample 样本sample size 样本容量sample space 样本空间sampling 取样 sampling inspection 抽样检验 scatter chart 散点图S-curve S形曲线separately 单独地sets 集合sign test 符号检验significance 显著性significance level 显著性水平significance testing 显著性检验 significant 显著的,有效的 significant digits 有效数字 skewed distribution 偏态分布 skewness 偏度 small sample problem 小样本问题 smooth 平滑 sort 排序 soruces of variation 方差来源 space 空间 spread 扩展square 平方 standard deviation 标准离差 standard error of mean 均值的标准误差standardization 标准化 standardize 标准化 statistic 统计量 statistical quality control 统计质量控制 std. residual 标准残差 stepwise regression analysis 逐步回归stimulus 刺激strong assumption 强假设stud. deleted residual 学生化剔除残差stud. residual 学生化残差 subsamples 次级样本 sufficient statistic 充分统计量sum 和 sum of squares 平方和 summary 概括,综述Ttable 表t-distribution t分布test 检验test criterion 检验判据test for linearity 线性检验 test of goodness of fit 拟合优度检验 test of homogeneity 齐性检验test of independence 独立性检验test rules 检验法则 test statistics 检验统计量 testing function 检验函数time series 时间序列tolerance limits 容许限total 总共,和transformation 转换 treatment 处理 trimmed mean 截尾均值 true value 真值 t-test t检验 two-tailed test 双侧检验unbalanced 不平衡的unbiased estimation 无偏估计unbiasedness 无偏性 uniform distribution 均匀分布Vvalue of estimator 估计值 variable 变量 variance 方差 variance components 方差分量 variance ratio 方差比 various 不同的 vector 向量Wweight 加权,权重weighted average 加权平均值within groups 组内的ZZ score Z分数2. 最优化方法词汇英汉对照表Aactive constraint 活动约束 active set method 活动集法 analytic gradient 解析梯度approximate 近似 arbitrary 强制性的 argument 变量 attainment factor 达到因子Bbandwidth 带宽be equivalent to 等价于best-fit 最佳拟合bound 边界Ccoefficient 系数complex-value 复数值component 分量constant 常数constrained 有约束的constraint 约束constraint function 约束函数continuous 连续的converge 收敛cubic polynomial interpolation method三次多项式插值法 curve-fitting 曲线拟合Ddata-fitting 数据拟合default 默认的,默认的define 定义diagonal 对角的direct search method 直接搜索法direction of search 搜索方向 discontinuous 不连续eigenvalue 特征值empty matrix 空矩阵equality 等式exceeded 溢出的Ffeasible 可行的 feasible solution 可行解 finite-difference 有限差分 first-order 一阶GGauss-Newton method 高斯-牛顿法 goal attainment problem 目标达到问题 gradient 梯度 gradient method 梯度法Hhandle 句柄 Hessian matrix 海色矩阵Independent variables 独立变量inequality 不等式infeasibility 不可行性infeasible 不可行的initial feasible solution 初始可行解initialize 初始化inverse 逆 invoke 激活 iteration 迭代 iteration 迭代JJacobian 雅可比矩阵LLagrange multiplier 拉格朗日乘子large-scale 大型的least square 最小二乘 least squares sense 最小二乘意义上的 Levenberg-Marquardt method 列文伯格-马夸尔特法line search 一维搜索linear 线性的linear equality constraints 线性等式约束linear programming problem 线性规划问题 local solution 局部解M medium-scale 中型的minimize 最小化mixed quadratic and cubic polynomialinterpolation and extrapolation method 混合二次、三次多项式内插、外插法multiobjective 多目标的Nnonlinear 非线性的 norm 范数Oobjective function 目标函数observed data 测量数据optimization routine 优化过程optimize 优化optimizer 求解器over-determined system 超定系统Pparameter 参数partial derivatives 偏导数polynomial interpolation method 多项式插值法Qquadratic 二次的 quadratic interpolation method 二次内插法quadratic programming 二次规划Rreal-value 实数值 residuals 残差 robust 稳健的 robustness 稳健性,鲁棒性S scalar 标量semi-infinitely problem 半无限问题Sequential Quadratic Programming method 序列二次规划法 simplex search method 单纯形法solution 解sparse matrix 稀疏矩阵sparsity pattern 稀疏模式 sparsity structure 稀疏结构 starting point 初始点step length 步长subspace trust region method 子空间置信域法sum-of-squares 平方和 symmetric matrix 对称矩阵Ttermination message 终止信息 termination tolerance 终止容限 the exit condition 退出条件 the method of steepest descent 最速下降法 transpose 转置Uunconstrained 无约束的 under-determined system 负定系统Vvariable 变量 vector 矢量Wweighting matrix 加权矩阵3 样条词汇英汉对照表Aapproximation 逼近 array 数组 a spline in b-form/b-spline b 样条 a spline of polynomial piece /ppform spline 分段多项式样条Bbivariate spline function 二元样条函数 break/breaks 断点Ccoefficient/coefficients 系数cubic interpolation 三次插值/三次内插cubic polynomial 三次多项式 cubic smoothing spline 三次平滑样条 cubic spline 三次样条cubic spline interpolation 三次样条插值/三次样条内插 curve 曲线Ddegree of freedom 自由度 dimension 维数Eend conditions 约束条件input argument 输入参数interpolation 插值/内插 interval取值区间Kknot/knots 节点Lleast-squares approximation 最小二乘拟合Mmultiplicity 重次 multivariate function 多元函数Ooptional argument 可选参数 order 阶次 output argument 输出参数P point/points 数据点Rrational spline 有理样条 rounding error 舍入误差(相对误差)Sscalar 标量sequence 数列(数组)spline 样条spline approximation 样条逼近/样条拟合spline function 样条函数 spline curve 样条曲线spline interpolation 样条插值/样条内插spline surface 样条曲面 smoothing spline 平滑样条Ttolerance 允许精度Uunivariate function 一元函数Vvector 向量Wweight/weights 权重4 偏微分方程数值解词汇英汉对照表Aabsolute error 绝对误差 absolute tolerance 绝对容限 adaptive mesh 适应性网格Bboundary condition 边界条件Ccontour plot 等值线图 converge 收敛 coordinate 坐标系Ddecomposed 分解的 decomposed geometry matrix 分解几何矩阵diagonal matrix 对角矩阵Dirichlet boundary conditions Dirichlet边界条件Eeigenvalue 特征值elliptic 椭圆形的error estimate 误差估计exact solution 精确解Ggeneralized Neumann boundary condition 推广的Neumann 边界条件 geometry 几何形状geometry description matrix 几何描述矩阵 geometry matrix 几何矩阵 graphical user interface(GUI)图形用户界面Hhyperbolic 双曲线的Iinitial mesh 初始网格Jjiggle 微调LLagrange multipliers 拉格朗日乘子Laplace equation 拉普拉斯方程linear interpolation 线性插值 loop 循环Mmachine precision 机器精度 mixed boundary condition 混合边界条件NNeuman boundary condition Neuman边界条件 node point 节点 nonlinear solver 非线性求解器 normal vector 法向量PParabolic 抛物线型的 partial differential equation 偏微分方程plane strain 平面应变 plane stress 平面应力 Poisson's equation 泊松方程 polygon 多边形 positive definite 正定Qquality 质量Rrefined triangular mesh 加密的三角形网格relative tolerance 相对容限 relative tolerance 相对容限 residual 残差 residual norm 残差范数Ssingular 奇异的二、常用的数学英语表述1.Logicthere existfor allp?q p implies q / if p, then qp?q p if and only if q /p is equivalent to q / p and q are equivalent2.Setsx∈A x belongs to A / x is an element (or a member) of Ax?A x does not belong to A / x is not an element (or a member) of AA?B A is contained in B / A is a subset of BA?B A contains B / B is a subset of AA∩B A cap B / A meet B / A intersection BA∪B A cup B / A join B / A union BA\B A minus B / the diference between A and BA×B A cross B / the cartesian product of A and B3. Real numbersx+1 x plus onex-1 x minus onex±1 x plus or minus onexy xy / x multiplied by y(x - y)(x + y) x minus y, x plus yx y x over y= the equals signx = 5 x equals 5 / x is equal to 5x≠5x (is) not equal to 5x≡y x is equivalent to (or identical with) yx ≡ y x is not equivalent to (or identical wit h) yx > y x is greater than yx≥y x is greater than or equal to yx < y x is less than yx≤y x is less than or equal to y0 < x < 1 zero is less than x is less than 10≤x≤1zero is less than or equal to x is less than or equal to 1 | x | mod x / modulus xx 2 x squared / x (raised) to the power 2x 3 x cubedx 4 x to the fourth / x to the power fourx n x to the nth / x to the power nx ?n x to the (power) minus nx (square) root x / the square root of xx 3 cube root (of) xx 4 fourth root (of) xx n nth root (of) x( x+y ) 2 x plus y all squared( x y ) 2 x over y all squaredn! n factorialx ^ x hatx ˉ x barx ?x tildex i xi / x subscript i / x suffix i / x sub i∑ i=1 n a i the sum from i equals one to n a i / the sum as i runs from 1 to n of the a i4. Linear algebra‖ x ‖the norm (or modulus) of xOA →OA / vector OAOA ˉ OA / the length of the segment OAA T A transpose / the transpose of AA ?1 A inverse / the inverse of A5. Functionsf( x ) fx / f of x / the function f of xf:S→T a function f from S to Tx→y x maps to y / x is sent (or mapped) to yf'( x ) f prime x / f dash x / the (first) derivative of f with respect to xf''( x ) f double-prime x / f double-dash x / the second derivative of f with r espect to xf'''( x ) triple-prime x / f triple-dash x / the third derivative of f with respect to xf (4) ( x ) f four x / the fourth derivative of f with respect to xf ? x 1the partial (derivative) of f with respect to x12 f ? x 1 2the second partial (derivative) of f with respect to x1∫ 0 ∞the i ntegral from zero to infinitylim?x→0 the limit as x approaches zerolim?x→0 + the limit as x approaches zero from abovelim?x→0 ?the limit as x approaches zero from belowlog e y log y to the base e / log to the base e of y / natural log (of) yln?y log y to the base e / log to the base e of y / natural log (of) y一般词汇数学mathematics, maths(BrE), math(AmE)公理axiom定理theorem计算calculation运算operation证明prove假设hypothesis, hypotheses(pl.)命题proposition算术arithmetic加plus(prep.), add(v.), addition(n.)被加数augend, summand加数addend和sum减minus(prep.), subtract(v.), subtraction(n.)被减数minuend减数subtrahend差remainder乘times(prep.), multiply(v.), multiplication(n.)被乘数multiplicand, faciend乘数multiplicator积product除divided by(prep.), divide(v.), division(n.)被除数dividend除数divisor商quotient等于equals, is equal to, is equivalent to 大于is greater than 小于is lesser than大于等于is equal or greater than小于等于is equal or lesser than运算符operator数字digit数number自然数natural number整数integer小数decimal小数点decimal point分数fraction分子numerator分母denominator比ratio正positive负negative零null, zero, nought, nil十进制decimal system二进制binary system十六进制hexadecimal system权weight, significance进位carry截尾truncation四舍五入round下舍入round down上舍入round up有效数字significant digit无效数字insignificant digit代数algebra公式formula, formulae(pl.)单项式monomial多项式polynomial, multinomial系数coefficient未知数unknown, x-factor, y-factor, z-factor 等式,方程式equation一次方程simple equation二次方程quadratic equation三次方程cubic equation四次方程quartic equation不等式inequation阶乘factorial对数logarithm指数,幂exponent乘方power二次方,平方square三次方,立方cube四次方the power of four, the fourth power n次方the power of n, the nth power开方evolution, extraction二次方根,平方根square root三次方根,立方根cube root四次方根the root of four, the fourth root n次方根the root of n, the nth root集合aggregate元素element空集void子集subset交集intersection并集union补集complement映射mapping函数function定义域domain, field of definition值域range常量constant变量variable单调性monotonicity奇偶性parity周期性periodicity图象image数列,级数series微积分calculus微分differential导数derivative极限limit无穷大infinite(a.) infinity(n.) 无穷小infinitesimal积分integral定积分definite integral不定积分indefinite integral 有理数rational number无理数irrational number实数real number虚数imaginary number复数complex number矩阵matrix行列式determinant几何geometry点point线line面plane体solid线段segment射线radial平行parallel相交intersect角angle角度degree弧度radian锐角acute angle直角right angle钝角obtuse angle平角straight angle周角perigon底base边side高height三角形triangle锐角三角形acute triangle直角三角形right triangle直角边leg斜边hypotenuse勾股定理Pythagorean theorem钝角三角形obtuse triangle不等边三角形scalene triangle等腰三角形isosceles triangle等边三角形equilateral triangle四边形quadrilateral平行四边形parallelogram矩形rectangle长length宽width附:在一个分数里,分子或分母或两者均含有分数。
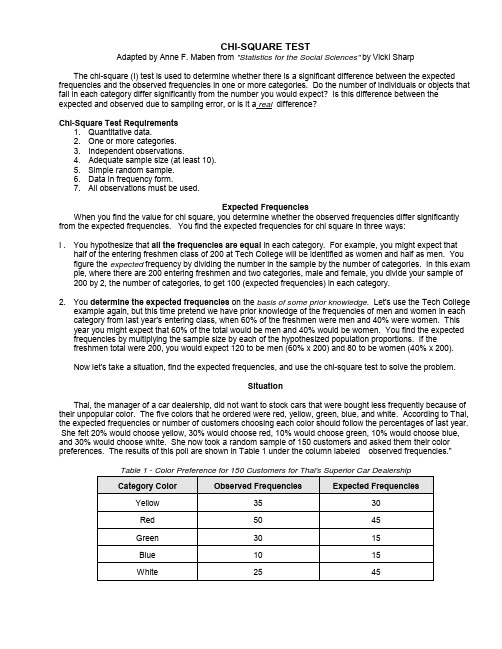
CHI-SQUARE TESTAdapted by Anne F. Maben from "Statistics for the Social Sciences" by Vicki SharpThe chi-square (I) test is used to determine whether there is a significant difference between the expected frequencies and the observed frequencies in one or more categories. Do the number of individuals or objects that fall in each category differ significantly from the number you would expect? Is this difference between the expected and observed due to sampling error, or is it a real difference?Chi-Square Test Requirements1. Quantitative data.2. One or more categories.3. Independent observations.4.Adequate sample size (at least 10).5. Simple random sample.6. Data in frequency form.7. All observations must be used.Expected FrequenciesWhen you find the value for chi square, you determine whether the observed frequencies differ significantly from the expected frequencies. You find the expected frequencies for chi square in three ways:I . You hypothesize that all the frequencies are equal in each category. For example, you might expect thathalf of the entering freshmen class of 200 at Tech College will be identified as women and half as men. You figure the expected frequency by dividing the number in the sample by the number of categories. In this exam pie, where there are 200 entering freshmen and two categories, male and female, you divide your sample of 200 by 2, the number of categories, to get 100 (expected frequencies) in each category.2. You determine the expected frequencies on the basis of some prior knowledge. Let's use the Tech Collegeexample again, but this time pretend we have prior knowledge of the frequencies of men and women in each category from last year's entering class, when 60% of the freshmen were men and 40% were women. This year you might expect that 60% of the total would be men and 40% would be women. You find the expected frequencies by multiplying the sample size by each of the hypothesized population proportions. If thefreshmen total were 200, you would expect 120 to be men (60% x 200) and 80 to be women (40% x 200).Now let's take a situation, find the expected frequencies, and use the chi-square test to solve the problem.SituationThai, the manager of a car dealership, did not want to stock cars that were bought less frequently because of their unpopular color. The five colors that he ordered were red, yellow, green, blue, and white. According to Thai, the expected frequencies or number of customers choosing each color should follow the percentages of last year. She felt 20% would choose yellow, 30% would choose red, 10% would choose green, 10% would choose blue, and 30% would choose white. She now took a random sample of 150 customers and asked them their color preferences. The results of this poll are shown in Table 1 under the column labeled observed frequencies."Table 1 - Color Preference for 150 Customers for Thai's Superior Car DealershipCategory Color Observed Frequencies Expected FrequenciesYellow 35 30Red 50 45Green 30 15Blue 10 15White 25 45The expected frequencies in Table 1 are figured from last year's percentages. Based on the percentages for last year, we would expect 20% to choose yellow. Figure the expected frequencies for yellow by taking 20% of the 150 customers, getting an expected frequency of 30 people for this category. For the color red we would expect 30% out of 150 or 45 people to fall in this category. Using this method, Thai figured out the expected frequencies 30, 45, 15, 15, and 45. Obviously, there are discrepancies between the colors preferred by customers in the poll taken by Thai and the colors preferred by the customers who bought their cars last year. Most striking is the difference in the green and white colors. If Thai were to follow the results of her poll, she would stock twice as many green cars than if she were to follow the customer color preference for green based on last year's sales. In the case of white cars, she would stock half as many this year. What to do??? Thai needs to know whether or not the discrepancies between last year's choices (expected frequencies) and this year's preferences on the basis of his poll (observed frequencies) demonstrate a real change in customer color preferences. It could be that the differences are simply a result of the random sample she chanced to select. If so, then the population of cus-tomers really has not changed from last year as far as color preferences go. The null hypothesis states that there is no significant difference between the expected and observed frequencies. The alternative hypothesis states they are different. The level of significance (the point at which you can say with 95% confidence that the difference is NOT due to chance alone) is set at .05 (the standard for most science experiments.) The chi-square formula used on these data isX2 = (O - E)2where O is the Observed Frequency in each categoryE E is the Expected Frequency in the corresponding categoryis sum ofdf is the "degree of freedom" (n-1)X2 is Chi SquarePROCEDUREWe are now ready to use our formula for X2 and find out if there is a significant difference between the observed and expected frequencies for the customers in choosing cars. We will set up a worksheet; then you will follow the directions to form the columns and solve the formula.1. Directions for Setting Up Worksheet for Chi SquareCategory O E(O - E)(O - E)2(O - E)2Eyellow 35 30 5 25 0.83red 50 45 5 25 0.56green 30 15 15 225 15blue 10 15 -5 25 1.67white 25 45 -20 400 8.89X2 = 26.952. After calculating the Chi Square value, find the "Degrees of Freedom." (DO NOT SQUARE THE NUMBERYOU GET, NOR FIND THE SQUARE ROOT - THE NUMBER YOU GET FROM COMPLETING THECALCULATIONS AS ABOVE IS CHI SQUARE.)Degrees of freedom (df) refers to the number of values that are free to vary after restriction has been placed on the data. For instance, if you have four numbers with the restriction that their sum has to be 50, then three of these numbers can be anything, they are free to vary, but the fourth number definitely isrestricted. For example, the first three numbers could be 15, 20, and 5, adding up to 40; then the fourth number has to be 10 in order that they sum to 50. The degrees of freedom for these values are then three.The degrees of freedom here is defined as N - 1, the number in the group minus one restriction (4 - I ).3. Find the table value for Chi Square. Begin by finding the df found in step 2 along the left hand side of thetable. Run your fingers across the proper row until you reach the predetermined level of significance (.05) atthe column heading on the top of the table. The table value for Chi Square in the correct box of 4 df and P=.05 level of significance is 9.49.4. If the calculated chi-square value for the set of data you are analyzing (26.95) is equal to or greater than thetable value (9.49 ), reject the null hypothesis. There IS a significant difference between the data sets that cannot be due to chance alone. If the number you calculate is LESS than the number you find on the table, than you can probably say that any differences are due to chance alone.In this situation, the rejection of the null hypothesis means that the differences between the expected frequencies (based upon last year's car sales) and the observed frequencies (based upon this year's poll taken by Thai) are not due to chance. That is, they are not due to chance variation in the sample Thai took;there is a real difference between them. Therefore, in deciding what color autos to stock, it would be to Thai's advantage to pay careful attention to the results of her poll!The steps in using the chi-square test may be summarized as follows:Chi-Square I. Write the observed frequencies in column OTest Summary 2. Figure the expected frequencies and write them in column E.3. Use the formula to find the chi-square value:4. Find the df. (N-1)5. Find the table value (consult the Chi Square Table.)6. If your chi-square value is equal to or greater than the table value, reject the nullhypothesis: differences in your data are not due to chance aloneFor example, the reason observed frequencies in a fruit fly genetic breeding lab did not match expected frequencies could be due to such influences as:•Mate selection (certain flies may prefer certain mates)•Too small of a sample size was used•Incorrect identification of male or female flies•The wrong genetic cross was sent from the lab•The flies were mixed in the bottle (carrying unexpected alleles)。

Package‘EMT’February6,2023Type PackageTitle Exact Multinomial Test:Goodness-of-Fit Test for DiscreteMultivariate DataVersion1.3Date2023-02-06Author Uwe MenzelMaintainer Uwe Menzel<*******************>Description Goodness-of-fit tests for discrete multivariate data.It istested if a given observation is likely to have occurred underthe assumption of an ab-initio model.Monte Carlo methods are provided tomake the package capable of solving high-dimensional problems.License GPLLazyLoad yesRepository CRANDate/Publication2023-02-0622:32:31UTCNeedsCompilation noR topics documented:EMT-package (2)EMT-internal (2)multinomial.test (3)plotMultinom (6)Index712EMT-internalEMT-package Exact Multinomial Test:Goodness-of-Fit Test for Discrete Multivari-ate DataDescriptionThe package provides functions to carry out a Goodness-of-fit test for discrete multivariate data.It is tested if a given observation is likely to have occurred under the assumption of an ab-initio model.A p-value can be calculated using different distance measures between observed and ex-pected frequencies.A Monte Carlo method is provided to make the package capable of solving high-dimensional problems.The main user functions are multinomial.test and plotMultinom.DetailsPackage:CCPType:PackageVersion: 1.3Date:2013-02-06License:GPLAuthor(s)Uwe MenzelMaintainer:Uwe Menzel<*******************>EMT-internal Internal functions for the EMT packageDescriptionInternal functions for the EMT packageUsageExactMultinomialTest(observed,prob,size,groups,numEvents)ExactMultinomialTestChisquare(observed,prob,size,groups,numEvents)MonteCarloMultinomialTest(observed,prob,size,groups,numEvents,ntrial,atOnce)MonteCarloMultinomialTestChisquare(observed,prob,size,groups,numEvents,ntrial,atOnce)chisqStat(observed,expected)findVectors(groups,size)Argumentsobserved vector describing the observation:contains the observed numbers of items in each category.prob vector describing the model:contains the hypothetical probabilities correspond-ing to each category.expected vector containing the expected numbers of items in each category under the assumption that the model is valid.size sample size,sum of the components of the vector observed.groups number of categories in the experiment.numEvents number of possible outcomes of the experiment.ntrial number of simulated samples in the Monte Carlo approach.atOnce a parameter of more technical nature.Determines how much memory is used for big arrays.DetailsThese functions are not intended to be called by the user.multinomial.test Exact Multinomial Test:Goodness-of-Fit Test for Discrete Multivari-ate DataDescriptionGoodness-of-fit tests for discrete multivariate data.It is tested if a given observation is likely to have occurred under the assumption of an ab-initio model.Monte Carlo methods are provided to make the function capable of solving high-dimensional problems.Usagemultinomial.test(observed,prob,useChisq=FALSE,MonteCarlo=FALSE,ntrial=1e6,atOnce=1e6)Argumentsobserved vector describing the observation:contains the observed numbers of items in each category.prob vector describing the model:contains the hypothetical probabilities correspond-ing to each category.useChisq if TRUE,Pearson’s chisquare is used as a distance measure between observed and expected frequencies.MonteCarlo if TRUE,a Monte Carlo approach is used.ntrial number of simulated samples in the Monte Carlo approach.atOnce a parameter of more technical nature.Determines how much memory is used for big arrays.DetailsThe Exact Multinomial Test is a Goodness-of-fit test for discrete multivariate data.It is tested ifa given observation is likely to have occurred under the assumption of an ab-initio model.In theexperimental setup belonging to the test,n items fall into k categories with certain probabilities (sample size n with k categories).The observation,described by the vector observed,indicates how many items have been observed in each category.The model,determined by the vector prob, assigns to each category the hypothetical probability that an item falls into it.Now,if the obser-vation is unlikely to have occurred under the assumption of the model,it is advisible to regard the model as not valid.The p-value estimates how likely the observation is,given the model.In particular,low p-values suggest that the model is not valid.The default approach used by multinomial.test obtains the p-values by calculating the exact probabilities of all possible out-comes given n and k,using the multinomial probability distribution function dmultinom provided by R.Then,by default,the p-value is obtained by summing the probabilities of all outcomes which are less likely than the observed outcome(or equally likely as the observed outcome),i.e.by summing all p(i)<=p(observed)(distance measure based on probabilities).Alternatively,the p-value can be obtained by summing the probabilities of all outcomes connected with a chisquare no smaller than the chisquare connected with the actual observation(distance measure based on chisquare).The latter is triggered by setting useChisq=TRUE.Having a sample of size n in an experiment with k categories,the number of distinct possible outcomes is the binomial coefficient choose(n+k-1,k-1).This number grows rapidly with increasing parameters n and k.If the param-eters grow too big,numerical calculation might fail because of time or memory limitations.In this case,usage of a Monte Carlo approach provided by multinomial.test is suggested.A Monte Carlo approach,activated by setting MonteCarlo=TRUE,simulates withdrawal of ntrial samples of size n from the hypothetical distribution specified by the vector prob.The default value for ntrial is100000but might be incremented for big n and k.The advantage of the Monte Carlo approach is that memory requirements and running time are essentially determined by ntrial but not by n or k.By default,the p-value is then obtained by summing the relative frequencies of occurrence of unusual outcomes,i.e.of outcomes occurring less frequently than the observed one(or equally frequent as the observed one).Alternatively,as above,Pearson’s chisquare can be used as a dis-tance measure by setting useChisq=TRUE.The parameter atOnce is of more technical nature,witha default value of1000000.This value should be decremented for computers with low memoryto avoid overflow,and can be incremented for large-CPU computers to speed up calculations.The parameter is only effective for Monte Carlo calculations.Valueid textual description of the method used.size sample size n,equals the sum of the components of the vector observed.groups number of categories k in the experiment,equals the number of components of the vector observed.numEvents number of different events for the model considered.stat textual description of the distance measure used.allProb vector containing the probabilities(rel.frequencies for the Monte Carlo ap-proach)of all possible outcomes(might be huge for big n and k).criticalValue the critical value of the hypothesis test.ntrial number of trials if the Monte Carlo approach was used,NULL otherwise.p.value the calculated p-value rounded to four significant digits.NoteFor two categories(k=2),the test is called Exact Binomial Test.Author(s)Uwe Menzel<*******************>ReferencesH.Bayo Lawal(2003)Categorical data analysis with SAS and SPSS applications,V olume1,Chap-ter3ISBN:978-0-8058-4605-8Read,T.R.C.and Cressie,N.A.C.(1988).Goodness-of-fit statistics for discrete multivariate data.Springer,New York.See AlsoThe Multinomial Distribution:dmultinomExamples##Load the EMT package:library(EMT)##Input data for a three-dimensional case:observed<-c(5,2,1)prob<-c(0.25,0.5,0.25)##Calculate p-value using default options:out<-multinomial.test(observed,prob)#p.value=0.0767##Plot the probabilities for each event:plotMultinom(out)##Calculate p-value for the same input using Pearson s chisquare:out<-multinomial.test(observed,prob,useChisq=TRUE)#p.value=0.0596;not the same!##Test the hypothesis that all sides of a dice have the same probabilities:prob<-rep(1/6,6)observed<-c(4,5,2,7,0,1)out<-multinomial.test(observed,prob)#p.value=0.0357->better get another dice!#the same problem using a Monte Carlo approach:##Not run:out<-multinomial.test(observed,prob,MonteCarlo=TRUE,ntrial=5e+6)##End(Not run)6plotMultinom plotMultinom Plot the Probability distribution fot the Exact Multinomial TestDescriptionThis function takes the results of multinomial.test as input and plots the calculated probability distribution.UsageplotMultinom(listMultinom)ArgumentslistMultinom a list created by running the function multinomial.test.DetailsThe function plotMultinom displays a barplot of the probabilities for the individual events.The probabilities are shown in descending order from the left to the right.Events contributing to the p-value are marked red.Plots are only made if the number of different events is lower than or equal to100and for low number of trials in Monte Carlo simulations.ValueThefirst argument(listMultinom)is returned without modification.Author(s)Uwe Menzel<*******************>See AlsoThe Multinomial Distribution:multinomial.testExamples##Load the EMT package:library(EMT)##input and calculation of p-values:observed<-c(5,2,1)prob<-c(0.25,0.5,0.25)out<-multinomial.test(observed,prob)#p.value=0.0767##Plot the probability distribution:plotMultinom(out)Index∗htestEMT-package,2multinomial.test,3plotMultinom,6∗multivariateEMT-package,2multinomial.test,3plotMultinom,6chisqStat(EMT-internal),2dmultinom,4,5EMT(EMT-package),2EMT-internal,2EMT-package,2ExactMultinomialTest(EMT-internal),2 ExactMultinomialTestChisquare(EMT-internal),2findVectors(EMT-internal),2 MonteCarloMultinomialTest(EMT-internal),2 MonteCarloMultinomialTestChisquare(EMT-internal),2multinomial.test,3,6plotMultinom,67。

概念解释:卡方检验(chi-square test)是一种用于比较观察值与期望值之间差异的统计方法。
它适用于分类数据的分析,可以帮助确定观察到的数据分布是否符合预期的理论分布。
卡方检验通常用于分析两个或多个分类变量之间的关系,例如性别和职业的关联性、不同教育水平对政治立场的影响等。
让我们来深入理解卡方检验的概念和原理。
卡方检验的基本原理是通过比较观察值和期望值之间的差异来判断两个或多个分类变量之间是否存在关联性。
在进行卡方检验之前,我们首先需要建立一个原假设,即假设观察到的数据分布与理论分布相符。
通过一系列计算和统计方法,我们可以得出卡方值,并以此来判断观察值与期望值之间的差异程度。
如果卡方值远大于预期值,我们就可以拒绝原假设,从而得出两个或多个分类变量之间存在显著关联的结论。
接下来,让我们从简单的示例开始,来看一下卡方检验的具体应用。
假设我们想要研究不同职业对投票倾向的影响,我们可以通过卡方检验来判断职业与政治立场之间是否存在关联。
我们收集了一份包括职业和政治立场的调查数据,然后我们可以利用卡方检验来分析这些数据,以确定职业与政治立场之间的关联性。
在分析完具体示例之后,让我们进一步探讨卡方检验的应用范围和局限性。
卡方检验适用于分类数据的分析,可以帮助我们判断不同变量之间是否存在关联性。
然而,卡方检验也有一定的局限性,例如对样本量和数据分布的要求比较严格,同时需要注意变量之间的独立性等。
在应用卡方检验时,我们需要综合考虑数据的特点和实际情况,以确保分析结果的准确性和可靠性。
总结回顾:通过本文的讨论,我们对卡方检验的概念和原理有了深入的理解。
我们了解到卡方检验是一种用于比较观察值和期望值之间差异的统计方法,适用于分类数据的分析。
在具体应用中,我们可以通过卡方检验来判断不同变量之间是否存在关联性,从而深入了解数据的特点和规律。
我们也意识到卡方检验在应用时需要注意一些局限性,需要综合考虑实际情况和数据特点。

中学生标准学术能力诊断性测试2023 年9 月测试英语试卷本试卷共150 分,考试时间100 分钟。
第一部分阅读理解(共两节,满分60 分)第一节(共15 小题;每小题 3 分,满分45 分)阅读下列短文,从每题所给的A、B、C 和D 四个选项中,选出最佳选项,并在答题卡上将该项涂黑。
AHello, everyone. Welcome to our school. Now let’s take a look at some interesting school publications.ColumbusIt is our literary magazine; the name shows the place where we live. Editorial training includes developing skills for critical evaluation of student creative writing. Published twice yearly, many student contributors are also recognized as Scholastic Writing Awards winners.DiversionIt is our language publication. Published annually, it features student work presented in Mandarin, French, and Spanish. Working with advisors who teach these languages, student editors help in presentin g their classmates’ work including poems, essays, short stories, comic strips(连环画)and art. Diversion is often used by our language teachers in the classroom as well.The BrunerIt is Trinity’s yearbook. Serving the entire school, it is a yearly testament(证明)to the many aspects of Trinity life. Editorial positions are named in May, allowing editors to attend a two-day summer conference at NYU. This conference allows students to develop their capability to acquire knowledge before the start of the school year. Work on the yearbook begins immediately thereafter, as students work to create an impressive K-12 publication.The Trinity TimesIt is the upper school newspaper, written, edited, photographed and produced entirely by students as an extracurricular activity. Current sections of the paper include Arts and Innovation, Trinity Life, NY Culture, Science, Opinion and Editorial, and Sports. The editorial policy is generally determined by the editorial staff and their faculty advisor.How often does Diversion come outA.Once a month. B.Once a year. C.Twice a month. D.Twice a year. What is the purpose of the summer conference at NYU?A.To make editorial policy.To present students’ poems and essays.To cultivate students’ ability gain knowledge.To develop student s’ skills for critical evaluation.Which publication are students responsible for A.Columbus. B.Diversion. C.The Bruner. D.The Trinity Times. BWhen my daughter was seven years old, she came home from soccer practice clearly downhearted. When pressed, she told me what a teammate said: Her teeth were too yellow. My heart broke for her. As parents, we strive to keep our children safe, but we can’t always be there to protect our kids from unkind words. I tried to comfort my daughter. I told her that she has a beautiful smile with nice, strong, healthy teeth. I explained why she shouldn’t let someone else’s criticisms define her. On the inside, though, I worried. From my youth, I’ve struggled with the concept that my self-worth was directly related to my physical appearance. The idea began when I was eight years old, with small, hurtful words, and grew into a beast that I still battle even today.When I became a mom, I was terrified that this concept would take root in my daughter. I wanted to protect her little ears from harsh words that might influence her idea of self-worth. I wanted to shield her little eyes from unrealistic beauty standards promoted by magazines, television, and movies. I wanted to guard her little heart from being broken by the notion that s he didn’t measure up insome way.On social media, the battle became exceptionally greater. Every day we are bombarded with people living their “best life”, all told through filters which only highlight the “best” parts: Best angles, best locations, best outfits, and best hair. Rarely do we get a glimpse of reality. On social media, outer beauty controls everything.How, then, can we teach our kids that they are much more than their appearance We can start by modeling kindness, empathy, and self-acceptance in our own lives. Kids are incredible mimics(模仿者), so be mindful of what you say, even when you think your kids aren’t listening. If we are constantly putting ourselves down, our kids will follow suit. Instead, adopt a positive attitude when it comes to your own self- worth. Additionally, strive to teach your children to see the inner beauty in themselves and in others. There’s beauty in strength, goodness, gentleness, perseverance, and kindness. Praise kids for their acts of kindness, like sharing with a friend or helping a family member without being asked, and talk to them about how it makes them feel.How did the author react to her daughter’s trouble(AThrilled.B.Apologetic. C.Sorrowful. D.Curious.) (A.Cure.B.Fix.C.Broaden. DProtect.)What does the underlined word probably mean in paragraph 2 6.What can be inferred from paragraph 3A.People like to share their privacy in social media. B.Everything in social media is not true.Social media reflects an unrealistic world.People attach more importance to their physical appearance. What should parents do to their kidsTell them to behave themselves.Praise their kids for their appearance.Set a positive example for their kids.Encourage their kids to ignore the outer beauty.CPeople hate mosquitoes due to their blood-sucking tendencies. Scientists, too, are troubled by mosquitoes and have been researching ways to keep them away. A team of researchers from Virginia Tech in the US looked into different kinds of soap. They invited volunteers to test how four different soap flavors attract mosquitoes.After analyzing the mosquitoes’ behavior, the researchers discovered several chemicals in the soap that can influence themosquitoes’ “choice of food”. Two chemicals, one with the smell of coconut and the other with the scent of flowers, can keep the insects away.The team also found that what matters to mosquitoes is not just the chemicals, but rather the combination of chemicals with each person’s smell. For example, people who attract mosqui toes can be more attractive to them after using one type of soap. They can also repel(驱除)mosquitoes by using another kind of soap. The findings were “remarkable”, said senior author Clement Vinauger in a news release, adding that he would choose a coconut-scented soap to keep mosquitoes away.How these insects manage to find humans has also made scientists curious. According to a new study published in Current Biology, researchers built a “canteen” for hundreds of mosquitoes. In the 20-by-20- meter facility, there were six pads that had the smell of different humans. The pads were heated to mimic sleeping humans. They found that the insects can track scents up to 60 meters. Also, mosquitoes are most attracted to a kind of chemical called carboxylic acid(羧酸), which is usually produced by bacteria on human skin. The smell of one participant wasn’t attractive to the insects, and researchers believed it was due to the person’s diet, which is a mainly plant-based food.By analyzing the chemicals that either attract or repel mosquitoes, scientists are able to improve mosquito repellent(驱蚊剂). With more studies, scientists believe changing a person’s diet could one day make them “mosquito-proof”. This is especially beneficial for regions where mosquitoes carry diseases, such as malaria, CNN reported.What did the researchers from Virginia Tech try to find outHow many soap flavors attract mosquitoes.What soap scents can help avoid mosquitoes.Why mosquitoes prefer certain soap flavors.What kind of people attracts mosquitoes most.What kind of smell may help chase the mosquitoes away A.Human skin. B.Grass. C.Carboxylic acid. D.Coconut.What did scientists discover in their studiesA.People’s diet can account for mosquitoes’ bites. B.Mosquitoes are attracted by each per son’s smell.The scent of flowers is most appealing to mosquitoes.Using soap when washing is an effective way to keep mosquitoes away.What is the best title of the passageHow to Kill MosquitoesWhat Kind of Soap Is Most UsefulSoap Science Beats away Bug BitesUsing Soap Is of Great SignificanceDRoughly translated as “cuteness”, kawaii is one of the most frequently used Japanese words. In a broader sense, it describes the culture of celebrating all things adorable and treating fictional characters as the representation of positivity. The concept has spread through many aspects of modern life, including art, fashion, technology, and even food.Japan’s kawaii culture is believed to have begun in the 1970s when teenagers developed their own childlike handwriting. Given a variety of names, including marui ji (round writing), koneko ji (kitten writing), and burikko ji (fake-child writing), it features curvy, noodle-like lines next to hearts, stars, and cartoon faces. People believe that this new cute style allowed the youth of the time to express their individual characteristics. In 1974, Japanese stationery brand Sanrio launched its iconic character, Hello Kitty. The super-cute white cat— with no mouth and a pink bow — was first printed onto a coin purse. Almost 55 years later, Hello Kitty is recognized all over the world, has been placed on countless products, and even has her own themed bullet train. In 2008, Japan named Hello Kitty as theirofficial tourism ambassador, inviting the rest of the world to cel ebrate the country’s proud kawaii identity. Since Hello Kitty, many producers have developed cute characters who, although are fictional, have also become pop signs.Kawaii doesn’t just apply to fictional characters, it also materializes in real life as a fashionable subculture. In Japan, there are several styles that are based on the idea of kawaii. Lolita fashion, for example, finds inspiration from the Victorian and Rococo period and consists of rich details, including fine bows. Related to this style is Sweet Lolita, which includes outfits that are even more “feminine”. The trend also involves turning basic packed lunches —comprising rice, fish or meat, and vegetables —into adorable works of art. Kawaii’s influence has resulted in two distinct bento (便当)box styles: Kyaraben (character bento) or oekakiben (picture bento).”What can we learn about kawaii according to the first paragraphIt is the most frequently used Japanese word.It is applied to almost all walks of life.It stands for various Japanese cultures.Both positive and negative things are related to it.What do people think of the early childlike handwriting A.Funny. B.Lifelike. C.Conventional. D.Personalized.What happened in Japan after Hello Kitty came onto the marketIt promoted local tourism.Japan’s economy was boosted greatly.It enjoyed popularity both at home and abroad.Other cute characters are no equal to Hello Kitty.Why does the author mention Lolita fashionTo illustrate Kawaii has an effect on the fashion trend.To describe Japanese passion for fashion.To introduce a new style of fictional character.To prove it has become a popular sign.第二节(共 5 小题;每小题 3 分,满分15 分)根据短文内容,从短文后的选项中选出能填入空白处的最佳选项。
上海市建平中学2024-2025学年高三上学期9月月考英语试卷一、语法填空Directions: After reading the passage below, fill in the blanks to make the passage coherent and grammatically correct. For the blanks with a given word, fill in each blank with the proper form of the given word; for the other blanks, use one word that best fits each blank.The Trouble with FriendsOn a daily basis, I teach kids. 1 “kids”, I mean teens to college- age, sometimes mid -twenties. Kids talk a lot about their friends, but don’t usually talk about their families. Sometimes I’m taken completely by surprise when, months into our knowing each other, a student mentions 2 (have) a twin. I suppose hearing the constant chatter about friends has made me consider my own, and how hard it can be 3 (maintain) these bonds as an adult. Mostly, what I notice is that I lose more friends than I make.An obvious reason for that is marriage. Friends get married and their spouses become their 4 (close) friends. My husband is now the person I spend the most time with. I tell him everything because I trust him with my thoughts, 5 stupid they may be. I used to be the same way with friends, but when I tell friends something now, I must accept the possibility that they will tell their spouses, 6 I’m friendly but not friends. A friendship is truly strained when you don’t like the spouse. Sometimes this new person is so far removed from 7 you imagined for your friend that you wonder if you knew your friend at all.After marriage, a friend who used to discuss things with you stops doing so, and 8 (update) you only on definitive good news, never the bad, the ugly, or the in- progress. She saves all of that for her partner. In other words, you’re no longer included in the problem- solving. Of course, some matters belong first to the marriage: the stuff of intimacy, finance, family. Increasingly, my friends leave me out of these big conversations, and vice versa, but when 9 outcome is certain, we do update one another, which reminds us that we’re still friends, but with the friendship 10 (reduce) to a PowerPoint.二、选词填空Directions: Fill in each blank with a proper word chosen from the box. Each word can be used only once. Note that there is one word more than you need.Dupes are wearing out Lululemon AthleticaDupes are the products that cost less than the premium (高端的) versions but are of similar style and quality. Less expensive versions of premium products have become a(n) 11 alternative, particularly for younger shoppers.That is becoming a problem for Lululemon Athletica, the company that 12 high-end sportswear and made $100 leggings the norm.“The brand logo doesn’t hold as much appeal as it used to,” said Mikayla Kitsopoulos, a 22- year- old college student. “Finding 13 is the new status symbol.” When Kitsopoulos was in high school, she wore Lululemon leggings, which cost about $100. Now, she buys her leggings on Amazon for about $30. She said the quality and fit is almost 14 , so why pay more?The heightened competition comes as Lululemon has made a series of 15 that have turned off even some of its most devoted fans. Not long ago, it removed a new type of leggings from its stores and website after customers complained about the fit. Other mistakes have included a color palette that was too 16 and not having enough of some products such as smaller size leggings. The misfires have pushed people such as Natalie Assink to 17 seek out different brands. The20-year-old college student said she switched from Lululemon to Gymshark and AYBL not just because their leggings cost less, but also because they have more color varieties.Buying cheaper versions of premium products isn’t new. Boasting about it is. Ellyn Briggs, Moring Consult’s brands analyst, 18 the growing popularity of dupes to inflation but also to the rise of social media. The No. I reason people said they bought dupes was to save money, according to Morning Consult’s survey. They also wanted to test out whether the cheaper versions were as good as the premium 19 and then post about them on TikTok or other platforms. “It’s more than just a transaction,” Briggs said. “They want to share the fact that they have 20a success.”三、完形填空People’s relationship with work is complex and complicated. 21 complaining about the boredom and bureaucracy, the power-crazed bosses and disobedient colleagues, individuals need the security of a job. A century of research has shown that 22 is bad for mental health, leading to depression, anxiety and reduced self-esteem.On average, it has an even greater effect than divorce. But how much work do you need to do? A recent paper by the Centre for Business Research at Cambridge University found that people working reduced working hours or being 23 do not have poorer mental health. What was particularly surprising is how little work was needed to keep people happy. The threshold for good mental health was just one day a week — after that, it seemed to make little difference to individuals’ well-being if they worked eight hours or 48 hours a week. The 24 from working clearly comes from the feeling of purpose, from the social status it creates and from the camaraderie of colleagues engaged in the same tasks.A little bit of work may be 25 , but too much is not. An enterprising junior analyst at Goldman Sachs recently surveyed his 26 . The survey found those first-year analysts had worked an average 98 hours a week since the start of 2021, and only managed five hours of sleep a night. It found that 77% of them had been the subject of 27 , that 75% had sought, or considered seeking counselling, and that, on average, they had suffered sharp declines in mental and physical health.Nevertheless, the general reaction to the story was remarkably 28 . In some people’s eyes, the young analysts should have expected to be 29 in such a fashion; after all, that is why they were being paid so well. The well-experienced analysts of the investment-banking industry thought “It was the same in my day. Never did me any harm.” 30 , it is still hard to see why young analysts should expect to suffer. They joined a bank, not the Mafia.Nor does it make much 31 sense to have employees working so long that they only get to sleep five hours a night. They can hardly be operating 32 when they are dog-tired. That junior professional staff have always worked long hours is not a good explanationfor 33 stress on young people at the start of their careers. It smacks of the legendary navy motto: “The beatings will continue until morale improves.”Clearly, economy cannot 34 if everyone works one day a week. The need to limit excessive working hours was realised back in Victorian times. For much of the 20th century the length of the average working week fell while output continued to climb.There will be occasions when people have to work late or rise early to finish a project. Day after day, however, a long-hours lifestyle is bad for workers’ health. Some organizations may see the 35 for work as a sign of an employee’s willingness to put their job ahead of their families and friends. If so, they don’t need to have better employees. They need better managers. 21.A.With B.Despite C.Against D.Like 22.A.unemployment B.divorce C.complaint D.prosecution 23.A.employed B.suspended C.criticized D.motivated 24.A.secrets B.fatigue C.boost D.assignment 25.A.stressful B.helpless C.creative D.satisfying 26.A.peers B.superiors C.relatives D.advocates 27.A.workplace abuse B.racial discrimination C.cyber bullyingD.peer pressure28.A.predictable B.inevitable C.normal D.unsympathetic 29.A.accommodated B.treated C.paid D.fired 30.A.Conversely B.Therefore C.However D.Likewise 31.A.education B.medicine C.fitness D.business 32.A.at full efficiency B.at a loss C.in others’ shoesD.in low spirits33.A.relieving B.piling C.blaming D.experimenting 34.A.contract B.collapse C.prosper D.recover 35.A.appetite B.gift C.excuse D.strategy四、阅读理解This year, my two oldest sons asked me to sign them up for piano lessons. For certainreasons, I decided it would also be a good time for me to take up the piano again, after 30 years.As a child, I learned not just the piano, but the cello. I played in two orchestras and sang in the school choir. No one forced me to do any of it, but it wasn’t quite a free choice either. When you are the approval-addicted daughter of an over-invested mother, no one needs to apply force. My mom and I were well matched partners in the dance of unspoken expectation and approval-seeking. I did her forcing for her.For my mother, my musical industriousness wasn’t so much about achievement as identity. She was American by birth, and after marrying my university professor father and moving to London, she spent a decade working to be accepted into the impatient, fraught world of British intellectual society.In this environment, a diligent daughter lugging a giant cello was a tiny amount of cultural capital, a ticket to belonging. As much as anything could, music made me into the person my mother needed me to be, so that she could be the person she needed to be, in order to escape who she actually was.And for my part, although I never truly believed that my mother’s love was conditional, I did have the suspicion that there was a performance- related bonus in there.It was foolish to think that taking up the piano at the same time as my own children would be emotionally uncomplicated. Or perhaps the complication was exactly why I sought it out. Somehow, the piano lessons turn me into both my childhood self, seeking my mother’s approval, and into my mother herself, putting the same high expectations on my own children.My mother was lucky in that I was temperamentally (性情地) suited to the role she assigned me. My sons are not so much so. They are rambunctious and restless, not wired for lengthy sessions of sitting still and reflecting well on me.Unconditional love may be at the defining heart of parenthood, but sometimes it can feel impossible to accommodate unconditional love to the worldly practices of day- to- day parenting. The whole job seems set up for conditionality: It would be dishonest to pretend that we have no stake in wanting our children to reflect our own values and preferences.I’m disappointed when my sons won’t play their role in the script I have written for them, but deep down, I’m also a little thrilled. They are maddeningly, gloriously resistant to the pressure.A secret part of me is delighted by their raging demands for full personhood -beyond myprojections and hopes and fears. By the life they claim.36.The underlined sentence in paragraph two means ______.A.The author demanded to learn musical instruments out of pure love.B.The author forced her mum to sign her up for piano lessons against her will.C.The author’s mom pushed her to learn musical instruments for her own sake.D.The author offered to learn musical instruments to obtain her mom’s approval.37.The author’s mother think of the author’s musical industriousness as ______.A.a symbol more of family achievement than of social identityB.a way for her to fit into the British intellectual society at that timeC.proof of her ability to be a qualified mother in front of her husbandD.a result of her selfless cultivation more than the author’s own diligence38.Which of the following is TRUE from the author’s perspective?A.She doesn’t care about her sons’ levels of playing musical instruments.B.She has a mixed feeling towards her sons’ reluctance to practise musical instruments.C.She feels sorrowful because her sons are unlikely skilled at playing musical instruments.D.She is still convinced that her sons could be as talented on musical instruments as she was. 39.Which of the following might be the best title for the passage?A.Can Musical Talents Really be Inherited?B.Can We Really Force Our Children to Love Music?C.Can We Really Love Our Children Unconditionally?D.Can Playing Instruments Help Us Fit into Intellectual Society?Universal Studios SingaporeHave your fun multiplies across 6 themed zones.Universal Studios Singapore is Southeast Asia’s first and only Universal Studios theme park. Transported by adrenaline- pumping rides, you can enjoy interactive shows and a wide variety of exciting attractions based on the blockbuster movies and television series you know and love sowell. Welcome in and enjoy the ride!Rides and ShowsOperating hours may be subject to changes without prior notice. Street entertainment and selected experiences will not be available until further notice. Please click here to view the Rider’s Guide for Rider Safety and Guest with Disabilities.S. E. A.AquariumExplore the wonders of the oceans’ diverse inhabitantsand how to protect marine life.S. E. A.Aquarium is one of the world’s largest aquariums, home to more than 100,000 marine animals representing 1,000 species across more than 40 diverse habitats. The vast array of aquatic life is complemented by interactive programs, up- close animal encounters and immersive learning journeys to inspire visitors to protect the world’s oceans. S. E. A.Aquarium will be closed every Tue and Wed from 1 Jul to 31 Aug, 2 and 3 Sep, plus every Tue and Wed from 9 Sep to 30 Nov 2024. On 9 Sep, kindly be advised that S. E. A.Aquarium will be closed at 2:00 PM for the Teyvat SEA Exploration media preview. We seek your kind understanding for any inconvenience caused.Before Visit AdvisoryWe encourage cashless payments. Tap and pay with your contactless cards or digital wallets at our attractions, hotels and RWS- owned dining establishments.TicketsLatest ticket price is available in Booking page. Please click here.Adventure Cove Waterpark“Water” way to play!From thrilling water slides full of high- speed twists and turns to appealing wonders of different coves, there’s an experience waiting just for you at Adventure Cove Waterpark. For the ultimate adrenaline seeker, Riptide Rocket is an irresistible pull and on the opposite side of it is the calming trip down Adventure River.Note:Adventure Cove Waterpark will be closed on September 15 for a private event. We appreciate your understanding and apologize for any inconvenience this may cause. We look forward to welcoming you soon.Important InformationIn the event of unpleasant weather, all outdoor attractions will be suspended for your safety. Most water attractions are physically demanding and is not recommended for pregnant mothers.No outside food and beverages will be permitted. Please click here for more information of accepted swimwear prior to your visit.40.According to the passage, which of the following statements is TRUE?A.The S. E. A.Aquarium accepts only cash payments for tickets and dining.B.Three attractions are friendly for all guests even those who have been pregnant.C.Universal Studios Singapore has 6 zones themed on famous films and TV series.D.Adventure Cove Waterpark is open every day without exception throughout the year. 41.Lydia, a fan of adventure but hates getting wet, is planning for a day trip on Thursday September 15th. The most suitable attraction for her is ______.A.Universal Studios Singapore B.S. E. A.AquariumC.Adventure Cove Waterpark D.Riptide Rocket42.Where can you most probably find this passage?A.The official website of a resort.B.A travel magazine.C.The newspaper’s entertainment section.D.An update on social media.JULY 19TH was a day for help- desk heroes. A routine software update by CrowdStrike, a cyber- security company, caused computer breakdown in offices, hospitals and airports worldwide. Most white- collar workers looked miserably at their screens and realised just how useless they are if they cannot log in. People in IT came to the rescue of helpless colleagues and stranded passengers. Their work that day was full of stress— but also full of meaning.If machines can add purpose to some jobs when they fail, what about when they work properly? This is not a meaningless question. Technologies tend to spread in less dramatic ways, task by task rather than role by role. Before machines replace individuals, they change the nature of the work they do.A recent paper, from Milena Nikolova and Femke Cnossen looked at the prevalence of robots in industrial settings and how that affected workers. Robots reduced the perceived meaningfulness of jobs across the board, regardless of age, gender, skills and the type of work. In theory, machines can free up time for more interesting tasks; in practice, they seem to have had the opposite effect.In a separate paper, Ms Nikolova and Anthony Lepinteur of the University of Luxembourg,explore why this might be. They find that industrial robots make jobs less physically exhausting. But the number of tasks that remain open to humans decreases, hurting both the variety of work and people’s understanding of the production process. Work becomes more routine, not less.Machines need not have a dulling effect. In their research Ms Nikolova and her co- authors found that people did not perceive a loss of autonomy if they were working with computers, where they have more control of the machine than the other way round. And automation may well have a different impact on service industries like health caro, where less time spent on manual work might indeed mean more time with patients.A paper from 2011 by Michael Barrett of the University of Cambridge found that the introduction of drug- dispensing robots into hospital pharmacies had different effects. Pharmacists felt the quality of their jobs had improved because they had more time for patient counselling. Pharmacy assistants had a more miserable time of it, however, as their role shrank to loading medicine into the machines.It is still too early to know how AI will affect the quality of work. Some will surely enjoy using a bot to brainstorm ideas and take care of boring tasks, while others may not. The thing for managers to remember is that machines can make employees feel differently about their work. So it matters whether new technologies are introduced in collaboration with employees or imposed from above, and whether they enhance or weaken their sense of competence.43.Which of the following statements is TRUE according to the first and second paragraphs?A.Machines can sometimes add more purposes to jobs when they fail.B.Technologies typically spread across entire roles, replacing workers in one go.C.Potential demerits of introducing machines in the workplace have been recorded.D.A cyber- security company caused technological faults on purpose when testing thesoftware.44.What’s the conclusion of Ms Nikolova’s research in industrial settings?A.Workers feel more autonomous and in control when working with robots.B.Machines reduce the sense of purpose in human workers’ jobs in reality.C.Industrial robots replace human workers, eliminating their tasks and roles.D.Automation facilitates manual labor, increasing the variety of tasks.45.We can infer from Barrett’s research that ______.A.the introduction of robots leads to a decrease in job quality for all hospital staffB.when robots are introduced, staff tend to feel more satisfied regardless of their rolesC.in the same department, workers in different positions can feel differently to automation D.in some occupational areas, automation does constantly reduce the perceivedmeaningfulness46.Which of the following studies will others in the last paragraph cite as their evidence?A.A paper from Boris Nikolaev illustrates that many employees put a higher premium on non- monetary than monetary rewards.B.Research by Pok Man Tang of the University of Georgia suggests that workers whointeract more with AI assistants feel lonelier and long for more social contact.C.A recent Federal Reserve discussion paper surveyed American workers who had switched jobs; they found that interest in the work mattered more to people than pay and benefits.D.An experiment conducted by Eugina Leung states that a technology that cuts down on boring tasks is fine; one that threatens your sense of identity is not.How Many Devices Are You Wearing?The classic nightmare of suddenly realizing you are naked in public could soon get a futuristic twist: it might involve the horror of losing not just your modesty but also your pass codes. Scientists recently created magnetic garments that they say can store data, automatically unlock doors or control a nearby smartphone with gesture. The concept of interactive “smart clothing” has drawn attention in the past couple of years. 47 This and other smart garments are made with conductive thread and usually require an attached electronic device. To eliminate the need for such devices, researchers at the University of Washington recently took advantage of what is a previously untapped property of conductive thread: its ability to be magnetized. “Using magnetic instead of electric properties of the thread may seem like a small difference, but it is what makes this work interesting and exciting,” says Chris Harrison, a computer scientist at Carnegie Mellon University. 48The Washington team magnetized a patch of fabric embroidered with conductive thread, giving different parts of the cloth a north or south orientation that correspond to binary 1’s or0’. This step allowed the researchers to store up to 33 million different combinations — such as passcodes for doors — on a shirt sleeve. 49 The team described its findings last October at a meeting of the Association for Computing Machinery.The garments still stored data after washing, drying and ironing, but they could not escape time’s eraser; after about a week, the threads’ magnetic fields had weakened by around30 percent.50 But for now the clothes may be best suited for storing temporary codes, such as those found on hotel key cards or clothing tags in stores. Harrison says that it is “very unlikely you are ever going to achieve a comparable density to magnetic hard drives” with data-storing fabric, however.A.Custom- made thread has thus been designed so that the clothes are enabled to work longer. B.For example, Google and Levi’s created a touch- sensitive jacket that can operate a smartphone. C.Turning wearables into storage devices with the new technique was a unique thing the researchers bad done.D.The researchers suggest that using custom- made thread designed to hold stronger magnetic fields might work longer.E.The new technique allowed the researchers to do something they say is unique among wearables: turn them into storage devices.F.They also created magnetic gloves that could control a nearby smartphone with gestures.五、书面表达51.Directions: Read the following passage. Summarize the main idea and the main point(s) of the passage in no more than 60 words. Use your own words as far as possible.Work is just meeting nowIn 2016, a group of work researchers calculated that time spent in meetings had increased by 50 percent since the 1990s. Many workers were spending so much time in meetings, taking calls, and combing through their inbox that their most “critical work” often had to wait until they were home. Wall- to- wall meetings from 9 to 5 were pushing any creative or individual work to some period after dinner.In 2022, Microsoft researchers published a study that anonymously tracked workers using the company’s software. They discovered that about one-third of the workers in their study wereas likely to work at 10 p. m. as they were at 8 a. m. The reason? When the pandemic sent knowledge workers home, official meetings replaced casual interactions and made it impossible for many people to get things done unless they found time to log back online after dinner. In further research, Microsoft has found that, since 2020, workers in their sample have tripled the time they spent in meetings.If someone had to defend this phenomenon, they might point out that as firms grow, they accumulate bureaucratic habits. Departments are born, and workers within those departments develop expertise that is alien to people just down the hall. Working across these divisions requires that people spend more time getting to know and understand what their colleagues- are doing.Recent cultural changes might also be driving the surge in meeting times. In the last few years, the business world has focused much more on inclusion— letting more people’s voices be heard in decision- making. A business culture that allows more people to say their piece is one that requires people to spend more time listening to other people talk. In some decisions, that might be appropriate. At extremes, an office that requests more input is an office where talking about work can disturb efficient decision making.Today, knowledge work is, quantitatively speaking, less about creating new things than it is about talking about those things. Luckily, artificial-intelligence tools have the potential for eliminating unnecessary meetings and allowing people to focus on their work— or, even better, to cut hours of meetings that they can instead devote to leisure._______________________________________________________________________________ _______________________________________________________________________________ _______________________________________________________________________________ _______________________________________________________________________________ _______________________________________________________________________________ _________________________________________________________________六、翻译52.过去80年,浦江沿岸经历了翻天覆地的变化。
第九章对数线性模型对数线性模型是用于离散型数据或整理成列联表格式的计数资料的统计分析工具。
在对数线性模型中,所有用作的分类的因素均为独立变量,列联表各单元中的例数为应变量。
对于列联表资料,通常作χ 2 检验,但χ 2 检验无法系统地评价变量间的联系,也无法估计变量间相互作用的大小,而对数线性模型是处理这些问题的最佳方法。
第一节General过程9.1.1 主要功能调用该过程可对一个或多个二维列联表资料进行非层次对数线性分析。
它只能拟合全饱和模型,即分类变量各自效应及其相互间效应均包含在对数线性模型中。
9.1.2 实例操作[例9-1]在住院病人中,研究其受教育程度与对保健服务满意程度的关系,资料整理成列联表后如下所示。
按一般情形作χ2检验,结果显示不同受教育程度的住院病人其对保健服务满意程度无差别。
但从百分比分析中可见,随受教育程度的提高,满意程度有下降的趋势;且我们还想了解受教育程度与满意程度有无交互作用和交互作用的大小。
对此,必须采用对数线性模型加以分析。
9.1.2.1 数据准备激活数据管理窗口,定义变量名:实际观察频数的变量名为freq,受教育程度和满意程度作为行、列分类变量(即独立变量),变量名分别为educ、care。
输入原始数据,结果如图9.1所示。
如同第四章Crosstab过程中所述,为使列联表的频数有效,应选Data菜单的Weight Cases...项,弹出Weight Cases对话框(图9.2),激活Weight cases by项,从变量列表中选freq点击 钮使之进入Frequency Variable框,点击OK钮即可。
图9.1 原始数据的输入图9.2 频数的加权定义9.1.2.2 统计分析激活Statistics菜单选Loglinear中的General...项,弹出General Loglinear Analysis对话框(图9.3)。
从对话框左侧的变量列表中选care,点击 钮使之进入Factor(s)框,点击Define Range...钮,弹出General Loglinear Analysis: Define Range对话框,定义分类变量care的范围,本例为1、2,故可在Minimum处键入1,在Maximum处键入2,点击Continue钮返回General Loglinear Analysis对话框。