2013雅思强化写作课程_S2_图表写作的审题-曲线图_[兼容模式]
- 格式:pdf
- 大小:1.58 MB
- 文档页数:60
![[雅思]3种常见雅思图表作文](https://uimg.taocdn.com/beb24afc2f60ddccdb38a0c7.webp)
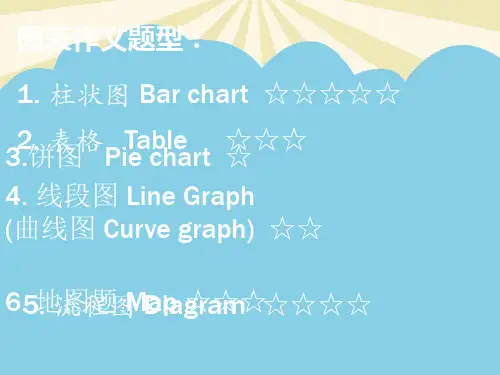
1.柱状图:柱状图本质上就是前三种图的柱状形式,下面我们通过一个图来进行掩饰。
这张图看起来像三张饼图,等于四根曲线图,可以使用总分句,还等于一个3×4的表格题。
我们在写的时候可以使用一些表格题的写作方法,比如:This was the similarcase with the trend of foot.其实我们讲,考试中虽然有4种图,但题型本质上就分动态图和静态图,动态图最好使用曲线图的整体写作模式,就是All trends加天龙八部的微观和宏观结合,静态图则是静态表格的写作模式,通常用纯比较的写作模式。
所以我们在写作中要记住,语言不用新学了,完全借鉴前三种中的句型。
柱状图特殊的要求一,对类比和反比非常重视,因为它主要是向前三种图借鉴,也就是它不再强调每一种题型的要求,它不必强调趋势或者数字,它对每个图的当中共性和差异的开发是比较重视,所以柱状图中的文字性的部分可以多一些。
二,柱状图对语法的要去很高,很多柱状图属于静态图,这样写作的时候要求主语和句型的多样性。
三,它要求我们掌握一个概念,即隐藏特征的概念,它是柱状图特有的,后来引入到其他图,所谓隐藏特征即隐藏在数据背后的客观性事实,首先它是不明显的,要看你个人的分析能力,第二它是客观性事实,千万不要夹杂个人观点,如果在雅思中发表个人观点,一定5分以下。
另外隐藏特征要在结尾段写,它有自己的默认格式:What is worth mentioning is that since…, it indicates the fact that…,这个应该算高分的最后一击。
雅思Task1的高分关键在于:一,变化多端的wording,句式和体系,这就说明了你词汇的词汇的使用能力,包括句型的变化,这个用的好的话,5分是一定的;二,清晰宏观的分类,all trends的总分句;三,7.5分以上需要有力得体的隐藏特征,这是一个加分,找不到不扣分,找到有0.5分的加分。

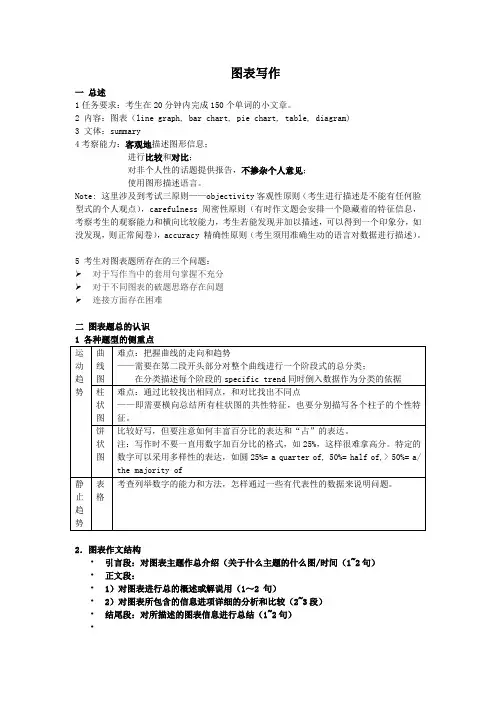
图表写作一总述1任务要求:考生在20分钟内完成150个单词的小文章。
2 内容:图表(line graph, bar chart, pie chart, table, diagram)3 文体:summary4考察能力:客观地描述图形信息;进行比较和对比;对非个人性的话题提供报告,不掺杂个人意见;使用图形描述语言。
Note: 这里涉及到考试三原则——objectivity客观性原则(考生进行描述是不能有任何脸型式的个人观点),carefulness 周密性原则(有时作文题会安排一个隐藏着的特征信息,考察考生的观察能力和横向比较能力,考生若能发现并加以描述,可以得到一个印象分,如没发现,则正常阅卷),accuracy 精确性原则(考生须用准确生动的语言对数据进行描述)。
5 考生对图表题所存在的三个问题:➢对于写作当中的套用句掌握不充分➢对于不同图表的破题思路存在问题➢连接方面存在困难二图表题总的认识2.图表作文结构•引言段:对图表主题作总介绍(关于什么主题的什么图/时间(1~2句)•正文段:•1)对图表进行总的概述或解说用(1~2 句)•2)对图表所包含的信息进项详细的分析和比较(2~3段)•结尾段:对所描述的图表信息进行总结(1~2句)•三、图表题写作 1.审题:• -先看文字信息-把握主题 • -再看图标信息-把握具体信息 • Eg.p28• 横坐标:时间1950-1996(时态?) • 纵坐标:数据(单位?)• 图表标题:world grain harvested area,1950-19962.Introduction 写作通过改写题目(同义词转换,句式结构改変,增减细节)完成引言段写作 • Eg.请改写P28的题目• 比较原题与改写后的introduction 有什么不同之处:• The graph below shows the area of land from which grain was harvested. • This line graph above illustrates the total world grain harvested areas inmillions of hectares between 1950 and 1996. • 同义词转换:show- illustrate ,reveal ,depict, demonstrate, compare, give someinformation about …,• 句式转换:the total grain harvested areas• 增加细节:in millions of hectares , between 1950 and 1996注意:为避免plagiarism,一定要对题目进行改头换面。
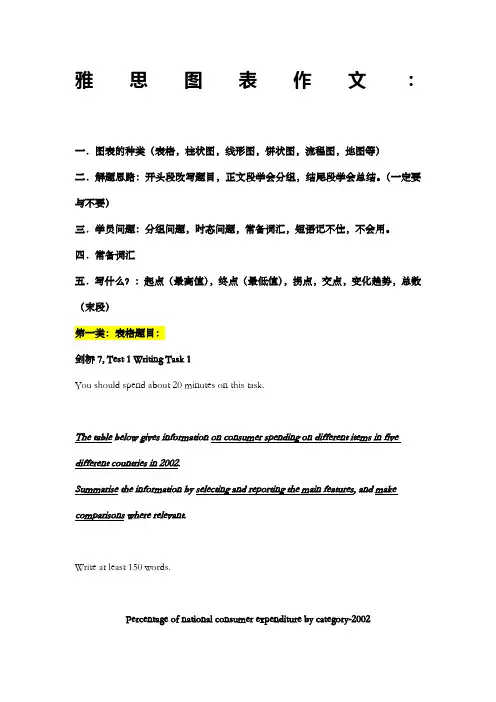
雅思图表作文:一.图表的种类(表格,柱状图,线形图,饼状图,流程图,地图等)二.解题思路:开头段改写题目,正文段学会分组,结尾段学会总结。
(一定要与不要)三.学员问题:分组问题,时态问题,常备词汇,短语记不住,不会用。
四.常备词汇五.写什么?:起点(最高值),终点(最低值),拐点,交点,变化趋势,总数(末段)第一类:表格题目:剑桥7, Test 1 Writing Task 1You should spend about 20 minutes on this task.The table below gives information on consumer spending on different items in five different countries in 2002.Summarise the information by selecting and reporting the main features, and make comparisons where relevant.Write at least 150 words.Percentage of national consumer expenditure by category-2002参考范文:The table gives the breakdown about data on consumer spending on various items (Food/Drink/Tobacco, Clothing/Footwear and Leisure/Education) in five different countries (Ireland, Italy, Spain, Sweden and Turkey) in 2002.Generally, each country consumed much more in food/drink/tobacco where Turkey dominated the first place with 32.14%, standing in marked contrast with Sweden (only 15.77%) than in other 2 categories. In terms of Clothing/Footwear, Italy expectedly spent most with 9% compared with still Sweden seeing the smallest proportion (5.4%). As for Leisure/Education, it was Turkey and Spain that consumed the most and least with 4.35% and 1.98% respectively.Additionally, we can see immediately that in food/drink/tobacco, after Turkey, Ireland,Spain and Italy came in turn with 28.91%, 18.80% and 16.36%. On the contrary, in Clothing/Footwear, we failed to see big gap from Ireland, Spain and Turkey in middle positions which saw different reductions of 2.57%, 2.49% and 2.37% in comparison with Italy, likewise, in Leisure/Education, still small differences were found. To be exact, Turkey was followed by Sweden, Italy and Ireland in a slow falling turn with 3.22%, 3.2% and 2.21%.In conclusion, people prefer to spend on those products directly relating to food. (189 words)Writing Task 1You should spend about 20 minutes on this task.The table below summarises some data collected by a college bookshop for the month of February 1998.Write a report describing the sales figures of various types of publications, based on the information shown in the table.Write at least 150 words.参考范文:The table describes some sales figures gathered by a university bookstore for February, 1998.We can see from the table that the non-book club member figures are made up of sales to college staff, college students and members of the public. More specifically, college staff bought 332 magazines, 44 fiction and 29 non-fiction books while college students bought 1249 magazines, 194 non-fiction books and 31 fiction books. More magazines were sold to college students than any other group of customers. In contrast, although no fiction books were sold to members of the public, they bought 122 non-fiction books and 82 magazines.According to the table,book club members bought more fiction (76) and non-fictionbooks (942) than other customers. On the other hand, magazine sales to club members (33) were fewer than to any other type of customers.The total number of sales for the month was 3134 (1474 to college students, 405 to staff,204 to the public and 1051 to book club members). 151 books sold were fiction and1287 were non-fiction. Therefore, it can be clearly seen from the table that magazines accounted for the greatest number of sales (1696).(192 words)使用括弧的注意事项:后面不加单位。
2013-2014年雅思写作真题汇总2013.01.05Some people spend more time reading books, while others prefer to watch TV. The former group are more likely to develop creative imaginations and have a much better grasp of language skills. Do you agree or disagree?2013.01.10It is said that work is the most important thing of people's life. Without the success of career, life will become meaningless. To what extent do you agree or disagree with the opinion?2013.01.12In some countries, the parents expect children to spend long time in studying both in and after school and have less free time. Do you think it has positive or negative effects on children and the society?2013.01.19In modern society, fatherhood should be emphasized as much as motherhood. Do you agree or disagree?2013.02.02Some people say watching television is bad for Children in all ways, others say it is good for children to get knowledge.2013.02.14Some people think young people should be free to choose his or her job,but other people think they should be realistic and think more about their future. Discuss both views and give your own opinion.2013.02.16Some people think all lawbreakers should be taken in to prison, others believe that there are better alternatives, (for example, being work to do which is beneficial for local community). Discuss both views and give your own opinion. 2013.02.23Not enough students choose science subjects in university in many countries. What's the reasons for this problem? What's the effects to the society?2013.03.02Universities and colleges are now offering qualifications through distance learning from the Internet rather than teachers in the classroom. Do you think the advantages of this development overweight the disadvantages?2013.03.09Some think that people should go to college or university to prepare for a successful career. Others believe that they should get a job immediately after they leave school to get more work experience. Discuss both these views and give your own opinion.2013.03.14It is more important for a building to serve a purpose than to look beautiful. Architects shouldn’t worry about producing building as a work of art. Do you agree or disagree ?2013.03.23Scientific progress influences our daily life greatly. Do you think this is a positive or negative development?2013.04.06100 years ago, human race believed we would make continue progress in all areas of life. Today, some people feel less certain about this. what areas of progress human race has made? What else areas we haven't developed?2013.04.13As countries develope, their populations tend to live individually or in a small family units. In your opinion, what is this cause and what are the effects on society.2013.04.18Some people think that it is acceptable to use animals in medical research for the benefit of human beings, while other people argue that it is wrong.2013.04.27Some people think that older schoolchildren should learn wide range subjects and develop knowledge, other peoplethink that they should only learn a small number of subjects in details.2013.05.11Today, the qualities of life of people in big cities are worse. What are the causes of this problem? Any measures should be taken to solve it?2013.05.16People nowadays are surrounded by all kinds of advertising. Advertising affects what people think is important and sometimes has a negative influence on people’s lives. o what extent do you agree or disagree?2013.05.18Some people think all children learn history in school is important; some others think learning subjects more relevant to life is important. Discuss both views and give your opinion.2013.05.25Some people think government should not spend money on supporting artists and money should be spent on more important things. To what extent do you agree or disagree?2013.06.08Nowadays people are encouraged to buy more and more consumer products. Some people think it is good for the economy. However, others think it does great harm to the whole society. Discuss both views and give your own opinion.2013.06.15Some people think that parents have a great influence on their children, others believe that the media is a bigger influence.6-15Some people think family has great influence on children's development. Others, however, believe that other things, such as media, have greater effects.Discuss both views and give your own opinion.6-22Some people think secondary school should have a class of international news. Others believe it is not necessary.Discuss both views and give your own opinion7-6Space travel has been possible for some time and some people think the space tourism could bedeveloped in the future.To what extent do you think it's a positive or negative development?7-13The tendency for human beings to copy one another is shown in the popularity of fashion in clothes and other consumer goods.Do you agree or disagree?7-27The reconstruction of old buildings in major cities takes numerous government expenditures; itshould be used in building new housing and road.Do you agree or disagree?8-3In many countries today, people in cities either live alone or in small family units rather than inlarge extended family groups.Is this a positive or negative development?8-17In many countries, students pay for their own college and tuition fees, while sometimesgovernment pays.Do the advantages for the government paying outweigh disadvantages?8-24Some people think that in modern society individuals are becoming more dependent on each other.But others say that individuals are becoming more independent on each other. Discuss both theseviews and give your own opinion8-29Scientists believe computers will become more intelligent than human beings. Some people thinkthe development have a positive impact; others think it is negative.Discuss both these views and give your own opinion9-7Nuclear energy is the best source of power in meeting ever-increasing energy needs,to what extent do you agree or disagree9-12Countries with a long average working time are more economically successfulthan those countries which do not have a long working time. To what extent do you agree or disagree?9-21what is the most important element you think to make a perfect society. How do people do to achieving an ideal society?9-28Some people think they have right to use as much fresh water as they want,others,otherwise believes governments should strictly control the use of fresh water as it is limited resource. Discuss both views and give your own opinion.10-10Some people think giving aid to poorer countries have more negative effects than positive effects. to what extend do you agree or disagree?10-12Economic progress is one way to measure a country's success. Other people think other factors are also important.10-19Many parents these days work in other countries, taking their families with them. Do you think advantages of the development outweigh its disadvantages?10-26Some people think a rise in standard of living in a country only seems to benefit cities more than rural areas. What problems may those differences cause? How to reduce this problem?11-9小作文:小作文静态饼图,reasons for students'' choosing schools;大作文:犯罪类别,Argumentation:young people who commit serious crimes should be punished in the same way as adults. To what extent do you agree or disagree?少年犯罪应该和成人处罚一样.11-16table,关于six areas of study的graduates的employment rate和average salary。
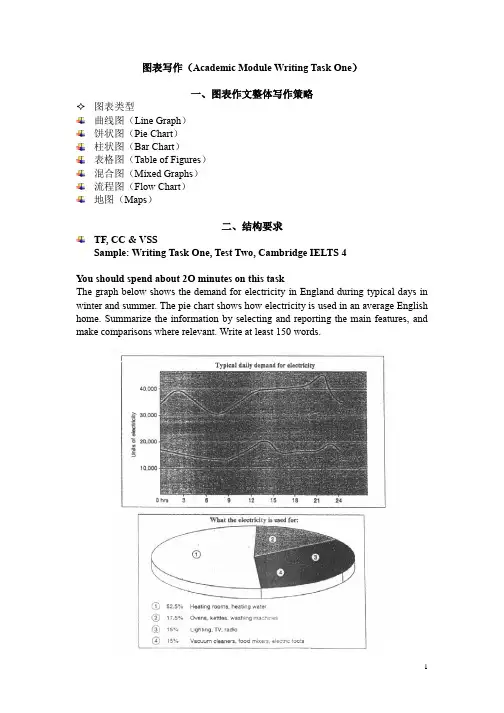
图表写作(Academic Module Writing Task One)一、图表作文整体写作策略图表类型曲线图(Line Graph)饼状图(Pie Chart)柱状图(Bar Chart)表格图(Table of Figures)混合图(Mixed Graphs)流程图(Flow Chart)地图(Maps)二、结构要求TF, CC & VSSSample: Writing Task One, Test Two, Cambridge IELTS 4You should spend about 2O minutes on this taskThe graph below shows the demand for electricity in England during typical days in winter and summer. The pie chart shows how electricity is used in an average English home. Summarize the information by selecting and reporting the main features, and make comparisons where relevant. Write at least 150 words.The line graphs compare the typical daily demands for electricity in winter and summer in England. As can be seen, the electricity consumption in winter almost doubles that in summer at any given moment of a day. The former waves between 30,000 and 45,000 units, while the latter fluctuates between 13,000 and 20,000 units. Their development trends see more similarities than differences. From 0 to 9 o’clock, both curves move generally downward to the lowest points of more than 30,000 units and 13,000 units, and from then on, the two lines go roughly upwards, respectively to the highest amount of 45,000 units at 21 o’clock and more than 20,000 units at 13 o’clock.The pie chart reflects an average household use of electricity in England. Heating for both room and water accounts for the biggest share of more than half. The other half of electricity is almost evenly used for three sections: ovens, kettles, washing machines; lighting, Tv, radio; and vacuum cleaners, food mixers, electric tools. The first section consumes a little bit higher of 17.5% while the rest two have an equal share of 15%.From the two charts, it is clear that electricity is in higher demand in winter in England.各段脉络:首段:四要素:图表研究的时间段、研究的对象和研究所采用的数据形式(是具体数字还是百分比)。