纳米粒度及Zeta电位分析仪
- 格式:doc
- 大小:19.95 KB
- 文档页数:1
粒径及zeta电位实验原理一、引言粒径及zeta电位是纳米颗粒表征中最常用的两种参数,它们能够反映纳米颗粒的大小和表面电荷特性,对于纳米材料的研究具有重要的意义。
本文将详细介绍粒径及zeta电位实验原理。
二、粒径实验原理1.动态光散射法(DLS)动态光散射法(Dynamic Light Scattering, DLS)是一种常用的测量纳米颗粒粒径分布的方法。
其基本原理是利用激光散射现象,通过测量散射光强度随时间变化的自相关函数来计算出颗粒在溶液中的有效半径分布。
该方法适用于测量直径在几纳米到几微米之间的颗粒。
2.静态光散射法(SLS)静态光散射法(Static Light Scattering, SLS)是一种通过测量溶液中颗粒对入射激光束进行非弹性散射而得到样品分子量和分子大小信息的技术。
该方法适用于大分子或聚合物等高分子材料。
三、zeta电位实验原理1.电泳光散射法(ELS)电泳光散射法(Electrophoretic Light Scattering, ELS)是一种通过测量颗粒在外加电场下的运动速度和其所受到的电荷数目来计算出颗粒表面电荷特性的方法。
该方法适用于测量直径在几纳米到几微米之间的颗粒。
2.激光多角度光散射法(MALS)激光多角度光散射法(Multi-Angle Light Scattering, MALS)是一种通过测量样品对入射激光束进行非弹性散射而得到样品分子量和分子大小信息的技术。
该方法适用于大分子或聚合物等高分子材料。
四、实验操作流程1.样品制备:将需要测试的样品溶解在适当溶剂中,并进行必要的稀释。
2.仪器预热:打开仪器并进行预热,保证仪器处于稳定状态。
3.参数设置:根据实验要求,设置相应的参数,如激光波长、探测角度等。
4.测试操作:将样品注入测试池中,并启动测试程序。
5.数据处理:根据实验结果进行数据处理和分析,如计算粒径分布、zeta电位等参数。
五、实验注意事项1.样品制备应注意避免气泡的产生和溶剂的挥发。
实验7 Zeta 电位法测蛋白质的等电点实验目的1. 掌握zeta 电位的测试原理方法以及zeta 电位仪的使用。
2. 掌握通过zeta 电位测量蛋白质等电点的方法。
实验原理分散于液相介质中的固体颗粒,由于吸附、水解、离解等作用,其表面常常是带电荷的。
Zeta 电位是描述胶粒表面电荷性质的一个物理量,它是距离胶粒表面一定距离处的电位。
若胶粒表面带有某种电荷,其表面就会吸附相反符号的电荷,构成双电层[1]。
在滑动面处产生的动电电位叫作Zeta 电位,这就是我们通常所测的胶粒表面的(动电)电位。
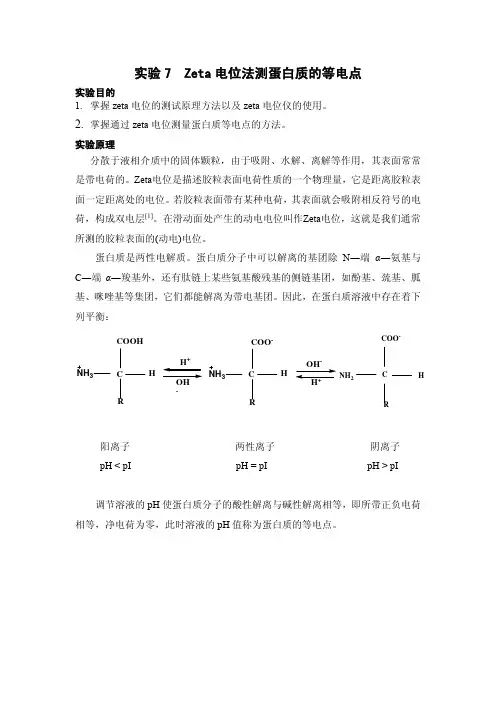
蛋白质是两性电解质。
蛋白质分子中可以解离的基团除N ―端α―氨基与C ―端α―羧基外,还有肽链上某些氨基酸残基的侧链基团,如酚基、巯基、胍基、咪唑基等集团,它们都能解离为带电基团。
因此,在蛋白质溶液中存在着下列平衡: C COOH H R NH 3+-C H R NH 3COO --+C COO -H NH 2R阳离子 两性离子 阴离子pH < pI pH = pI pH > pI调节溶液的pH 使蛋白质分子的酸性解离与碱性解离相等,即所带正负电荷相等,净电荷为零,此时溶液的pH 值称为蛋白质的等电点。
图1. PH值对BSA的zeta电位的影响(0.1mol / L NaCl溶液)[2]等电点是蛋白质的一个重要性质,本实验旨在通过测定不同pH下1mg/ml 的牛血清白蛋白(BSA)溶液的zeta电位,用zeta电位值对pH作图(如图1),对应于zeta电位为零的pH即为牛血清白蛋白(BSA)的等电点。
实验仪器及试剂:ZetaPALS型Zeta电位及纳米粒度分析仪,比色皿,钯电极,牛血清白蛋白(BSA),柠檬酸,柠檬酸钠,去离子水。
实验步骤:1.配制pH值分别为3.0,4.2,5.4,6.6的0.1mol/L柠檬酸-柠檬酸钠缓冲溶液溶液脱气后,再加入BSA充分溶解。
2.打开仪器后面的开关及显示器。
3.打开BIC Zeta potential Analyzer(水相体系)/BIC PALS Zeta potentialAnalyzer(有机相)程序,选择所要保存数据的文件夹(File-Database-Create Flod 新建文件夹,File-Database-双击所选文件夹-数据可自动保存在此文件夹),待机器稳定15-20min后使用。
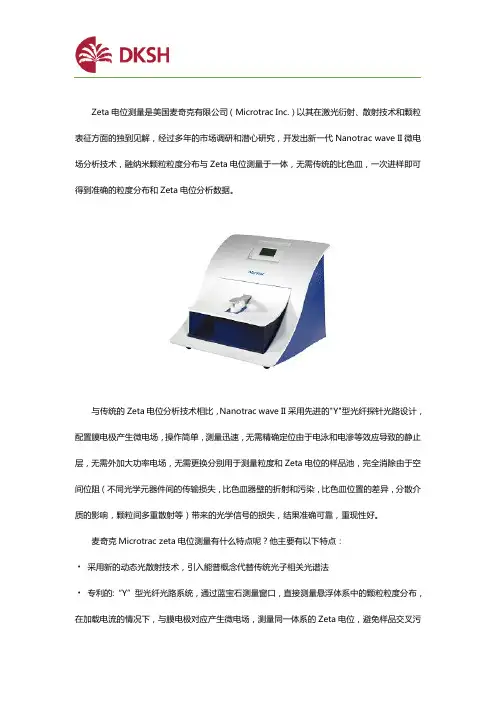
Zeta电位测量是美国麦奇克有限公司(Microtrac Inc.)以其在激光衍射、散射技术和颗粒表征方面的独到见解,经过多年的市场调研和潜心研究,开发出新一代Nanotrac wave II微电场分析技术,融纳米颗粒粒度分布与Zeta电位测量于一体,无需传统的比色皿,一次进样即可得到准确的粒度分布和Zeta电位分析数据。
与传统的Zeta电位分析技术相比,Nanotrac wave II采用先进的"Y"型光纤探针光路设计,配置膜电极产生微电场,操作简单,测量迅速,无需精确定位由于电泳和电滲等效应导致的静止层,无需外加大功率电场,无需更换分别用于测量粒度和Zeta电位的样品池,完全消除由于空间位阻(不同光学元器件间的传输损失,比色皿器壁的折射和污染,比色皿位置的差异,分散介质的影响,颗粒间多重散射等)带来的光学信号的损失,结果准确可靠,重现性好。
麦奇克Microtrac zeta电位测量有什么特点呢?他主要有以下特点:﹡采用新的动态光散射技术,引入能普概念代替传统光子相关光谱法﹡专利的:“Y”型光纤光路系统,通过蓝宝石测量窗口,直接测量悬浮体系中的颗粒粒度分布,在加载电流的情况下,与膜电极对应产生微电场,测量同一体系的Zeta电位,避免样品交叉污染与浓度变化。
﹡专利的异相多谱勒频移技术,较之传统的方法,获得光信号强度高出几个数量级,提高分析结果的可靠性。
﹡专利的可控参比方法(CRM),能精细分析多谱勒频移产生的能谱,确保分析的灵敏度。
﹡超短的颗粒在悬浮液中的散射光程设计,减少了多重散射现象的干扰,保证高浓度溶液中纳米颗粒测试的准确性。
﹡专利的快速傅利叶变换算法(FFT,Fast Fourier Transform Algorithm Method),迅速处理检测系统获得的能谱,缩短分析时间。
﹡专利膜电极设计,避免产生热效应,能准确测量颗粒电泳速度。
﹡无需比色皿,毛细管电泳池或外加电极池,仅需点击Zeta电位操作键,一分钟内即可得到分析结果﹡消除多种空间位阻对散射光信号的干扰,诸如光路中不同光学元器件间传输的损失,样品池位置不同带来的误差,比色皿器壁的折射与污染,分散介质的影响,多重散射的衰减等,提高灵敏度。
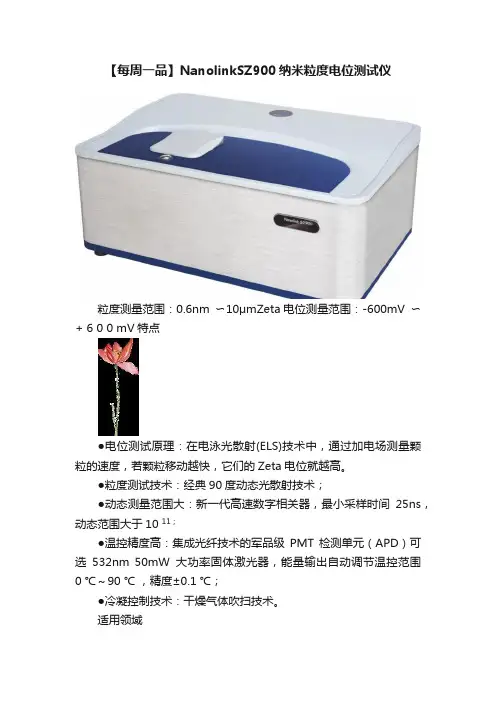
【每周一品】NanolinkSZ900纳米粒度电位测试仪
粒度测量范围:0.6nm 〜10μmZeta电位测量范围:-600mV 〜+ 6 0 0 mV特点
●电位测试原理:在电泳光散射(ELS)技术中,通过加电场测量颗粒的速度,若颗粒移动越快,它们的Zeta电位就越高。
●粒度测试技术:经典90度动态光散射技术;
●动态测量范围大:新一代高速数字相关器,最小采样时间25ns,动态范围大于10 11;
●温控精度高:集成光纤技术的军品级PMT检测单元(APD)可选532nm 50mW大功率固体激光器,能量输出自动调节温控范围
0 ℃~90 ℃ ,精度±0.1 ℃;
●冷凝控制技术:干燥气体吹扫技术。
适用领域
广泛应用于有机及无机颗粒、乳液、聚合物、病毒、抗体、蛋白质等样品的颗粒表征。

P A R T I C L E S I Z EZ E TA P O T E N T I A LM O L E C U L A R W E I G H TThe BeNano 90 Zeta is the latest generation of nanoparticle size and zeta potential analyzer designed by Bettersize Instruments Ltd. Dynamic light scattering (DLS), electrophoretic light scattering (ELS) and static light scattering (SLS) are integrated in the system to provide accurate measurements on particle size, zeta potential and molecular weight. The BeNano 90 Zeta is widely applied in academic and manufacturing processes of various fields including but not limited to: chemical engineering, pharmaceuticals, food and beverage, inks and pigments, and life science.“An excellent and robust device for nano-characterization with DLS, SLS, ELS techniques that provide not only particle size analysis but also reproducible zeta potential results.”China Agricultural UniversityBe the Nanoparticle Expert You NeedBioscience and Biopharmaceuticals Nanomaterials Food and BeverageConsumer ProductsMeasurement ParametersVersatile Calculation ModesVarious built-in calculation modes to cover multiple scientific research and application fieldsCapillary Sizing CellSample volume down to 3-5 μL and higher measurement accuracy for large particles Disposable Folded Capillary CellExcellent repeatability of zeta potential measurements and avoid cross-contamination Hydrodynamic diameter D H Polydispersity index PdI Diffusion coefficient D Interaction parameter k D Molecular weightSolution viscosityIntensity, volume, surface area and number distributionZeta potential and its frequency distributionSize (nm)R e l a t i v e I n t e n s i t y Size (nm)R e l a t i v e I n t e n s i t yParticle size and distribution of polymers, colloids, self-assembling system, biomacromolecules, proteins, peptides, antigens, antibodies, nano metal/non-metal particles Studies on the polymerization process and reaction mechanismsStudies on kinetics of self-assembly and other processes of polymerization and depolymerization of macromoleculesResearch on thermal-sensitive systems, for example, PNIPAmDynamic light scattering (DLS), also known as photon correlation spectroscopy (PCS) or quasi-elastic light scattering (QELS),is a technology used to detect the fluctuations of the scattering intensities caused by the Brownian motion of particles. In the dispersant, smaller particles move faster, while larger particles move slower.An avalanche photodiode (APD) detector aligned at 90°collects the scattering intensities of the particles and records them with time. Thetime-dependent fluctuation is converted into a correlation function using the correlator. By applying a mathematic algorithm, the diffusion coefficient D is thereby obtained. The hydrodynamic diameter D H and its distribution are calculated through the Stokes-Einstein equation:C o r r e l a t i o n F u n c t i o nR e l a t i v e I n t e n s i t yThe Correlation Function of Small ParticlesParticle Size Distribution of Small Particles Scattering of Small Particles The Correlation Function of Large ParticlesParticle Size Distribution of Large ParticlesScattering of Large ParticlesC o r r e l a t i o n F u n c t i o nR e l a t i v e I n t e n s i t yD =k B T3πηD HTime (μs)I n t e n s i t yI n t e n s i t yTime (μs)I n t e n s i t yMost light passes through the sample without being scatteredLaserScattered lightDetectorTime (μs)Size (nm)Time (μs)Size (nm)that are subjected to an applied electric field, the frequency of the particles’ scattered light will be different from the incident light due to the Doppler effect. The frequency shift is measured and converted to provide the electrophoretic mobility and hence the zeta potential of a sample by Henry’s equation:Potential Distribution at Particle SurfaceIntermolecular Forces Between ParticlesZeta potential, electrophoretic mobility, and their distributions of suspension systems such as macromolecules, colloids, emulsions, coal-water slurries, proteins, antigens, antibodies and nano metal/non-metal particles Industries include, but are not limited to, chemicals, chemical engineering, biology, food and beverage, pharmaceuticals, water treatment, environmental protection, abrasive and paints Monitoring and controlling product stabilityμ=2εr ε0ζ3ηf (κα)Stern layerPositively Charged ParticleThe traditional ELS converts the correlated scattering signals into frequency distribution and then calculates the frequency shift Δf of the scattered light, compared with the reference light. Phase analysis light scattering (PALS), an advanced technology based on the traditional ELS technology, has been further developed by Bettersize Instruments Ltd. to measure zeta potential and its distribution of a sample.By analyzing the phase information Φ of the original scattered signal, PALS obtains the frequency information of that light. The phase shift dΦ/dt with time is proportional to the frequency shift Δf.PALS technology can suppress the influence of the Brownian motion of particles on the results, thereby providing higher statistical accuracy. In various applications, PALS can effectively measure the zeta potential of particles whose charge approaches the isoelectric point, for instance, particles with very slow electrophoretic mobility at a high salt concentration.Phase Plot of PALSZeta Potential DistributionZeta Potential (mV)Time (s)I n t e n s i t y (%)P h a s e (r a d )Guizhou Universityjust one click.”Scattered Light of MacromoleculesDebye Plot Static light scattering (SLS) is a technology that measures the scattering intensities, weight-average molecular weight (Mw) and second virial coefficient (A 2) of the sample through Rayleigh equation:where C is the sample concentration, θ is the detection angle, R θ is the Rayleigh ratio used to characterize the intensity ratio between the scattered light and the incident light at the angle of θ, Mw is the sample’s weight-average molecular weight, A 2 is the second virial coefficient, and K is a constant related to (dn/dc)2.During molecular weight measurements, scattering intensities of the sample at differentconcentrations are detected. By using the scattering intensity and Rayleigh ratio of a known standard (such as toluene), the Rayleigh ratios of samples at different concentrations are computed and plotted into a Debye plot. The molecular weight and the second virial coefficient are then obtained through the intercept and slope from the linear fitting of the Debye plot.Chemical engineering: characterization of polymers, micelles and supermoleculesPetroleum engineering: characterization of macromolecule additives and oil-displacing surfactants Life science: characterization of proteins, polypeptides, and polysaccharides Pharmaceuticals: research on aggregation and stability of drugsConformation of supermolecules, research on self-assembling aggregatesHunan Anxin Biological Co., Ltd.KC R θ=1M w+2A 2C K C /R θBeNano software comes with user-friendly interface, results previews, and various types of report pages.Standard Operating Procedure (SOP) ensures the completeness and accuracy of parameters duringmeasurementsMeasurement interface shows real-time information and results of various types Results and Statistics – automatic calculations of mean and standard deviation Statistics and Overlay – compares results from multiple runsOver 100 parameters available, 100% covering the needs for research, QA, QC, and production Life-long upgrades provided free of chargeFeatures······Phase Analysis Light ScatteringZeta potential and its distribution are available Analysis modelSmoluchowski Hückel CustomizedElectrophoretic Light ScatteringIntelligent selection and deletion of poor-quality dataResults of Z-ave particle size, PdI, particle size distribution, diffusion coefficient are available Analysis modelCumulants Universal CONTINDynamic Light Scattering······P h a s eTime (s)SampleOperatorTest TimeZ-ave (nm)Dispersant Viscosity (mpa.s)Attenuator Number Intensity Mode AnalysisAlgorithmCumulant ThresholdAverage Intensity (kcps)Intensity DistributionVolume DistributionNumber DistributionCumulants FittingMulti-exponential ResiduesStatistics ReportsIntensity(%)1 10 100 1000 100003530252015105Size (nm)1 10 100 1000 100002468101214— 60 nm STD-1— 60 nm STD-2— 60 nm STD-3— 60 nm STD-4— 60 nm STD-5— 60 nm STD-6Size (nm)Size (nm)0.050.10.150.20.250.30.70.60.50.40.30.20.1Time (µs)1 10 100 1000 10000 100000 1000000g2-11 10 100 1000 100000.050.10.150.20.250.30.4Intensity(%)Time (µs)g2-1Size (nm)Size (nm)Time (µs) Size (nm)1 10 100 1000 10000Size (nm)161412108642Particle StabilityHigh Zeta Potential· High repulsion force of particles · Stable particle systemLow or Zero Zeta Potential· Flocculation, aggregation, sedimentation · Unstable particle systemZeta potential is a key indicator of the stability of the particle system. With a high zeta potential, the repulsive force between particles is strong and the system tends to be stable. Alternatively, with a low zeta potential, the repulsive force between particles is weak, the particles are easy to agglomerate or flocculate, and the system stability is poor. The main factors affecting zeta potential include the dispersant pH, ionic strength (salt concentration) and the concentration of small molecule additives.The ionic strength of the dispersant is also one of the important factors affecting the zeta potential of theparticles. In general, a higher ionic strength will result in a stronger shielding effect, meaning the absolute value of the particle’s zeta potential is closer to zero, and a smaller electrophoretic mobility of the particle in the electricfield. It should be noted that some ions can be specifically adsorbed on the surface of the particles, which will additionally increase the amount of charge distributed on the surface of the particles.Z e t a P o t e n t i a l (m V )Z e t a P o t e n t i a l (m V )Conductivity (mS/cm)pH2 (B 22D can be 2, zeta potential, and k D , users can forces of the particles.2forces of the particles.Protein Suspensions and FormulationsThe stability of a protein suspension depends on the functional groups of the protein and the solution environment. By changing the components of the solution environment, a relatively stable protein formulation with fewer protein aggregates and good thermal stability could be obtained. Examining the intermolecular forces between proteins in a formulation through light scattering technology enables stability determination.The second virial coefficient A 2 (B 22) is calculated by analyzing the scattering intensity dependence on suspensions concentration in a static light scattering measurement. Typically, a larger B 22 corresponds to a higher stability, while a negative value of B 22 indicates a low stability system that is more likely to form aggregates.Another widely accepted technology, especially by the pharmaceutical industry, is to use dynamic light scattering to measure the diffusion coefficient of the suspension. The dependence of diffusion coefficient on the concentration may derive the DLS interaction parameter k D . Similar to B 22, a larger k D suggests higher stability of a protein formulation.Formulation 1· Formulation 2 Formulation 1· Formulation 2Formulation 2Formulation 1Dip cellDisposable Folded Capillary CellCapillary Sizing Cell5 cm electrode distance to avoid heating the sample, andprovide a more uniform electric fieldAvoid cross-contaminationSuitable for high-polarity particle systemsOptical path of 4 mm, capable of measuring samples witha maximum concentration of 40% w/vHigh-tech but disposable item with a low usage costEase of use - just dip the sample and testLow cost and disposable compared to low volume quartzcellExtremely low sample volume required (3-5 μL)Avoid large particle sedimentation and allow for largerparticle measurement up to 15 μmSmaller inner diameter of the capillary allows for a moreuniform temperature field, avoiding the effect of turbulenceor convection on the signal caused by the temperature fieldof the sampleShorter optical path (0.5 mm) - lower multiple lightscattering effects···········Disposable PS Cuvette Glass CuvetteDip Cell KitDisposable PS Cuvette(square opening)Folded Capillary CellGlass Cuvette(round opening)Disposable Micro-volumeCuvetteMicro-volume Glass Cuvette Capillary Sizing Cell KitChemicals Pharmaceuticals and Drug DeliveryAcademia Paints, Inks and CoatingsQuality is the core of how Bettersize conducts business, and is constantly verified by our customers and partners around the world. The latest technology and strict quality control system enable our instruments to operate error-free for more than 1,000 days on average.Over the past decades, Bettersize has provided every customer with product demonstration, installation, product training, software upgrade, spare parts replacement, and maintenance services. We also offer regular workshops and repair services to our business partners and distributors globally.At Bettersize, our mission is to provide the best-in-class particle sizing and characterization instruments and comprehensive solutions to our customers.Bettersize Instruments Ltd.Website: https:// Email: *******************Address: No. 9, Ganquan Road, Jinquan Industrial Park, Dandong, Liaoning, ChinaPostcode: 118009Tel: +86-415-6163800Fax: +86-415-6170645The product information in this brochure is subject to change due to technical innovation and performance upgrade without notice. This brochure is only for reference. If there is any inconsistency in future, please adhere to the actual product instead. Bettersize instruments shall not be responsible for errors contained herein.The Bettersize logo is trademark owed by Bettersize Instruments Ltd.。
zeta电位仪技术特点zeta电位仪是一种用于测量颗粒表面电荷的仪器。
它能够测量颗粒表面电位,从而得出颗粒的Zeta电位。
Zeta电位是一项重要的物理指标,它能够反映颗粒表面电荷的性质和分散液中的胶体稳定性。
Zeta电位仪采用激光多普勒技术和电动势测量技术,能够对各种样品进行准确的Zeta电位测量。
以下将对zeta电位仪的技术特点进行详细介绍:1. 激光多普勒技术zeta电位仪采用激光多普勒技术来测量被试颗粒粒径,一般称之为激光多普勒光散射。
激光多普勒技术是一种利用激光散射光产生的多普勒频移来测量物体运动速度的技术。
当颗粒在激光束中通过时,激光束会散射,散射光与激光束间产生多普勒频移,然后根据多普勒频移可以测出颗粒的流速、粒径等参数。
这种技术能够测量小颗粒的粒径和速度,用于测定悬浮颗粒的运动速度和分布,还可以对样品的颗粒形态、聚集情况等进行观察和分析。
2. 电动势测量技术除了激光多普勒技术,zeta电位仪还采用了电动势测量技术来测量颗粒表面的电位。
电动势测量技术是利用电极在颗粒液体界面处形成的电势差,测量颗粒表面电位的一种方法。
在电解质溶液中,离子受到电场力的作用因而形成带电层,带电层的厚度反映了表面电势。
zeta电位仪通过控制溶液中的离子浓度以及电场强度,精确测量颗粒表面的电位。
3. 强电场测量zeta电位仪在测量颗粒的Zeta电位时,通常会产生一些测量误差。
这些误差通常是由稀释剂、pH值、离子浓度等因素引起的。
为了在测量中更准确地消除这些误差,zeta电位仪通常会采用强电场测量技术。
强电场测量技术是利用强电场对颗粒带电层的影响来消除测量误差的技术。
在强电场作用下,颗粒的带电层会被压缩,从而使得颗粒表面电位更加准确地测量。
4. 自动化控制zeta电位仪的自动化程度较高,能够方便快捷地对样品进行处理。
在测量中,zeta电位仪能够自动加入稀释剂、调整pH值、控制离子浓度等。
同时,它还能够自动记录和分析测量结果,并输出报告。
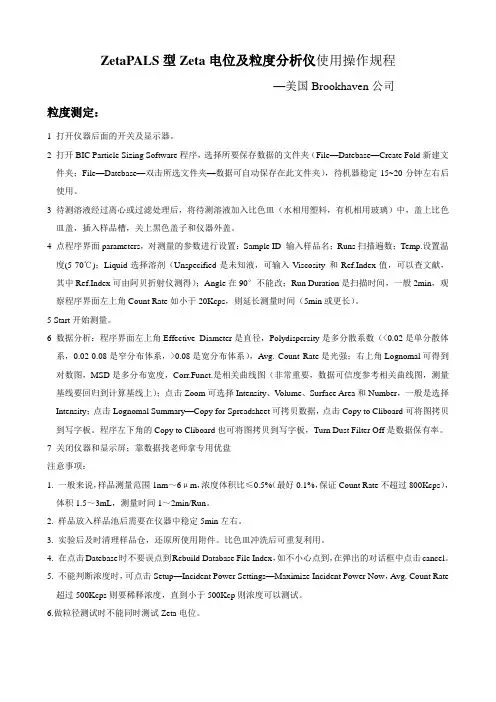
ZetaPALS型Zeta电位及粒度分析仪使用操作规程—美国Brookhaven公司粒度测定:1 打开仪器后面的开关及显示器。
2 打开BIC Particle Sizing Software程序,选择所要保存数据的文件夹(File—Datebase—Create Fold新建文件夹;File—Datebase—双击所选文件夹—数据可自动保存在此文件夹),待机器稳定15~20分钟左右后使用。
3 待测溶液经过离心或过滤处理后,将待测溶液加入比色皿(水相用塑料,有机相用玻璃)中,盖上比色皿盖,插入样品槽,关上黑色盖子和仪器外盖。
4 点程序界面parameters,对测量的参数进行设置:Sample ID 输入样品名;Runs扫描遍数;Temp.设置温度(5-70℃);Liquid选择溶剂(Unspecified是未知液,可输入Viscosity 和Ref.Index值,可以查文献,其中Ref.Index可由阿贝折射仪测得);Angle在90°不能改;Run Duration是扫描时间,一般2min,观察程序界面左上角Count Rate如小于20Kcps,则延长测量时间(5min或更长)。
5 Start开始测量。
6 数据分析:程序界面左上角Effective Diameter是直径,Polydispersity是多分散系数(<0.02是单分散体系,0.02-0.08是窄分布体系,>0.08是宽分布体系),Avg. Count Rate是光强;右上角Lognomal可得到对数图,MSD是多分布宽度,Corr.Funct.是相关曲线图(非常重要,数据可信度参考相关曲线图,测量基线要回归到计算基线上);点击Zoom可选择Intensity、Volume、Surface Area和Number,一般是选择Intensity;点击Lognomal Summary—Copy for Spreadsheet可拷贝数据,点击Copy to Cliboard可将图拷贝到写字板。
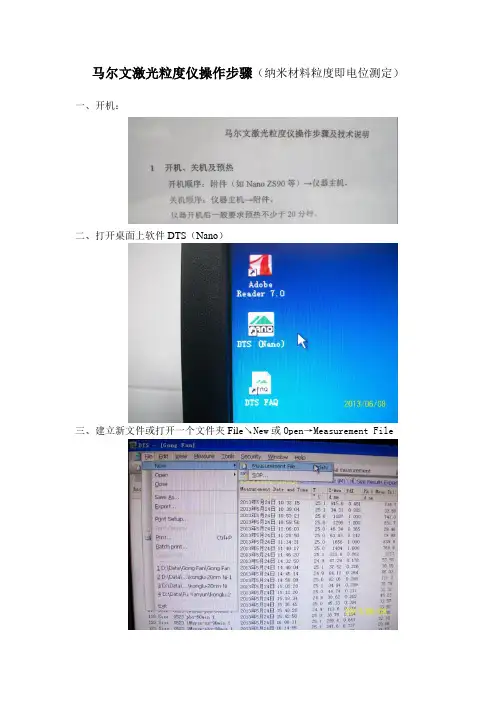
马尔文激光粒度仪操作步骤(纳米材料粒度即电位测定)一、开机:
二、打开桌面上软件DTS(Nano)
三、建立新文件或打开一个文件夹Fil e↘New或Open→Measurement File
四、文件一般建在D盘下Data文件夹里
五、调整试验目的(测粒度还是Zeta电位):View↘Workspaces→Size或Zeta
六、Measual↘Manual
七、继续调整试验目的(测粒度还是Zeta电位),同时给文档命名
①左键点击Measurement type: Zeta Potential,选择Size或Zeta Potential
②在“Sample name”下的空白栏里输入文档名,然后点击右下角“OK”
③全屏预览即:
八、放入样品:
灯闪显示绿色为正常测粒度(Size)用装样品小皿,加1ml纳米液放入时,倒置箭头朝测试人
测Zeta电位用装样品放入时,金属片朝两侧
装置,加0.6ml纳米液
盖上样品盖子及仪器盖子
九、点击“Start”
需要等待2分钟来平衡样本十、导出结果
①File↘Print...
②选择“Microsoft XPS Document Writer”
③保存,保存类型“XPS文档”(该文档就可以在自己电脑上打开了)。
马尔文zeta电位仪应用及原理马尔文zeta电位仪是一种常用于颗粒表面电荷特性研究的仪器。
它基于马尔文电位原理,通过测量悬浮颗粒的Zeta电位来实时监测颗粒的表面电荷情况。
本文将详细介绍马尔文zeta电位仪的应用及原理。
一、马尔文zeta电位仪的应用1. 悬浮液的稳定性研究:悬浮液中的颗粒表面电荷对于悬浮液的稳定性有重要影响。
马尔文zeta电位仪可用于研究不同悬浮液中颗粒的电荷特性,从而帮助理解和控制悬浮液的稳定性。
2. 界面电荷测量:马尔文zeta电位仪可以测量固体颗粒和流体之间的界面电荷,用于研究颗粒与流体界面的相互作用。
这对于理解颗粒在液体中的分散、吸附和沉降等过程具有重要意义。
3. 药物传递系统研究:马尔文zeta电位仪可用于研究纳米粒子等药物传递系统的表面电荷特性,从而帮助优化药物的传递效率和稳定性。
4. 矿物分离与浮选:马尔文zeta电位仪可用于矿石表面电荷特性的研究,帮助优化矿石的浮选工艺,提高矿石的选别效果。
5. 聚合物溶液及胶体体系研究:马尔文zeta电位仪可用于研究聚合物溶液和胶体体系中颗粒的表面电荷特性,对于理解和控制聚合物的分散性、聚集性和稳定性具有重要意义。
二、马尔文zeta电位仪的原理马尔文zeta电位仪的原理基于马尔文电位原理。
根据电化学理论,当固体颗粒在液体中悬浮时,其表面电荷会使液体中的离子在固体颗粒周围形成一个电荷层,称为电二层。
这个电二层的厚度和电荷密度可以通过测量颗粒的Zeta电位来获得。
马尔文zeta电位仪通过激光多普勒技术(laser Doppler electrophoresis)来测量颗粒的Zeta电位。
具体操作过程如下:1. 准备样品:将待测样品溶解在适当的溶剂中,制备悬浮液。
确保悬浮液中没有明显的沉淀或气泡。
2. 处理测量池壁:在测量池壁上涂上一层导电性的涂层,例如氧化铟锡(ITO)等,以确保测量时电荷能够在池壁上自由运动。
3. 放入样品:将准备好的悬浮液加入测量池中。
仪器名称:纳米粒度及Zeta电位分析仪
数量:1套,进口
用途:
测量颗粒粒度及分子大小、分子量、蛋白质电泳迁移率、胶体与纳米颗粒的ZETA电位,
还可选择性地测量蛋白质迁移率以及蛋白质与聚合物溶液的微观流变学。
技术指标:
1、粒度测量范围:0.5nm~10μm
2、激光光源:高稳定光源
3、检测器:采用APD检测器
4、温度控制:不窄于0~70 ℃, ±0.2℃
5、用于仪器控制、测量及数据分析软件一套
配件:
1、Zeta电位测试电极 两个
2、石英样品池 10个
3、聚苯乙烯样品池 200个
4、品牌电脑 1台