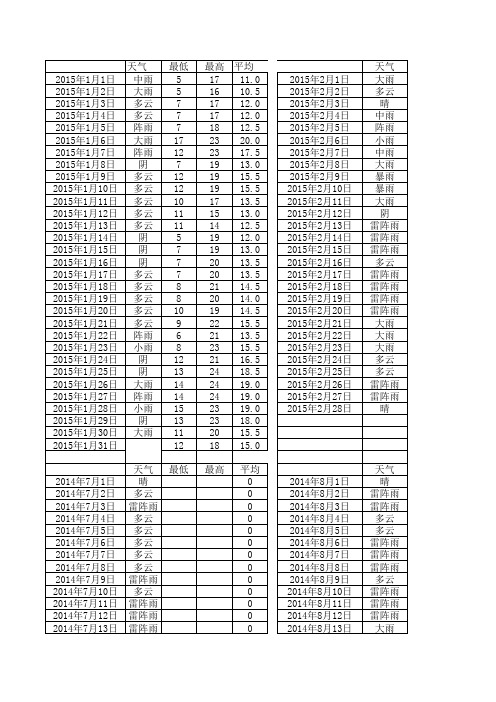
2014年全年南京天气记录
- 格式:xlsx
- 大小:41.10 KB
- 文档页数:2

中国历年冬天平均气候1、中国气象局监测显示,2013—2014年冬季,中国平均气温为-4.7摄氏度,是1987年以来的最低值这是指在这段时间里的平均气温为零下4.7度(是指所有的测站数据的平均值之后的再平均得出来的)。
2、全国各大城市的年平均温度城市夏季平均温度年平均温度冬季平均温度城市夏季平均温度年平均温度冬季平均温度北京 26.1 11.8 -4.6 杭州 28.1 15.8 4.7天津 25.2 12.2 -4.2 福州 28.9 19.3 11.6石家庄 27.4 13.3 -2 郑州 27.2 14.2 0.3南京 27.7 15.6 -2.7 武汉 29.1 16.5 4.3兰州 23.4 9.5 -4.1 长沙 28.9 17.25 4.7银川 24.1 8.4 -7.2 南昌 28.6 17.8 8.4济南 28.2 14.6 -0.4 南宁 28.3 21.7 13.7西安 27.36 13.7 0 广州 28.5 21.8 14.2太原 24.2 9.9 -5.2 成都 25.8 16.6 6.2西宁 14.7 5.1 -8 重庆 29 17.8 8乌鲁木齐 24.1 5.7 -13 昆明 21.1 20.6 9.4呼和浩特 23.7 6.2 -11.4 贵阳 23.6 19.9 4.9哈尔滨 24.3 4.4 -17.2 拉萨 15.8 7.9 0.8长春 24.5 5.1 -15.2 合肥 28 15.3 2.5沈阳 25.6 7.8 -12 上海 28.6 17.9 4.7大连 24.4 10.8 -3.8 香港 28 23.3 15海口 29.1 23.8 -18.8 澳门 28.5 22.3 14.53、天津地区历年冬季平均气温是多少度?多年历史统计,天津12月、1月、2月平均气温分别为-0.8、-3.1和 -1.0℃,也就是冬季平均气温为-1.6℃。
由于统计资料起止时间不同可能有微小差异,但应该相差不大。
Climate Change Research Letters 气候变化研究快报, 2020, 9(5), 570-575Published Online September 2020 in Hans. /journal/ccrlhttps:///10.12677/ccrl.2020.950622014年南京市一次强雷暴天气过程分析杨杰尧哈密市气象局,新疆哈密收稿日期:2020年9月5日;录用日期:2020年9月20日;发布日期:2020年9月27日摘要本文利用常规气象观测资料、NCEP 1˚ × 1˚再分析资料、闪电资料以及多普勒雷达资料,对南京市2014年9月28日一次强雷暴天气过程进行分析。
结果表明:(1) 雷暴发生前南京数日持续高温累积了大量不稳定能量是先决条件,冷空气南下触发不稳定能量的释放是触发机制。
(2) 此次雷暴为湿雷,以负闪为主(占93%)。
强对流天气集中在北部和中部,其中中西部为闪电密集区。
(3) 强烈的上升运动以及高空辐散、低空辐合的配置为动力学机制;较强的水汽输送和高的相对湿度提供了良好的水汽条件;稳定性指数表明此次雷暴过程是强动力和强动热力不稳定条件共同作用的结果。
(4) 强雷电区雷达特征表现为回波强度维持在45 dBz以上,风廓线表现为低层为偏东风,中低层为偏西风,回波顶高度维持在14 km 左右,零速度线呈明显的“S”形。
关键词强雷暴,闪电特征,多普勒雷达,气象物理量参数Analysis of a Severe Thunderstorm Weather in Nanjing in 2014Jieyao YangHami Meteorological Bureau, Hami XinjiangReceived: Sep. 5th, 2020; accepted: Sep. 20th, 2020; published: Sep. 27th, 2020AbstractA strong thunderstorm weather process on September 28, 2014 in Nanjing is analyzed by using theconventional meteorological observation data and NCEP 1˚ × 1˚ reanalysis data, lightning data and Doppler radar data. The results showed that: (1) before the occurrence of the thunderstorm, the high temperature persisting in Nanjing region was found, which had cumulated mass instable ener-杨杰尧gy that should be seen as the prerequisite, and the southward cold air stirred up this instable energy, which was the induced factor of this thunderstorm. (2) The process is wet thunderstorm, and nega-tive flashes account 93 percent. Strong convection weather was concentrated in northern and cen-tral area of Nanjing, the Midwest is intensive lightning zone. (3) The upper divergence and low-level convergence and strong upward movement are the dynamic mechanism of the thunderstorm. Strong water vapor transport and high relative humidity provided good moisture conditions. The results of the analysis of the stability index show that the thunderstorm is the result of the common function of the strong dynamic instability and thermal instability. (4) Radar features in the strong lightning re-gion show that the echo intensity is maintained above 45 dBz, the wind profile shows that the low level is the east wind, the middle and low level is the west wind, the echo top height is maintained at about 14 km, and the zero velocity line shows an obvious “S” shape.KeywordsStrong Thunderstorm, Lighting Treasure, Doppler Radar, Parameters of Weather PhysicsThis work is licensed under the Creative Commons Attribution International License (CC BY 4.0)./licenses/by/4.0/1. 引言雷暴是江淮地区发生频率较高的灾害性天气之一,多为具有强降水特征的雷暴,产生以负极性地闪为主的放电。

1961~2004年南京市夏季气温变化特征分析兰渝;赵现斌;安豪【摘要】[目的]分析1961 ~2004年南京市夏季平均气温、最高气温、最低气温的变化特征.[方法]利用高淳站、江宁站、江浦站、溧水站、六合站、南京站6个气象站点1961 ~2004年的日平均气温、日最高气温、日最低气温数据,采用统计分析方法,对南京夏季的平均气温、最高气温、最低气温、≥35℃高温日数和热积温的变化特征进行研究.[结果]1961 ~2004年南京夏季平均气温、最高气温、最低气温均呈现增温趋势,热积温数值虽有明显上升,但高温天数并没有显著增长;20世纪60年代是一个夏季高温期,而70、80年代夏季气温有所下降,80年代是夏季气温最低的时期,90年代和2000~2004年的平均值普遍提高,90年代以后是一个夏季变热的时期.[结论]酷暑主要分布在60年代,凉夏主要分布在70、80年代.%[Objective]To analyze the variation characteristics of the average temperature,maximum temperature and minimum temperature in Nanjing for summer during 1961-2004.[Method] The daily mean temperature,daily maximum temperature,daily minimum temperature data of six weather stations in Gaochun station,Jiangning station,Jiangpu station,Lishui station,Liuhe station and Nanjing station during 1961-2004 were used to research the variation characteristic of average temperature,maximum temperature,minimum temperature,days with temperature ≥35 ℃ and hot accumulated temperature by statistical analysis method.[Result]The average temperature,maximum temperature and minimum tempera ture of summer temperature in Nanjing during 1961-2004 showed warming trend,although the numerical hot accumulated temperature had increasedsignificantly,there was no significant increase in the number of high temperature days.The 1960s was a summer high temperature period,the summer temperature dropped in the 1970s and the 1980s,the 1980s was the lowest summer temperature period,the average temperature rose in the 1990s and 2000-2004;after the 1990s,summer temperature began hotter and hotter.[Conclusion] Hot summers were mainly distributed in the 1960s,while cool summers were mainly distributed in the 1970s and the 1980s.【期刊名称】《安徽农业科学》【年(卷),期】2016(000)002【总页数】4页(P234-237)【关键词】南京;夏季气温;高温日数;热积温;变化特征【作者】兰渝;赵现斌;安豪【作者单位】解放军理工大学气象海洋学院,江苏南京211101;解放军理工大学气象海洋学院,江苏南京211101;解放军理工大学气象海洋学院,江苏南京211101【正文语种】中文【中图分类】S161.2+2近几年来地球表面气候正经历一次显著的变化,全球气候变暖现象愈发显著,我国的气候变化趋势与全球气候变化基本一致。
近44年南京温度变化的特征及其可能原因的分析近44年南京温度变化的特征及其可能原因的分析引言:南京市位于江苏省,是一个典型的亚热带季风气候区域,其温度变化对于了解亚热带地区气候变化具有重要意义。
本文将对近44年南京温度的变化特征进行分析,并探讨其可能的原因。
一、南京温度的变化特征近44年来,南京的气温呈现出一些变化特征。
首先是整体呈现出上升趋势。
根据近期的观测数据显示,南京的年均气温大约增加了0.5-0.7℃,表明南京的气温在逐渐升高。
其次,南京的温度变化在季节上也表现出一定的特点。
夏季气温上升较快,相对于其他季节,夏季的气温变化更加明显;而冬季的气温也出现了一定的升高,但相对较为平稳。
最后,近年来南京的气候也更加极端。
热浪和冷空气等极端天气事件的频率和强度都有增加。
二、南京温度变化的可能原因那么,造成南京气温变化的可能原因是什么呢?以下是一些可能的原因:1. 全球气候变暖:全球气候变暖是近年来备受关注的问题。
南京温度的上升可能是全球气候变暖的结果。
全球温室气体的排放以及人类活动对环境的影响,如工业排放、森林砍伐等,导致大气中二氧化碳浓度的增加,引发全球气温上升。
2. 都市化影响:南京作为一个发达的大城市,都市化进程的加快也可能对其温度产生影响。
城市化过程中的建筑、道路和人口等因素都会影响城市气温的分布。
城市化的高密度发展导致城市热岛效应的加剧,即城市中心的温度比郊区高出许多。
这意味着南京市中心的温度可能比周边地区更高。
3. 自然因素:自然因素也可能是南京温度变化的原因之一。
例如,气候系统的自然变异、太阳活动周期和全球大气环流的变化都可能对南京的气温产生影响。
由于这些因素的影响是复杂且多样的,因此还需要进一步的研究和观测。
结论:综上所述,近44年南京温度变化呈现出上升趋势,夏季气温上升较为明显,而冬季的气温相对平稳。
造成南京温度变化的原因可能包括全球气候变暖、都市化影响以及自然因素。
为了更好地了解南京温度变化的原因,我们需要进一步研究和观测,加强气象数据的收集与分析,以更好地适应未来可能出现的气候变化综上所述,南京市近44年来的温度变化呈现出上升趋势。