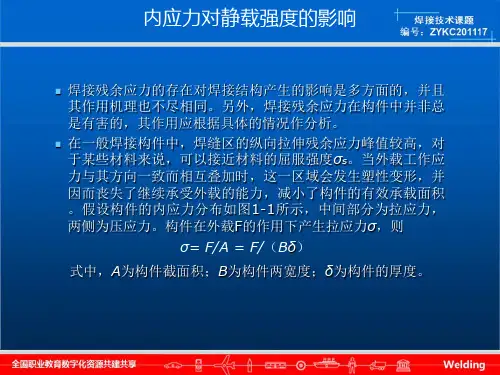
横向残余应力的分布华侨大学
- 格式:ppt
- 大小:406.50 KB
- 文档页数:7
毕业设计题目:工字钢焊接顺序对变形影响的研究院(系)别:机电及自动化学院专业:机械电子届别:2011届学号:***********名:**指导老师:周广涛讲师华侨大学教务处2011年6月摘要铝合金簿板结构在焊接是存在焊后残余应力大和焊接变形严重等问题,从而限制其应用范围。
因此减小结构上的焊后残余应力和焊接变形具有重要意义。
本文利用有限元模拟铝合金薄板的焊接变形,对厚度为2mm的铝合金薄板焊后变形结果进行分析。
在焊接过程中,焊接区域经历一个复杂的不均匀快速加热和冷却过程,这必然引起焊缝和热影响区发生不均匀的应力应变变化,这种不均衡的应力应变导致焊后形成残余应力和变形的主要原因。
薄壁构件在焊接过程中的变形表现出了特殊性,由于薄壁构件的弯曲刚度小,因此焊后薄壁构件易出现挠曲变形。
焊接热源的局部加热使得焊缝和周围金属产生不均匀的膨胀和收缩,形成残余应力。
对于对接焊缝,纵向残余应力的分布为焊缝附近一定宽度区域为拉应力、两侧区域为压应力,薄板在压应力作用下会发生压曲失稳,当两侧焊接残余压应力大于焊件失稳临界压应力时就会造成焊件的失稳变形。
焊接过程的数值模拟有助于人们从更深层次上理解焊接过程的物理实质,模拟的结果有利于实现对焊接过程的控制。
利用数值方法计算焊接热过程,还可为合理选择焊接方法和工艺参数以及进一步进行冶金分析和动态应力应变分析奠定基础。
模拟铝合金薄板焊接,采用双椭球热源分布模式,基于Marc软件平台,建立了运动电弧作用下焊接过程的有限元数值分析模型,较好的模拟了铝合金薄板焊接变形和整个温度场的变化,对模拟的动态过程进行分析,为以后焊接变形的准确分析起到了参考作用。
关键词:铝合金薄板,焊接变形,温度场,数值模拟ABSRACTAluminum alloy thin plate welding in the welding residual stress exists in Congress and the weiding deformation of serious problems, limiting its scope of application. Therefore reduce the structural welding residual stress and welding distortion is important. Using the finite element simulation of welding deformation of aluminum alloy sheet of shickness of 2mm aluminum plate after welding deformation analysis of the results.In the welding process,welding through a complex uneven regional rapid heating and cooling process, which inevitable lead to weld and heat affected zone of uneven changes in stress and strain, this imbalance in the stress strain caused the formation of residual stress after welding and deformation of the main reasons.Thin-wall components in the welding process of deformation showed specificity, since the bending stiffness of thin-walled components is small, so after welding thin-walled structures prone to deflection. Welding heat source and the local heating around the weld metal makes the non-uniform expansion and contraction, the formation of residual stress. For butt welds, the longitudinal residual stress distribution of a certain width of the region near the weld tensile stress, compressive stress on both sides of the region, sheet in compressive stress occurs under the buckling instability, when both sides of welding residual stress is greater than Weldment instability when the critical stress will cause instability of deformation of weldments.Numerical simulation of welding process helps people from higher level to understand the physical essence of the welding process, the simulation results are conducive to the control of the welding process.Numerical method used welding thermal process, can also be a reasonable choice for the welding method and process parameters as well as further metallurgical analysis and lay the foundation for the dynamic stress and strain analysis. Simulation of welding aluminum alloy sheet, using double ellipsoid heat source distribution model, based on Marc software platform, set up under the action of the movement arc welding process, finite element analysis model, a better simulation of the aluminum alloy sheet welding deformation and the temperature field , on the analysis of dynamic process simulation for accurate analysis ofthe deformation after welding plays a reference.Keywords: thin aluminum alloy plate, the welding deformation, temperature field, numerical simulation目录第一章绪论 (3)1.1课题背景 (3)1.2焊接变形数值模拟的基础 (3)1.2.1焊接变形数值模拟概述 (3)1.2.2焊接变形数值模拟分析的方法 (4)1.2.3焊接变形数值模拟的意义 (5)1.3有限元方法介绍 (5)1.4焊接温度场数值模拟发展研究现状 (6)1.5焊接变形数值模拟发展研究现状 (7)1.6薄板结构的焊接残余应力及变形研究 (7)1.7控制焊接应力和焊接变形的方法研究 (8)1.8主要研究内容 (8)第二章焊接数值模拟建模 (9)2.1实验材料 (9)2.2焊接数值模拟建模 (9)2.2.1有限元模型的建立 (9)2.2.2有限元网格划分 (10)2.2.3施加材料性能 (10)2.2.4建立焊接路径.... (11)2.2.5初始条件和边界条件 (11)2.2.6焊接热输入边界条件 (12)2.2.7散热边界条件 (13)2.2.8力学边界条件 (13)第三章焊揍残余应力和变形数值模拟分析 (16)3.1铝合金薄板焊接温度场的模拟分析 (16)3.2铝合金薄板焊件残余应力的模拟结果分析 (18)3.3铝合金薄板焊件残余变形模拟结果分析 (20)3.4其他变形计算 (21)3.4.1横向收缩量的计算 (21)3.4.2纵向收缩量的计算 (22)第四章常规焊接残余应力和变形实验分析 (23)4.1焊接工艺的确定 (23)4.2常规焊对残余应力的影响 (23)4.3常规焊对纵向挠曲变形的影响 (24)4.4常规焊对焊缝两侧横向位移的影响...............................26 第五章结论 (29)致谢参考文献附录第一章绪论1.1课题背景近几年来,随着科学技术的迅速发展,焊接工字钢由于较混凝土结构具有施工周期短、结构简单、经济美观的优点,在工业及民用建筑中的应用越来越广泛。

残余应力在复合材料中的分布特性残余应力在复合材料中的分布特性复合材料是一种由两个或多个不同材料组合而成的材料,具有很高的强度和刚度。
在制备过程中,残余应力是一个重要的参数,它对于复合材料的性能和使用寿命有着重要影响。
本文将通过逐步思考的方式,介绍残余应力在复合材料中的分布特性。
首先,我们需要了解残余应力是如何形成的。
在复合材料的制备过程中,通常会采用纤维增强材料和基体材料进行层叠,然后通过热固化或压力固化等方法进行固化。
在固化过程中,由于纤维和基体材料的热膨胀系数不同,热收缩不均匀,导致残余应力的产生。
其次,残余应力在复合材料中的分布是不均匀的。
在复合材料的表面附近,由于固化过程中表面的冷却速度较快,残余应力较小。
而在复合材料的内部,由于固化过程中内部冷却速度较慢,残余应力较大。
因此,复合材料的内部通常会出现较高的残余应力。
然后,残余应力的分布也与复合材料的结构有关。
在复合材料中,纤维的方向性会导致残余应力在不同方向上的变化。
通常情况下,纤维的方向与残余应力的分布呈现正相关关系。
也就是说,在纤维的方向上,残余应力较大;而在纤维之间或垂直于纤维方向上,残余应力较小。
最后,残余应力的分布会对复合材料的性能产生影响。
由于残余应力的存在,复合材料可能会出现弯曲、扭转、剪切等失稳现象,从而导致材料的破坏。
此外,残余应力还会影响复合材料的疲劳寿命和断裂韧性等力学性能。
总结起来,残余应力在复合材料中的分布特性是一个复杂而重要的问题。
它受到纤维和基体材料的热膨胀系数差异、固化过程中的冷却速度、纤维方向性等因素的影响。
了解残余应力的分布规律对于优化复合材料制备工艺、改善材料性能具有重要意义。
钢桁梁桥主桁杆件厚板焊接残余应力空间分布试验研究强斌;李亚东;顾颖;邹永丰【摘要】为研究某钢桁梁桥主桁杆件钢厚板焊接残余应力的空间分布规律,采用与实桥相同的材料和焊接工艺制作30 mm厚的对接焊试板,用局部逐层去除盲孔法对试板表层及内部残余应力进行测试,并对测量结果进行不确定度评定.试验结果表明:厚板表面焊接残余拉应力峰值位于焊缝附近区域,残余应力呈典型的拉-压分布趋势;内部横向残余应力在焊缝附近的分布状态为外拉内压,并且在上表层具有较大的应力梯度;内部纵向残余应力在焊缝附近为拉应力;随着距焊缝中心线距离的增加,纵横向残余应力皆开始逐渐减小,直至转变为压应力.【期刊名称】《铁道学报》【年(卷),期】2019(041)003【总页数】6页(P128-133)【关键词】钢桁梁桥;主桁杆件;厚板对接焊;焊接残余应力;空间分布【作者】强斌;李亚东;顾颖;邹永丰【作者单位】西南交通大学土木工程学院,四川成都 610031;西南交通大学土木工程学院,四川成都 610031;西南科技大学土木工程与建筑学院,四川绵阳 621010;中铁二院工程集团有限责任公司,四川成都 610031【正文语种】中文【中图分类】U441.5焊接钢桥由于其具有跨越能力大、设计造型灵巧、施工质量可靠、架设速度快等特点,近年来被大量兴建。
钢桥构件在焊接时,焊缝及其周边金属会经历不均匀的局部快速加热和冷却,同时伴随着金属相变,以致在焊后的焊接接头中不可避免产生数值较大的残余应力。
焊接残余应力的存在不仅会降低焊接结构的强度、尺寸稳定性,同时也会诱导疲劳裂纹的萌生和扩展,降低构件疲劳寿命[1-2]。
因此,对于钢桥焊接残余应力分布状态的研究,越来越受到人们的重视。
近年来国内外学者相继开展了针对钢桥焊接构件的残余应力测试试验。
大橋治一等[3]在多多罗大桥钢主梁设计前,采用切条法对面板厚度分别为8 mm和12 mm,U肋厚度8 mm的U肋加劲板,进行了残余应力测试。
Distribution of Compressive Stresses in Transversely Posttensioned Concrete Bridge Decks J.Paul Smith-Pardo,M.ASCE1;Julio A.Ramirez,M.ASCE2;and Randall W.Poston,F.ASCE3Abstract:A parametric study was carried out in order to understand the salient aspects affecting the distribution of compressive stresses in transversely posttensioned concrete bridge decks.Alternativefinite element modeling techniques and alternative software were considered and the corresponding analytical results were compared with the experimental results from previous investigations.It was found that the distribution of compressive stresses is mainly affected by the support conditions of the girders and the axial stiffness of the diaphragms.DOI:10.1061/͑ASCE͒1084-0702͑2006͒11:1͑64͒CE Database subject headings:Finite elements;Model tests;Superstructures;Stress distribution;Bridge decks;Bridges,concrete.Research SignificanceDurability problems in reinforced concrete bridge decks are an ongoing concern for Departments of Transportation͑DOTs͒in the United States.Corrosion of reinforcement is considered the most significant source of deterioration in concrete decks in the United States.Limiting the service load stresses below the cracking level should improve the long-term performance of the deck.An earlier study investigating the use of transverse posttensioning as a mean of delaying the initiation of reinforcement corrosion in concretedecks was conducted at the University of Texas,Austin,Tex.͑Almustafa1983;Mora1983;Poston1984;Ralls1984͒.From this research,design specifications were proposed for the useof transverse posttensioning as a mechanism to control crackingin the longitudinal direction of the deck.The specifications werepublished in a special report of the Precast/Prestressed ConcreteInstitute(PCI)Journal͑Poston et al.1989͒as proposals to modify the existing American Association of State Highway and Transportation Officials͑AASHTO1983͒provisions. However,major limitations of the design specifications from the Texas study were the exclusion of the effect of the position of the diaphragms,and the effect of the support conditions for the girders on the distribution of transverse stresses induced from posttensioning.Moreover,the provisions were derived based on the results from afinite element analysis program with limitations on the number of elements.In this paper,the problem of modeling transversely posttensioned deck-on-girder superstructures usingfinite element͑FE͒analysis is critically addressed by comparing the results from alternative techniques suggested in the literature against experimental results.In addi-tion,the variables not considered in the Texas study are taken into account and incorporated into an extensive parametric study whose results can be used to specify a scheme of transverse posttensioning of decks for crack control in the design. IntroductionThe fundamental question to be answered is:how are transverse stresses distributed on the top surface of a concrete bridge deck that is subjected to a uniform transverse posttensioning applied at the edges.It is also desirable to determine the parameters signifi-cantly affecting such distribution of transverse stresses because some insight can be gained about the required magnitude and distribution of applied posttensioning to reach the condition of low or no tensile stresses on the deck under superimposed service loads.Modeling of Deck-on-Girder SuperstructuresAlternatives for modeling deck-on-girder superstructures range from closed-form solutions of particular cases͑Westergaard 1930;Duberg et al.1960;Cao and Shing1999͒to numerical solutions͑Chen et al.1957͒,and somewhat more recently to modeling techniques.Whereas in two-dimensional͑2D͒FE models͑Mabsout et al.1999͒the elements representing the deck,the girders,and the diaphragms are located in the same plane,in three-dimensional͑3D͒FE models͑Bishara and Elmir 1990;Bishara et al.1993;Mabsout et al.1997;Chan and Chan 1999͒,these elements are located in different planes and are connected through rigid links.The most notorious deficiency of the2D models in relation to3D FE models is that the eccentricity1Engineer,Berger/Abam Engineers Inc.,333019th Ave.South, Suite300,Federal Way,WA98003;formerly,Instructor,School of Civil Engineering,Purdue Univ.,West Lafayette,IN47906͑corresponding author͒.E-mail:paul.smith@2Professor,School of Civil Engineering,Purdue Univ.,West Lafayette,IN47906;formerly,Assistant Head;E-mail:ramirez@ 3Fellow,Prin.Whitlock Dalrymple Poston Associates;402W.7th St., Austin,TX78701.E-mail:rposton@Note.Discussion open until June1,2006.Separate discussions must be submitted for individual papers.To extend the closing date by one month,a written request must befiled with the ASCE Managing Editor. The manuscript for this paper was submitted for review and possible publication on November11,2003;approved on March16,2005.ThisFour distinct3D FE analysis techniques appropriate for the modeling of deck-on-girder superstructures are found in the literature and are described as follows:1.Type I:Girders and diaphragms are modeled as frameelements rigidly connected to the deck.The deck is modeled with shell elements.2.Type II:Top and bottomflanges and webs of girders aremodeled as frame elements.Diaphragms and deck are mod-eled as shell elements.Elements are connected through rigid links.3.Type III:Topflanges of girders and diaphragms are modeledas frame elements rigidly connected to the deck.Webs of girders and deck are modeled using shell elements.4.Type IV:Girders and diaphragms are modeled with solidbrick elements͑three translations at every node͒,and the deck is modeled with shell elements.Evaluation of Alternative Finite Element Models Using Experimental ResultsTo evaluate the accuracy of each modeling alternative with respect to the calculated distribution of stresses induced from edge transverse posttensioning of the deck,a test specimen from the Texas study͑Mora1983;Ralls1984;Poston et al.1989͒was considered.The geometric characteristics of the test speci-men are shown in Fig.1.The applied transverse posttensioning at the edges was about 4.1MPa͑0.6ksi͒and consisted of 6.3mm seven-wire strand tendons͓1,750MPa͑250ksi͔͒spaced at140mm,except in549mm wide regions over the diaphragms where the spacing was halved and thus the applied transverse posttensioning was about8.2MPa͑1.2ksi͒.The higher transverse stress applied over the diaphragms was intended to overcome deck.Tendons were straight and their resultant force was assumed concentric with respect to the centerline of the concrete slab.Only one half of the span of the deck was transversely posttensioned in the Texas specimen.Two diaphragm arrange-ments were tested:thefirst,which will be referred to as the all-diaphragm case,included both interior and end diaphragms; and the second,which will be referred to as the end-diaphragm case,included end diaphragms only.Stresses in the experimental program were inferred from strain gage readings assuming a constant modulus of elasticity for concrete͑Almustafa1983; Ralls1984͒.The computer program SAP2000was used to represent the test superstructure using modeling alternatives2D and3D Types I–III.The computer program ANSYS5.7was used for modeling alternative Type IV.The calculated distribution of transverse stresses,using three-dimensional Type I FE modeling, is shown in Fig.2with contour lines for the half of the deck that was transversely posttensioned.Experimental values for the stresses on the top surface of the deck are indicated in the same figure with dots.The comparison of experimental and calculated stresses is summarized in Table1for the different FE modeling techniques.Error is defined as the difference between the calcu-lated and measured value divided by the measured value at a given location.Positive errors correspond to overestimations of the experimental values.The mean error is computed based on the absolute values of individual errors.The maximum over-estimations and underestimations are also indicated in Table1. Minimum overestimations and underestimations were almost zero ͑less than4%͒for all modeling alternatives and thus are not reported.The values presented in Table1suggest that that there is no significant difference in the estimation of induced transverse stresses when using any of the FE modeling alternatives evalu-Fig.1.Test structure from Texas studythe all-diaphragm and for the end-diaphragm cases.The results show that the analytical models overestimate the measured values at certain locations but underestimate at other locations.Table 1also indicates that modeling the eccentricity of the posttensioning does not have a significant effect on the distribution of transverse stresses.Parametric StudyAn extensive parametric study was conducted as part of the research project carried out at Purdue Univ.͑Smith-Pardo and Ramirez 2002͒.The base structure for the parametric study,depicted in Fig.3,is similar to the prototype in the Texas study ͑Poston et al.1989͒.It consisted of a deck-on-girder superstructure having a span length of 23,200mm ͑76ft ͒and a deck width of 17,700mm ͑58ft ͒.The superstructure had seven girders,two interior diaphragms,and two exterior diaphragms.Girders were C-type standard Texas Department of Highways and Public Transportation ͓f c Јϭ35MPa ͑5ksi ͔͒at 7,400mm ͑24.3ft ͒and 7,700mm ͑25.3ft ͒.The deck ͓f c Јϭ35MPa ͑5ksi ͔͒was 210mm ͑8.25in.͒thick.Each girder was supported on unreinforced elastomeric bearing pads at both ends.Each bearing was modeled as a roller with two mutually perpendicular springs representing the shear stiffness of the elastomeric pads.One of the springs is oriented in the longitudinal ͑traffic ͒direction and the other in the direction perpendicular to the traffic ͑parallel to the diaphragms ͒.The interaction between the two springs is neglected in the analyses.Elastomeric bearing pads had b ϭ305mm ͑12in.͒ϫw ϭ508mm ͑20in.͒cross sections and a thickness h ϭ102mm ͑4in.͒.The shear modulus was assumed as G ϭ1.2MPa ͑170psi ͒.The corresponding shear ͑spring ͒stiffness is calculated as K s =Gbw /h ϭ1.8kN/mm ͑10kip/in.͒in each direction.The expression for K s is easily derived by assuming small deformation of the elastomeric bearings in shear only ͑Poston 1984͒.Three-dimensional Type I FE modeling was used for the analyses.The choice of this modeling technique was arbitrary as the evaluated modeling alternatives produced similar results.Unlike the Texas study ͑in which the applied stresses in zones of the deck above the diaphragms were twice those at other zones ͒,all the structures defined in the parametric study were subjected to a uniform unit compressive stress applied along the edges of the deck.The choice of a uniform distribution of applied stresses is convenient because it avoids introducing variables such as the width and the magnitude of the applied stresses in zones of the deck above the diaphragms.For the parametric study transverse stresses were evaluated along four types of lines on the surface of the deck defined as follows ͑Fig.3͒:1.Strip 1͑S1͒:located on the top surface of the deck along enddiaphragms;2.Strip 1͑S2͒:located on the top surface of the deck halfwaybetween an end diaphragm and adjacent interior diaphragms;Table 1.Error ͑%͒in Calculated Transverse Stresses on Top Surface of Deck Relative to Experimental Results from Texas Specimens Errora2D 3D Type I 3D Type II 3D Type III3D Type IV ͑a ͒All diaphragm caseMean b1614141412Maximumunderestimation −40−38−38−42−36Maximum overestimation 2730323223͑b ͒End-diaphragm case Mean1514141413Maximumunderestimation−26−28−28−28−28Maximum overestimation 3131292928aError ϭ͑calculated stress-measured stress ͒/measured stress ϫ100%.Measured stress ϭstrain gage reading ϫelastic modulus of deck’s concrete.bMean error ϭaverage ͑absolute value of individual errors ͒.Fig.2.Calculated and measured stresses for Texas structure4.Strip 4͑S4͒:located on the top surface of the deck between consecutive interior diaphragms that are closer to the end of the deck.Along a particular line,transverse stresses were calculated every 610mm ͑2ft ͒as this corresponded to the grid size in the finite element model.For each line,the minimum and the mean stresses were reported.The minimum transverse stress is of major importance from the point of view of design,because its magnitude should be sufficient to prevent longitudinal crack-ing of the deck under service loading.In the discussion that follows,transverse stress refers to that oriented perpendicular to the direction of the traffic ͑i.e.,perpendicular to the direction of the girders ͒.Contours of Induced Transverse Stresses for Base Case StructureThe resulting distribution of transverse stresses on the top surface of the deck for the base case structure is shown in Fig.4with contour lines.Because of symmetry,only one quarter of the deck is shown.From Fig.4it is important to notice that the magnitude of the induced compressive stress near the end of the deck is significantly smaller than that in zones near midspan.Although the space limitation for this paper makes it impossible to show individual contour maps for each case considered in the parametric study,it should be mentioned that the topology of the distribution of transverse stresses is similar to the one shown in Fig.4in all cases while the magnitudes change significantly.Effect of Number of DiaphragmsThe base case illustrated in Fig.3was consecutively modified by changing the number of interior diaphragms in the superstructure.Fig.3.Base structure for parametricstudyFig.5shows the variation of the calculated minimum and average transverse stresses at different strips as a function of the number of diaphragms.It can be seen that there is not a signifi-cant change in the distribution of transverse stresses with the number of interior diaphragms.In Strips2–4the average and the minimum stresses are similar to each other.This suggests that there is a uniform distribution of induced stresses in regions of the deck away from the ends regardless of the number of diaphragms. The minimum and average stresses along any of the strips do not significantly decrease as the number of diaphragms is increased. This suggests that,for the domain of the foregoing parametric study,the restraining effect of each individual diaphragm can be considered localized͑i.e.,independent from the restraining effect of other diaphragms͒.This is a relevant observation that may allow prescribing different levels of posttensioning at different diaphragm regions for design purposes.It is also observed from Fig.5that the minimum and the average top transverse stress in regions of the deck above the end diaphragm͑S1͒are signifi-cantly smaller than the corresponding stresses in regions above interior diaphragms͑S3͒.This can be explained by noticing that:͑1͒the restraining effect imposed by the supports of the girders is more significant near the ends of the deck;and͑2͒the effective width of the deck tributary to end diaphragms is smaller than that for interior diaphragms,thus the resultant applied eccentric loadis higher͑and so are the stresses on the deck͒for the compositeinterior diaphragms.Effect of Boundary Conditions of GirdersThe base case illustrated in Fig.3was modified by changingthe level of restraint against displacement in the longitudinal andtransverse direction at the ends of each girder.Such supportconditions at the ends of each girder were simulated with a rollerand two mutually perpendicular springs having elastic constantsequal to K s͑the base case structure had K sϭ1.8kN/mm͒.The springs were again oriented parallel and perpendicular to thedirection of the traffirge values of K s are relevant becausethey approximate the support condition for integral bent bridges.The minimum and average stresses as a function of K s atdifferent strips are shown in Fig. 6.It can be seen that thedegree offixity at the ends of the girders significantly affects thedistribution of induced transverse stresses,especially near the endof the deck.More restrained support conditions for the girderswould be qualitatively equivalent to a stiffer diaphragm at the endof the deck.Such an equivalent element will attract a significantportion of the applied transverse stresses,and thereby willreduce Fig.5.Effect of number ofdiaphragmsthe induced compressive stresses in the deck.It is important to notice from Fig.6that the minimum and average stresses at different strips are approximately constant for values of K sϽ20kN/mm͑thus,any size of neoprene pad for which K sϽ20kN/mm would have the same effect͒then decrease inthe range20kN/mmϽK sϽ10,000kN/mm andfinally remain constant for K sϾ10,000kN/mm.Effect of Reinforced Concrete Diaphragm SizeThe base case illustrated in Fig.3was modified by changing the cross-sectional area of all the diaphragms and keeping the same aspect ratio͑height/widthϭ2.0͒.Concrete diaphragms were mod-eled as elastic beam elements having a young modulus, E cϭ27,600MPa͑4,000ksi͒.The results from thefinite element analyses are summarized in Fig.7.It is noticed that the minimum and average stresses at Strip1significantly depend on the size of the diaphragms.The restraining effect of the diaphragms,however,is considerably less significant at Strips2–4.This can be explained by the following two opposite effects:1.As the cross-sectional area of the diaphragm is increased therestrained effect increases and the induced compressive stress decreases;and2.As the height of the diaphragm is increased,the eccentricityof the applied transverse load on the composite diaphragm–deck section is increased thusflexural stresses on the top flange are higher.The superposition of effects͑1͒and͑2͒to a similar extent must be responsible for the relatively minor change in the induced stress in Strips2–4as the diaphragm size is increased.For Strip 1,on the other hand,the effect͑1͒is more significant than the effect͑2͒because the tributary area of deck for the end diaphragms is smaller.Effect of Position of End DiaphragmThe base case is modified by changing the position in the longi-tudinal͑traffic͒direction of the end diaphragm with respect to the end of the deck.For the base case structure͑Fig.3͒,in particular, end diaphragms were located at305mm from the respective ends of the deck.Fig.8summarizes the results from the analysesin Fig.7.Effect of diaphragmsizeterms of the minimum and average stresses at different strips. It is observed that the transverse stresses at the end regions of the deck͑S1͒increase as these elements are placed farther from the ends of the deck.This can be explained in part by considering the diaphragms as composite with the deck.As the end dia-phragms are placed away from the edge of the deck their tributary area of deck increases and so does the resultant compressive force ͑for an applied unit stress͒.Notice that induced transverse stresses in other regions of the deck remain basically unchanged for different positions of the end diaphragm.Summary and ConclusionsThe primary objective of this research was to evaluate how different parameters͑geometry and physical parameters͒affect the distribution of transverse compressive stresses in concrete decks under transverse posttensioning.The experimental results from previous studies were used to test the values calculated from alternative modeling techniques and/or alternativefinite element programs.Following the validation and selection of a convenient alternative modeling technique,a parametric study was carried out in order to identify the most relevant variables.A base case structure was defined and then subjected to transverse unit forces representing the posttensioning.The following can be concluded: 1.Different FE modeling schemes for a particular deck-on-girder structure subjected to transverse stresses only͑test model of the Texas study͒were found to produce results reasonably similar to the experimental values.The average ratio of calculated to experimental transverse stresses on the top surface of the deck is at most1.16for two different tests.2.The degree of restraint at the end of the girders has asignificant effect on the distribution of transverse stresses on the top of the deck.The induced compressive stresses at different regions of the deck remains almost constant for all the possible͑neoprene pad or others͒bearings for which K sϽ20kN/mm.Support conditions for which K sϾ10,000kN/mm are considered asfixed for practical purposes and might correspond to the condition of an integral end bridge.3.The restraining effect of every diaphragm can be approxi-mately taken as independent of the effects of other dia-phragms in the superstructure.Prescribing different levels of posttensioning at different regions near the diaphragm is a reasonable approach for design purposes.In particular, higher transverse forces are needed at regions near the end diaphragms as compared to those needed at regions near the interior diaphragms.4.The restraining effect of the diaphragm can be explainedby considering theflexural action of the applied transverse posttensioning on a composite diaphragm–deck section. 5.Superimposing the induced transverse stresses from deadand live loads with the induced stresses from transverse post-tensioning may lead to a feasible alternative to limit cracking on the top surface of the deck and thus mitigate the onset of corrosion of the reinforcement.AcknowledgmentsThis study was part of the Joint Transportation Research Project ͑JTRP͒entitled“An Investigation on Transversely Prestressed Concrete Bridge Decks.”The project was funded by the Indiana Department of Transportation͑INDOT͒.Special thanks are extended to Scott Snowbolds and Gregory Klevitzki from the research division of INDOT,and to Keith Hoernschemeyer from the Federal Highway Administration͑FHWA͒for their continuous feedback during the course of the study.The views,conclusions, and suggestions from this study represent those of the writers and not necessarily those of the sponsor agency.ReferencesAlmustafa,R.A.͑1983͒.“The analysis of transverse prestressing effects in bridge decks.”PhD dissertation,Univ.of Texas at Austin,Austin, Tex.American Association of State Highway and Transportation Officials ͑AASHTO͒.͑1983͒.Standard specifications for highway bridges, 13th Ed.,Washington,D.C.Bishara,A.G.,and Elmir,W.E.͑1990͒.“Interaction between cross frames and girders.”J.Struct.Eng.,116͑5͒,1319–1333. Bishara,A.G.,Liu,M.C.,and El-Ali,N.D.͑1993͒.“Wheel load distribution on simply supported skew I-beam composite bridges.”J.Struct.Eng.,119͑2͒,399–419.Cao,L.C.,and Shing,P.B.͑1999͒.“Simplified analysis method for slab-on-girder highway bridge decks.”J.Struct.Eng.,125͑1͒,49–59. Chan,T.H.,and Chan,J.H.͑1999͒.“The use of eccentric beam elements in the analysis of slab-on-girder bridges.”Struct.Eng.Mech.,8͑1͒, 85–102.Chen,T.Y.,Siess,C.P.,and Newmark,N.W.͑1957͒.“Studies of slab and beam highway bridges,Part IV:Moments in simply supported skew I-beam bridges.Bulletin No.439,V ol.54,Engineering Experimentation Station,Univ.of Illinois,Urbana,Ill.Duberg,J.E.,Khachaturian,N.,and Fradinger,R.E.͑1960͒.“Method for analysis of multibeam bridges.”J.Struct.Div.ASCE,86͑7͒. Mabsout,M. E.,et al.͑1999͒.“Effect of multilanes on wheel load distribution in steel girder bridges.”J.Bridge Eng.,4͑2͒,99–106. Mabsout,M. E.,Tarhini,K.M.,and Frederick,G.R.͑1997͒.“Finite element analysis of steel girder highway bridges.”J.Bridge Eng.,2͑3͒,83–87.Mora,R.A.͑1983͒.“Design and construction of a direct model for the study of transverse prestressing of bridge decks.”Master of Science thesis,Univ.of Texas at Austin,Austin,Tex.Poston,R.W.͑1984͒.“Improving durability of bridge decks by transverse prestressing.”PhD dissertation thesis,Univ.of Texas at Austin,Austin,Tex.Poston,R.W.,Breen,J.E.,and Carrasquillo,R.L.͑1989͒.“Design of transversely prestressed concrete bridge decks.”PCI J.,68–101. Ralls,M.L.͑1984͒.“Stress distribution in a transversely prestressed slab-girder bridge deck.”Master of Science thesis,Univ.of Texas at Austin,Austin,Tex.Smith-Pardo,J.P.,and Ramirez,J.A.͑2002͒.“An investigation on transversely prestressed concrete bridge decks.”Final Rep.to Joint Transportation Research Program,School of Civil Engineering, Purdue Univ.,West Lafayette,Ind.Westergaard,M.H.͑1930͒.“Computation of stresses in bridge slabs due to wheel loads.”Public Roads,2͑1͒,1–23.。
正交异性桥面板目录第 4 章虎门大桥正交异性钢桥面板疲劳问题研究 ..................................................................... .. 2 4.1 绪论 ..................................................................... (2)4.1.1 正交异性钢桥面板的发展概况 ..................................................................... (2)4.1.2 正交异性钢桥面板的疲劳细节 ..................................................................... ............... 9 4.2 虎门大桥疲劳裂纹现状及成因 ..................................................................... .. (18)4.2.1 虎门大桥疲劳裂纹现状 ..................................................................... .. (18)4.2.2 虎门大桥疲劳裂纹的成因分析 ..................................................................... ............. 22 4.3 正交异性钢桥面板局部应力分析 ..................................................................... .. (28)4.3.1 有限元分析模型 ..................................................................... . (28)4.3.2 单轮荷载作用下桥面板应力分布 ..................................................................... (30)4.3.3 跨中加载时横隔板处应力分析 ..................................................................... . (33)4.3.4 轮压荷载接触面积的影响分析 ..................................................................... . (33)4.3.5 双轴作用下桥面板应力分布...................................................................... .. (34)4.3.6 结论 ..................................................................... ................................................... 35 4.4 正交异性钢桥面疲劳裂纹加固方法研究 ..................................................................... (36)4.4.1 桥面疲劳裂缝的位置和形式 ..................................................................... . (36)4.4.2桥面疲劳裂纹加固的方法...................................................................... .. (37)4.4.3实际加固案例 ..................................................................... .. (39)4.4.4结论 ..................................................................... .................................................... 43 4.5 正交异性钢桥面板构造细节疲劳强度的研究 ..................................................................... .. (44)4.5.1 概述 ..................................................................... (44)4.5.2 焊接连接的疲劳评估 ..................................................................... (45)5.5.3 欧洲规范3有关疲劳强度规定 ..................................................................... . (47)4.5.4 肋板与桥面板的焊接连接的疲劳试验研究 (52)4.5.5 肋板与桥面板的焊接连接的试验数据统计分析 (61)4.5.6 结论 ..................................................................... ................................................... 65 4.6 小结 ..................................................................... .. (65)参考文献 ..................................................................... . (66)第 4 章虎门大桥正交异性钢桥面板疲劳问题研究 4.1 绪论4.1.1 正交异性钢桥面板的发展概况由于二战以后,德国钢材短缺,为节省材料,德国工程师建桥时采用了正交异性钢桥面板。
第53卷第2期 2018年4月西南交通大学学报J O U R N A L O F S O U T H W E S T J I A O T O N G U N I V E R S I T YVol. 53 No. 2Apr. 2018文章编号:0258-2724(2018)02~0260-06 D O I:10. 3969/j. issn. 0258-2724. 2018.02.006钢箱梁面板与u肋焊接残余应力的分布特性崔闯,卜一之,李俊,张清华(西南交通大学土木工程学院,四川成都610031)摘要:为研究残余应力场对钢箱梁疲劳性能影响效应,以港珠澳大桥正交异性钢桥面板为例,采用数值模拟的方法,研究了正交异性钢桥面板焊接全过程及残余应力分布特性,分析了板件参数对残余应力的影响效应,得到钢箱梁确定正交异性钢桥面板焊接残余应力分布的经验公式.研究结果表明:采用ANSYS热-结构弱耦合数值模拟方法可反映实际焊接过程中残余应力场的分布;焊缝区域残余应力峰值受板件参数影响较小,横向最大残余应力约为300 MPa;沿板厚方向焊接残余应力符合正弦分布,表明采用正弦函数作为其经验分布模型是可行的.关键词:正交异性钢桥面板;焊接残余应力;疲劳性能;数值模拟;分布模型中图分类号:U441.4 文献标志码:ADistribution Characteristics of Welding Residual Stress atU Deck-to-Rib Connection Detail of Steel Box GirderCUI Chuang,BU Yizhi,LI Jun,ZHANG Qinghua(School of Civil Engineering,Southwest Jiaotong University,Chengdu 610031,China)Abstract:This study aimed to research the influence of residual stress on fatigue resistance at the deck-to-rib weld joint of steel box girder.Research on distribution characteristics of the field of residual stress i s a precondition to verifying the influence on fatigue resistance.The study was conducted taking Hong Kong Zhuhai Macao Bridge as an example to simulate the entire welding processand the distribution of residual stress.The influence of panel thickness on residual stress was analysed.Th e n,empirical formulae for the residual stress distribution were proposed.The results indicate thatthe variation of residual stress fields can be simulated accurately using numerical methods,i.e.A N S Y S thermal-structural analysis.The panel thickness has l i t t l e influence on the peak residual stressat the local weld zone,and the peak transverse residual stress i s approximately300 M P a.The residual stress distribution across the thickness of the deck i s in good agreement with the sinusoidal distribution,which implies that considering sine function as the empirical distribution model i s feasible.K e y words:orthotropic bridge deck;welding residual stress;fatigue properties;numerical simulation;distribution model正交异性钢桥面板是大跨度钢桥首选桥面板结构.因板件难以轧制成型,并且构造及焊接工艺收稿日期:2016128基金项目:国家自然科学基金资助项目(51578455 ,51178394);国家科技支撑计划(2011BAG07B03);中央高校基本科研业务费专项 资金资助项目(2682014CX078)作者简介:崔闯(1989—)男,博士研究生廣究方向为钢结构桥梁与钢4昆凝土组合结构桥梁,E-mail:swjtu_cc@ 126. com通信作者:卜一之(961-)男,教授,博士,研究方向为大跨麵结构桥梁力学行为及疲劳性能,E-mail:yizhibu@引文格式:崔闯,卜一之,李俊,等.钢箱梁面板与U肋焊接残余应力的分布特性[J].西南交通大学学报,2018,53(2)260-265.CUI Chuang,BU Yizhi,LI Jun,et al. Distribution characteristics of welding residual stress at U deck-to-rib connection detail of steel box girder[ J]. Journal of Southwest Jiaotong University, 2018 , 53(2):260-265.第2期崔闯,等:钢箱梁面板与U肋焊接残余应力的分布特性261复杂,导致大量焊接构件组装后残余应力及焊接变形严重.在残余应力与反复交变车辆荷载组合作用下,正交异性钢桥面板局部应力集中区域塑化,加速结构疲劳损伤,降低其疲劳寿命.降低残余应力、减小局部塑化区域,有效提高疲劳寿命,保证其设计寿命期内的行车安全是正交异性钢桥面板疲劳研究的重要课题之一.为评估焊接构件残余应力对正交异性钢桥面板受力性能的影响,国内外酿者多采用试验方法来预测焊接结构的残余应力量值与分布特征[14],但当前究主要针对特定参数组合构造下残余应力对结构整体性能影响研究,而残余应力对结构的疲劳性能同样具有重要影响[7].传统的残余应力测试手段不仅耗费大量的人力和财力,而且测试精度较差;采用X射线可较为准确地测试,但仪器设备费用昂贵.随着计算机技术的发展,采用数值方法模拟焊接过程得到了广泛应用.文献[8]中采用仿真计H;模拟了焊接全过程,较为准确地反映实际的残余应力分布.本文以港珠澳大桥正交异性钢桥面板为研究对象,对典型的正交异性钢桥面板细节——面板与U肋连接,采用数雖拟方法,模拟焊接全过程,研究结构参数变化对残余应力分布及数值的影响,并在此基础上提出残余应力分布的经验公式.1焊接过程分析模型建立与验证文献[9]的研究表明,焊接温度场直接决定了焊接结构分析的应力应变场,而焊接力学场对温度场的影响较小.在弹塑性分析中,采用增量法逐步解出构件的有关场量(应力场和应变场),温度场则用时间差分格式逐步积分得到,即可以在某一瞬时分别计算温度和应力,通过二者之间的关系,考虑两者的耦合影响效应,以求解焊接过程的弹塑性问题.本文采用A N S Y S热-结构弱耦合模型模拟焊接残余应力产生过程.基本思路:对焊件连接处进行热分析,逐步施加温度增量并计算各节点位移增量,利用弹塑性应力-应变关系求得各单元应力增量,以模拟面板与U肋连接焊缝残余应力量值及其分布;结合A N S Y S中生单元技术莫拟焊缝填充方法模拟焊接全过程,并分别采用SOLID70和S O L I D185单元进行温度场和应力场分析.因焊接过程复杂,应力场和应变场为高度非线性,将焊接热应力场简化为材料的非线性瞬态问题,采用双线性随动强化弹塑性本构模型模拟.根据面板与U肋连接部位实际裂纹发展模式及影响范围确定分析模型的尺寸和材料.连接构造及有限兀模型见图1.顶板厚度18 m m,U肋厚度8m m,上口宽300 m m,下口宽180 m m,高300 m m,細Q345桥梁专用钢,焊缝坡口角度为50°,熔透率达85%,面板与U肋连接和焊缝如图1(a)所示.根据对称性原则,沿其中心线取一半建立有限元模型,纵向长度为200m m,面板两侧约束7方向位移,模拟支架平台,在截面一侧约束构件z方向位移,坐标系及有限元模型如图1(b)所示,在裂纹出现的区域单元细化,最小单元长度为1m m.()面板与U肋连接构造细节()有限元模型图1连接构造及有限元模型Fig. 1 Model parameters and boundary condition在高温条件下Q345的相关材料特征参数参考文献[10-13 ]及E N10025-2[14]标准.焊接模拟热源相关麵采用港珠澳大桥实际焊接热源参数,其中:电压为31 ±1V,电流为300 ±20A,焊速为40 ± 10 c m/m i n,时间步长为0. 1s,电压、电流及焊速为恒定值,多道焊初始温度为20 °C,室温与初始温度一致.根据文献[],常温下传热系数一般为5 ~25 W/(m2.T),计算分析时取13 W/(m2.T).采用生热率及生死单元技术,沿纵向按顺序分段加热焊缝单元,以模拟焊接过程.焊接过程共分为420个262西南 交通大 学学报第53卷荷载步,每个荷载步分为4个荷载子步,在对下一 步施加单元生热率前删除上一步所施加单元生热 率,实现移动热源模拟焊接的过程.港珠澳大桥钢箱梁正交异性钢桥面板板单元 焊接加热(第2道焊)在22.4、30.0、34.0、38.0 s 时的温度场变化如图2(a )所示.焊接模拟过程中, 焊件上各单元从温度不稳定开始,迅速形成准稳态 温度场,虽然结构各区域温度随移动热源位置和时 间改变,但温度场以固定的形态随热源移动.面板 与U 肋连接焊缝焊后冷却至39、68、131、1 874 3时 的温度场,如图2(b )所示.当时间超过1 874 s 时, 结构内部温度差为0.04 °C ,可认为结构内部温度已趋于室温,达到稳定状态.将所得温度场逐步施加于结构,并结合上述建 模方法对文献[15]中相关试验数据进行验证.结 果表明,数值模拟理论值与实测值差别较小,所建 立的有限元模型能准确地表达残余应力分布量值 与分布特征,对比结果如图3所示.由于文献[15 ] 中所研究的残余应力均为纵向(向)残余应力^ (若未特殊说明,所述坐标均为图1(b )中所示坐 标),而对疲劳性能影响较大的垂直于焊缝方向的 残余应力^未有涉及.因此,为进一步研究残余应 力对疲劳性能的影响,文中主要研究横向残余应力 ^的分布特性.图2焊接全过程温度场变化Fig. 2 Temperature variation during the entire welding process图3有限元模型验证Verification of finite element model2焊接残余应力模拟与分析2.1焊接残余应力面板与U 肋连接焊缝疲劳破坏主要分为焊趾沿面板开裂、焊根沿面板开裂、焊根沿焊喉开裂和 焊趾沿U 肋开裂,如图4所示.为研究残余应力对正交异性钢桥面板疲劳性 能的影响,在分析残余应力时,主要考虑对其疲劳 性能影响较大的焊接区域局部残余应力,即在焊趾 或焊根处沿板厚垂直于焊缝方向的横向残余应力.沿面板开裂的两类疲劳裂纹发生几率在面板与U 肋连接部位的疲劳开裂中占比较大,为此,后续40'30|)0,e 'F第2期崔闯,等:钢箱梁面板与U肋焊接残余应力的分布特性263主要研究对面板与U肋连接部位疲劳性能影响较大、沿面板厚度方向的残余应力,主要集中在面板上.根据前述开裂模式中各起裂位置,分析横截面上沿板厚及沿板件表面*方向对疲劳开裂有较大影响的残余应力,即焊趾或焊根沿厚度分布垂直于焊缝方向的残余应力.港珠澳大桥面板与U肋连接焊缝,在Z= 100m m横截面上残余应力的分布如图5所示.焊缝焊根焊趾1焊根沿焊缝开裂焊趾\ u肋图4典型开裂模式Fig. 4 Typical propagation models of fatigue crack 构造细节疲劳性能显著降低.2.2参数影响效应为控制残余应力值及分布对疲劳性能的影响效应,需对其敏感性参数进行进一步的研究.文献[16]酿表明,散热条件、焊接有效功率、熔池面积对残余应力整体影响较大,对决定疲劳开裂的残余拉应力峰值影响甚微.本文中不考虑上述条件的改变对残余拉应力的影响,以沿面板开裂区域内对残余应力影响最大的参数_面板厚度为研究对象,对其特定参数组合下的残余应力大小和分布进行对比分析.数麵拟结果如图6所示,其中:D表示面板; D后面的数字表示面板厚度,如“D12”表示面板厚度为12 m m;图中坐标与图5局部坐标系相同.图6面板沿厚度方向残余应力分布Fig. 6Residual stress distribution acrossthe thickness of the deck(b)面板焊根图5 ^ = 100mm横截面上残余应力的分布Fig. 5 Residual stress distribution ofcross-section at ^ = 100mm由图5可知,面板沿厚度的^先减小后增加焊缝区域局部残余应力峰值接近300 M P a,接近屈服应力,在服役期正常工作状态下,恒活载叠加作用后其局部可能发生塑化.因此,上述焊缝*方向残余应力与正常使用阶段应力联合作用会导致该由图6可知:⑴随面板厚度的增加,面板焊趾处的横向残余应力峰值略有增加;当面板厚度由12m m增加至22m m时,焊趾处残余应力增幅为19. 8%.⑵面板焊根处的横向残余应力随面板厚度变化趋势与焊趾处残余应力变化趋势一致;当面板厚度由12m m增加至22m m时,其残余峰值应力较面板为12m m时增加为21.2% .与舰相比,焊根处残余应力峰值更大,且焊接质量难以保证,264西南交通大学学报第53卷导致焊根部位更易出现疲劳裂纹.焊趾或焊跟部位裂纹起裂点处的残余应力均超过200 M P a,在与恒活载应力场叠加后,局部可发生塑化,严重降低此处疲劳性能.3残余应力分布经验公式为研究残余应力对各焊接细节疲劳性能的影响,需确定残余应力量值与其对应的分布特征.目前残余应力求解主要采用雖方法,该方法计算时间长,计算机性能要求高,限制计算模型的大小,不适合在整体结构中考虑其对疲劳性能的影响.为此,提出了适用于疲劳分析的残余应力经验分布模型,在结构分析中可通过经验分布模型来考虑残余应力的影响,国内外学者[7’11]基于静力行为研究提出了在整体结构和局部分析中的分布简化模型,但用于疲劳分析的局部分析模型还未见报道.基于前述参数影响效应分析,建立直接影响面板与u肋连接焊缝开裂的残余应力^的经验分布模型,为疲劳理论分析和优化设计提供支撑.对港珠澳大桥正交异性钢桥面板与纵肋连接部位残余应力分布的分析表明,沿板件厚度方向残余应力可采用式⑴计算.表1理论分布模型参数Tab. 1 Parameters of theoretical distribution model式(1)参数面板厚度/m m121416182022 Ap/MPa47.243.7124.182. 144.848.7面板Jc/m m-3.2-4.3-11.2-9.7-11.6- 10. 3焊趾Wc/mm 6.98.213.613.015.515.2 A/MPa144.1187.0196.5189.1200.7199.9Ag/MPa21.620.824.782. 431.3107.8面板Jc/mm-2.2-3.2- 4. 2-9.5-7.1- 14. 7焊根Wc/m m 6.07. 18.412.511.417.3 A/MPa163.7180.0175.6207.1167.4221.60-…7c +W c4 11..........G/MPa(a)面板焊趾^ =4〇+4sin^),⑴wc式中:为变化幅;7。
钢桥面板顶板与U肋接头焊接残余应力分析吉伯海;李坤坤;傅中秋【摘要】对钢桥面板顶板与U肋接头焊接残余应力进行分析.采用热-结构直接耦合方法,分析了构件焊接温度场及应力场,得到构件中心截面母板纵向、母板横向、U肋纵向及焊缝中心竖向的残余应力分布曲线.结果表明:母板及U肋近焊缝区存在较大的残余拉应力,残余拉应力峰值接近材料屈服强度;自焊缝中心往外,残余拉应力值下降并转变为压应力;热影响区之外,母板及U肋纵向残余应力主要表现为压应力,并向两端缓慢下降;母板横向残余应力主要表现为拉应力,近焊缝区存在应力突变;沿焊缝竖向纵、横向应力变化趋势基本相同.【期刊名称】《江南大学学报(自然科学版)》【年(卷),期】2015(014)002【总页数】5页(P197-201)【关键词】钢桥面板;顶板与U肋接头;焊接残余应力;热循环曲线;应力场【作者】吉伯海;李坤坤;傅中秋【作者单位】河海大学土木与交通学院,江苏南京210098;河海大学土木与交通学院,江苏南京210098;河海大学土木与交通学院,江苏南京210098【正文语种】中文【中图分类】U441.5钢桥面板制造过程中大量采用焊接工艺,焊接过程的不均匀温度场以及由其引起的局部塑性变形不可避免地产生残余应力,焊接残余应力的存在直接影响到钢桥面板结构的承载能力及耐久性,特别是焊缝区域高的拉伸应力可能导致疲劳强度降低[1-2]。
近年来,国内外多座桥梁的钢桥面板出现疲劳损伤,且疲劳裂纹多出现在板件焊缝连接处,尤其在U形纵肋与桥面板的连接焊缝处,十分容易出现裂纹[3]。
因此,有必要定性或定量分析钢桥面板顶板与U肋接头焊接残余应力分布状态,以研究其对钢桥面板疲劳强度的影响。
20世纪90年代以来,国内外学者先后对日本多多罗大桥、国内苏通大桥做了钢主梁设计残余应力测试试验[4-5],国内学者亦通过顺序耦合方法针对钢主梁U 肋加劲板焊接残余应力进行分析[6],但数量有限的分析研究难以揭示钢桥面板焊接残余应力分布的普遍规律,且不十分完善。