头部ASL灌注成像
- 格式:ppt
- 大小:7.28 MB
- 文档页数:27
脑高级别胶质瘤ASL灌注成像研究进展丁芳芳;袁涛;全冠民;史朝霞【期刊名称】《国际医学放射学杂志》【年(卷),期】2014(37)4【摘要】Conventional MR techniques has certain disadvantage in evaluating high-grade glioma (HGG). Because of imaging acquisition without injection of contrast material intravenously and the excellent repeatability, arterial spin labeling (ASL) can be helpful in differentiation between HGG and low-grade glioma, lymphoma, and solitary metastasis, and in evaluating the effect of radiotherapy.%常规MR技术对高级别胶质瘤(HGG)评估存在一定限度。
动脉自旋标记(ASL)灌注成像具有无需注射对比剂、可反复操作的优点,对于HGG与低级别胶质瘤、淋巴瘤、单发转移瘤的鉴别诊断,以及放疗后疗效评估等具有重要的补充价值。
【总页数】4页(P328-331)【作者】丁芳芳;袁涛;全冠民;史朝霞【作者单位】050000 石家庄,河北医科大学第二医院影像科;050000 石家庄,河北医科大学第二医院影像科;050000 石家庄,河北医科大学第二医院影像科;050000 石家庄,河北医科大学第二医院影像科【正文语种】中文【相关文献】1.原发性脑淋巴瘤与高级别脑胶质瘤的MR灌注成像对照研究 [J], 李星玉2.对比增强扫描结合全脑3D ASL灌注成像在脑胶质瘤中的应用价值 [J], 卢景海;任仲金;孙洋3.3D-ASL与DSC-PWI在高级别脑胶质瘤术后复发和放射性脑坏死鉴别诊断中的应用 [J], 石慧娴;韩雷;叶靖;张洪英4.3D-ASL与DSC-PWI在高级别脑胶质瘤术后复发和放射性脑坏死鉴别诊断中的应用 [J], 石慧娴;韩雷;叶靖;张洪英5.3D-ASL与DCE-MRI在鉴别诊断脑高级别胶质瘤与脑转移瘤中的应用价值 [J], 冯梦薇;方明;王国华因版权原因,仅展示原文概要,查看原文内容请购买。
灌注成像(3)ASL近年来磁共振每年一项新技术成熟地应用于临床,ASL就是其中之一,它无需使用钆对比剂,可以简单、快速地获得组织灌注的信息,已经广泛应用于临床。
作者:星尘stari来源:1影1世界编审:薛伟ASL技术近年来磁共振每年一项新技术成熟地应用于临床,ASL就是其中之一,它无需使用钆对比剂,可以简单、快速地获得组织灌注的信息,已经广泛应用于临床。
1概念ASL(Arterial Spin Labeling),中文叫动脉自旋标记灌注成像技术。
灌注,是血流通过毛细血管网,将携带的氧和营养物质输送给组织细胞的重要功能。
灌注成像是定量或半定量观察血管和组织液之间物质交换过程的方法。
ASL也是一样。
只不过,ASL是一种不使用钆对比剂的方法,它是将动脉血中的氢质子作为内源性示踪剂的新型灌注技术。
1原理从其名字就能够知道,ASL是利用人体动脉血中的质子,作为内源性示踪剂,自身标记,来观察组织灌注过程。
在日常工作中,简单理解其过程是这样的:利用射频脉冲标记颈动脉血流,经过一段时间,等它流经大脑时采集图像,利用控制图像减去标记图像,就要以得到灌注图像ASL了,一般ASL只能得到CBF 一个参数的定量图。
话说起来简单,其实这中间还有很多具体的操作细节,直接影响灌注的成功与否,影响图像质量。
下面展开介绍:1内源性标记方法目前,ASL较成熟的应用是大脑灌注,其它部位的ASL都还处于研究阶段。
在头部的应用,应该标记大脑的流入动脉,也就是在颈动脉放置射频脉冲带,来标记流入大脑的动脉血中的质子。
它在成像平面近端对动脉血中的水分子进行180度反转脉冲标记, 自旋弛豫状态改变后的水质子经过一段时间后对组织进行灌注, 并在成像层面与组织中没有标记过的水质子进行交换, 引起局部组织纵向弛豫时间T1 发生改变, 这时采集到的图像即为标记图像, 它的信号强度与成像区域的血流有关。
为了更好地控制各种干扰因素,需要对流入颈动脉的血流进行标准化的处理,也就是说给一个180度翻转脉冲,紧接着再给一个180度翻转脉冲,这样处理的结果就是流入颈动脉的血流,完全一致的相位。
动脉自旋标记灌注MR成像(ASL-MRI)摘要:灌注成像(Perfusion Imaging)可以用来评价组织的生理活动,基于磁共振(Magnetic Resonance, MR)的灌注成像质量好、安全性高。
利用MR可以使用外源性示踪剂进行MR灌注成像,也可以应用内源性示踪剂进行动脉自旋标记(Arterial Spin Labeling,ASL)灌注成像。
本文主要介绍利用ASL技术进行灌注成像的发展历史、基本原理、最新前沿及应用(发展的新动态、新趋势、新水平、新原理、新技术、新应用等)以及仍然存在的问题。
关键词:灌注成像;动脉自旋标记;磁共振成像背景灌注(Perfusion)是指血液通过毛细血管网与组织进行氧、养分及代谢物交换,维持组织器官的活性和功能的过程。
灌注过程中,携带含氧血红蛋白的动脉血给细胞供氧并带走代谢产生的CO2,形成带有脱氧血红蛋白的静脉血。
灌注成像可以很好地评价组织生理活动。
在ASL成像中,灌注一般指的是血流量(Blood flow)。
血流的定量测量基于物质守恒的费克定律(Fick principle),通过测量组织中示踪剂的浓度,假设已知部分系数(partition coefficient)λ 和动脉中示踪剂的浓度,可以计算得到血流量 f(mL/(100g组织·min))。
正电子发射断层成像(PET)和单光子发射断层成像(SPECT)都可以定位放射性核素的发源地,从而对血流量进行测量。
其中,PET背景噪声较低,是目前最准确的灌注测量技术。
这两种技术采用连续注入半衰期较短示踪剂,示踪剂随血流在组织内分布和聚集,根据示踪剂局部积累和衰减情况及进行定量评价;而ASL MRI 则利用标记过的水作为示踪剂,通过标记水和组织进行交换来定量灌注,T1 弛豫提供一个可测量的衰减率。
ASL MRI 技术因其不需要外源性示踪剂,无辐射而在灌注方面得到广泛的应用。
发展历史1992年,Detre等人用连续的RF脉冲链来标记颈部动脉(CASL),成功地得到了大鼠脑部灌注图像。
磁共振3D-ASL脑灌注成像技术联合DWI 诊断急性脑卒中的价值【摘要】目的研究磁共振3D-ASL(三维连续动脉自旋标记)脑灌注成像技术联合DWI(弥散加权成像)在急性脑卒中诊断上的临床价值。
方法共选取2020年8月——2022年8月在我院接受治疗的急性脑卒中患者70例作为主要对象,所有患者均接受磁共振3D-ASL脑灌注成像技术联合DWI检查,对检查结果进行总结。
结果 70例患者经DWI检查提示高信号表现位于DWI梗死区域,低信号改变位于ADC图像上。
58例患者的3D-ASL的CBF图像梗死区低灌注,6例患者梗死区域无灌注异常表现,6例患者梗死区域表现为高灌注。
58例低灌注表现患者中有28例患者的低灌注区域超过DWI高信号范围,低灌注区域和DWI高信号范围相同。
梗死区域和对侧区域的ADC值、rCBF值比较,有统计学意义(P<0.05)。
结论磁共振3D-ASL脑灌注成像技术联合DWI在急性脑卒中诊断上的临床价值显著,可全面观察梗死附近的高灌注情况和侧支循环情况,可对疾病做出早期诊断,并为治疗效果和预后评估提供科学依据。
【关键词】磁共振3D-ASL脑灌注成像技术;弥散加权成像;急性脑卒中;诊断价值急性脑卒中在临床上属于常见的急症,患者起病急,病情进展速度快,需要在明确病情后立即予以针对性治疗,最大程度上降低患者残疾和死亡的风险,提高患者的生存质量。
对于急性脑卒中患者而言,发病后的6h是黄金抢救时间,而越早确诊、越早治疗,抢救效果和预后越好。
目前临床上对于急性脑卒中多是定性诊断,确诊时患者的卒中症状已经发生较长时间,无法明确梗死区、缺血半暗带区域血流情况以及再出血的发生风险等[1-3]。
磁共振3D-ASL脑灌注成像技术、DWI技术目前在急性脑卒中诊断上逐渐得到了应用,将两者相结合可提高诊断的准确性,更准确、更全面地评估患者情况。
现共选取70例急性脑卒中患者,旨在进一步探究和评价磁共振3D-ASL脑灌注成像技术联合DWI的临床价值,汇总如下。
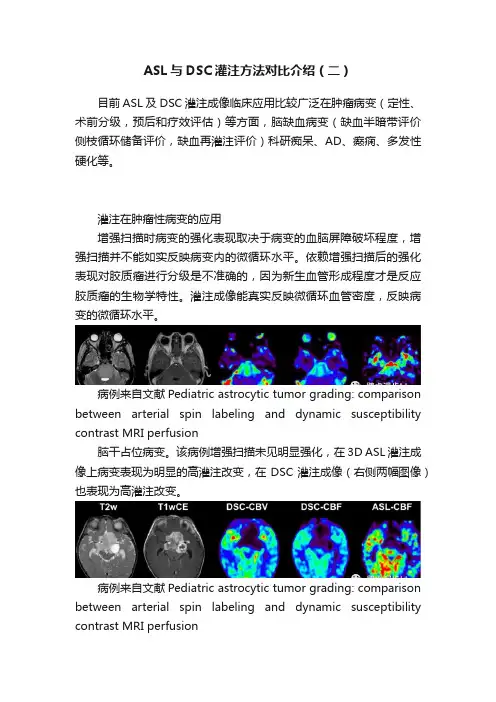
ASL与DSC灌注方法对比介绍(二)目前ASL及DSC灌注成像临床应用比较广泛在肿瘤病变(定性、术前分级,预后和疗效评估)等方面,脑缺血病变(缺血半暗带评价侧枝循环储备评价,缺血再灌注评价)科研痴呆、AD、癫痫、多发性硬化等。
灌注在肿瘤性病变的应用增强扫描时病变的强化表现取决于病变的血脑屏障破坏程度,增强扫描并不能如实反映病变内的微循环水平。
依赖增强扫描后的强化表现对胶质瘤进行分级是不准确的,因为新生血管形成程度才是反应胶质瘤的生物学特性。
灌注成像能真实反映微循环血管密度,反映病变的微循环水平。
病例来自文献Pediatric astrocytic tumor grading: comparison between arterial spin labeling and dynamic susceptibility contrast MRI perfusion脑干占位病变。
该病例增强扫描未见明显强化,在3D ASL灌注成像上病变表现为明显的高灌注改变,在DSC灌注成像(右侧两幅图像)也表现为高灌注改变。
病例来自文献Pediatric astrocytic tumor grading: comparison between arterial spin labeling and dynamic susceptibility contrast MRI perfusion本例毛细胞星形细胞瘤:增强明显强化,DSC和ASL未见明显强化。
灌注成像(ASL和DSC)能够帮助胶质瘤更加准确分级以及指导我们术后取病理(要在ASL显示高灌注区取到的活检才能更加准确反映肿瘤的级别,因为灌注明显的区域可以代表肿瘤最有活性的区域),以及制定更加合理的手术范围(肿瘤强化的边缘并不代表肿瘤的真正边界,所以根据肿瘤强化边缘确定手术或放疗范围是不准确的)。
左侧顶叶胶质母细胞瘤:增强扫描呈环形不规则强化区域很多,但灌注图像只有新生肿瘤血管密度高的地方才表现出来高灌注状态。
asl简要原理
ASL(Arterial Spin Labeling)技术是一种无创、无辐射、无需额外注射示踪剂的组织灌注成像方法。
它利用磁共振射频脉冲特异性标记即将灌注入组织的上游动脉血液,使其成为内源性的示踪剂,无需注射示踪剂便可获取目标器官像素级灌注定量信息。
ASL技术通过磁场使水分子发生磁性翻转,引起在核磁扫描设备中信号的变化,从而通过标记像与控制像的计算得到大脑的灌注量。
当这种标记过的血液流入组织时,会引起组织中可用磁化的减少,因此在标记位置下游采集到的图像会显得暗一些。
通过计算一系列标记像与控制像的差值,就可以求得在标记期间流入器官的血液体积的多少。
ASL最常见的用途就是大脑的灌注成像,即在血液流经颈动脉和椎动脉进入大脑前对其进行标记。
经过一个短暂的延迟就可以获得一个标记过的大脑影像。
随后采集第二张大脑影像,但是在第二次的采集中不进行血液的翻转磁化,只是用作任何标记脉冲处理的控制像。
这两张图像的差值与灌注率大致成正比。
根据研究的需要也可以采集成对影像,从而获得关于灌注的时间序列,来研究在任务刺激下大脑灌注的变化。
以上信息仅供参考,如需获取更多详细信息,建议查阅ASL相关论文或咨询专业医生。
磁共振脑灌注成像技术
ASL(arterial spin labeling)是MR灌注成像技术的一种分析方法,是利用内源性示踪剂的动脉自旋标记技术,即采用反转脉冲标记动脉血中的质子,将标记前后采集的图像进行减影,从而获得组织灌注参数图。
根据标记方法不同分为2D采集、EPI采集;根据脉冲采集类型分为:连续式ASL(CASL),脉冲式ASL(PASL);脉冲式标记对动脉通过时间更敏感,信噪比较低;连续式标记能降低动脉通过时间的影响,信噪比高,对设备要求高,射频能量高,不能应用于临床。
ASL完全无创性检查,可重复性强,简单易行。
主要参数CBF。
ASL在近几年有了显著的发展,已应用于临床,潜在的取代了血氧水平依赖性(BOLD)功能MRI在神经科学研究中的地位。
ASL技术已应用于脑、心脏、肺、肾、骨骼肌的灌注研究中,尤其是对脑组织的研究应用更为广泛和深入,主要集中于对脑缺血、脑肿瘤、Alzheimer病、癫痫以及外伤等中枢神经系统常见疾病的研究。
传统ASL与3DASL的对比:
传统ASL:采用EPI采集,对礠敏感伪影明显,2D采集,成像范围有限,对运动伪影敏感;
3DASL:采用FSE采集,有效克服礠敏感伪影,3D采集,成像范围大,Spiral采集高效快速,有效克服运动伪影。
抑郁障碍:ASL测量脑灌注改变目的:用ASL方法评估RDD、NDD闹灌注的改变,并与HC做对照。
方法:RDD24例,NDD37例,HC42例。
所有被试均用3.0T磁共振扫描ASL和EPI 图像,并且得到平均灌注权重图像。
使用VBA的方法。
选取双侧海马旁回、丘脑和豆状核为ROIs。
结果:NDD左侧前额叶较对照组灌注下降,边缘-纹状体区域灌注增加(p<0.05)。
RDD表现为双侧额叶和双侧丘脑灌注下降(p<0.05)。
与RDD相比NDD边缘-纹状体区灌注较高(p<0.05)。
ROIs分析发现,NDD左侧海马(p=0.045)、右侧海马(p=0.001)、右侧豆状核(p=0.049)血流灌注增加。
结论:本研究发现RDD的脑区灌注和NDD存在差异。
支持RDD双侧前额叶激活降低的说法;而NDD左侧额叶灌注激活减低的同时显示出是双侧边缘系统激活的增加。
前言:尽管抑郁症的治疗效果很好,但仍有将近30%的患者对抗抑郁治疗反应较差,可分为难治性抑郁障碍(RDD)和非难治性抑郁障碍(NDD)。
PET和SPECT 研究发现患者有脑区灌注异常,但研究结果并不一致,这些矛盾显示了抑郁障碍神经病理的复杂性,而这又可能与疾病的发展和治疗反应相关。
因此本研究以研究RDD和NDD的闹灌注表现,或许这可以帮助我们早期识别患者的疾病类型提供影像学方法。
我们用ASL来测量脑区灌注,与PET和SPECT相比,ASL的优点是不需要放射源,同时也不需要注射造影剂。
我们研究的目的是用ASL比较RDD、NDD以及HC的脑区灌注差异。
被试:知情同意,汉族,右利手,DSM-IV抑郁障碍诊断标准,16-60岁;排除:双向障碍,重大躯体疾病,精神科治疗史,心血管疾病,服用心血管药物,酒精或药物滥用。
最终入组61例患者,入组前都没有抗抑郁治疗史,用HRSD-17和GIS 评估严重程度。
磁共振当天HRSD≧18,GIS≧4。
MRI扫描后给予患者抗抑郁治疗(三环类、SNRIS、SSRIs)。
脑ASL灌注成像:临床应用方兴未艾Arterial Spin Labeling Perfusion of the Brain: Emerging Clinical ApplicationsAuthors ListSven Haller, MD, MScGreg Zaharchuk, MD, PhD,David L. Thomas, PhD,Karl-Olof Lovblad, MD,Frederik Barkhof, MD,Xavier Golay, PhDAdditional InformationFrom Affidea Centre Diagnostique Radiologique de Carouge, Clos de la Fonderie 1, 1227 Carouge, Switzerland (S.H.);Dept of Surgical Sciences, Div of Radiology, Uppsala Univ, Sweden (S.H.);Dept of Neuroradiology, Univ Hosp Freiburg, Germany (S.H.);Faculty of Medicine Univ of Geneva, Switzerland (S.H.);Dept of Radiology, Stanford Univ, Stanford, Calif (G.Z.);Univ College London, Inst of Neurology, London, England (D.L.T., X.G.);Dept of Diagnostic and Interventional Neuroradiology, Geneva Univ Hosps,Switzerland (K.O.L.);Dept of Radiology & Nuclear Medicine and PET Research, VU Univ Medical Ctr, Amsterdam, the Netherlands (F.B.);and Insts of Neurology and Healthcare Engineering, Univ College London, England (F.B.).Address correspondence to S.H. (e-mail:*********************).•Abstract••Full Text••Figures••References••Supplemental Materials••Cited by••PDFArterial spin labeling (ASL) is a magnetic resonance (MR) imaging technique used to assess cerebral blood flow noninvasively by magnetically labeling inflowing blood. In this article, the main labeling techniques, notably pulsed and pseudocontinuous ASL, as well as emerging clinical applications will be reviewed. In dementia, the pattern of hypoperfusion on ASL images closely matches the established patterns of hypometabolism on fluorine 18 fluorodeoxyglucose (FDG) positron emission tomography (PET) images due to the close coupling of perfusion and metabolism in the brain. This suggests that ASL might be considered as an alternative for FDG, reserving PET to be used for the molecular disease-specific amyloid and tau tracers. In stroke, ASL can be used to assess perfusion alterations both in the acute and the chronic phase. In arteriovenous malformations and dural arteriovenous fistulas, ASL is very sensitive to detect even small degrees of shunting. In epilepsy, ASL can be used to assess the epileptogenic focus, bothin peri- and interictal period. In neoplasms, ASL is of particular interest in cases in which gadolinium-based perfusion is contraindicated (eg, allergy, renal impairment) and holds promise in differentiating tumor progression from benign causes of enhancement. Finally, various neurologic and psychiatric diseases including mild traumatic brain injury or posttraumatic stress disorder display alterations on ASL images in the absence of visualized structural changes. In the final part, current limitations and future developments of ASL techniques to improve clinical applicability, such as multiple inversion time ASL sequences to assess alterations of transit time, reproducibility and quantification of cerebral blood flow, and to measure cerebrovascular reserve, will be reviewed.© RSNA, 2016Learning Objectives:After reading the article and taking the test, the reader will be able to:1.■ Describe the technical principles of arterial spin labeling2.■ Discuss the limitations and pitfalls of ASL3.■ Discuss the role of ASL in neurodegenerative and cerebrovascular disease, arteriovenous malformation, epilepsy, neoplasms, and neurologic disorders4.■ Discuss the use of ASL to measure cerebrovascular reserve using a vascular challengeConclusionAlthough ASL has been around for more than 2 decades, it only recently began to make the transition from a research toolto clinical use due to increasing awareness of radiologists and clinicians of its capability and technical improvements that have made this approach more reliable and available as product sequences on MR imaging platforms. For many diseases, including dementia, vascular diseases, neoplasms, and various psychiatric diseases, ASL provides additional and complementary information to that available from structural MR imaging. Current methodological developments aim to increase the robustness and decrease interimager variability of CBF estimation.Essentials1.■ Due to the close link between brain metabolism and perfusion, patterns of fluorine 18 fluorodeoxyglucose PET closely resemble those of arterial spin labeling (ASL).2.■ ASL complements structural information of standard MR imaging in neurocognitive decline and may allow early diagnosis of dementia.3.■ ASL may depict mismatch perfusion in acute stroke and help identify tissue at risk in chronic cerebrovascular disease.4.■ ASL may depict arteriovenous shunting in arteriovenous malformation and fistulas.5.■ ASL may be used to localize the epileptogenic focus in seizure disorders.6.■ In neoplasms, ASL may replace standard gadolinium-enhanced dynamic susceptibility contrast-enhanced imaging, notably in patients with allergies or renal insufficiency or in children.7.■ ASL may help detect subtle functional changes in psychiatric disorders such as posttraumatic stress disorder ormild traumatic brain injury, where standard structural MR imaging typically provides no detectable anomaly.8.■ Emerging new applications of ASL include superselective ASL to map vascular territories and cerebrovascular reserve imaging.9.All Figures10.11.12.Figure 1:13.ASLarterial spin labeling labeling schemes. A, In PASLpulsed ASL, an inversion slab is placed proximal to the imaging volume to label blood in the arterial feeding vessels supplying the brain. The pulse is short (∼10 msec) and all the blood is inverted simultaneously. B, In PCASLpseudocontinuous ASL, the inflowing arterial blood is continuously inverted as itflows through the labeling plane by means of a process known as flow-induced adiabatic inversion. The PCASLpseudocontinuous ASL labeling pulse train is typically applied for a period of approximately 1–2 seconds.14.15.16.17.18.Figure 2:19.Differences in labeling degree of ASLarterial spin labeling bolus for PASLpulsed ASL (left column) and PCASLpseudocontinuous ASL (right column). The top row shows the temporal profile of the bolus (1 = fully inverted; 0 = fully relaxed). Since the PASLpulsed ASL inversion slab is inverted at a single point in time (t = 0 on this graph), all the inflowing arterial blood undergoes the same amount of T1 recovery at all timepoints after this. In PCASLpseudocontinuous ASL, blood is labeled as it flows through the inversion plane and recovers en route to the imaging volume. A–D show the degree of labeling remaining at several time points after the start of labeling (t = 0): A, t = 0; B, t = arterial arrival time (ATT); C, t = bolus duration (τ); D, t = ATT + τ. Color scale represents the range from fully inverted (red) to fully relaxed (blue). It can be seen that the PCASLpseudocontinuous ASL labeling process produces a bolus with a higher overall degree of inversion than does the PASLpulsed ASL, resulting in a higher intrinsic SNRsignal-to-noise ratio for PCASLpseudocontinuous ASL.20.21.22.23.24.Figure 3:25.Example of an underestimation of relative CBFcerebral blood flow (relCBF) in ASLarterial spin labeling due to a proximal vessel stenosis. A, The estimated relative CBFcerebral blood flow based on DSCdynamic susceptibility contrast perfusion is within normal limits. B, In contrast, the relative CBFcerebral blood flow estimated by using a standard single–inflow-time ASLarterial spin labeling sequence demonstrates marked reduction in the left anterior and middle cerebral artery territories. The origin of this discrepancy is the increased perfusion delay, illustrated on, C, DSCdynamic susceptibility contrast-derived delay map, which exactly matches the altered perfusion in ASLarterial spin labeling due to the presence of a high-grade stenosis of the left internalcarotid artery on, D, time-of-flight (TOF) image. The underlying principle is explained in E. The normal perfusion time series of DSCdynamic susceptibility contrast imaging (solid black line) is shifted to the right due to the presence of a proximal vessel stenosis and slower collateral flow (dotted line). DSCdynamic susceptibility contrast imaging acquires an entire time series, this shift in the bolus arrival simply causes a shift of the estimated curve, and the relative CBFcerebral blood flow can be accurately estimated in DSCdynamic susceptibility contrast. In contrast, a single–inflow-time ASLarterial spin labeling sequence with a standard inflow time (indicated by the vertical line) will underestimate the true perfusion simply because it is too early with respect to the peak of the perfusion curve.26.27.28.29.30.Figure 4:31.Examples of dementia. Transverse FDGfluorine 18 fluorodeoxyglucose and ASLarterial spin labeling images of, A, a healthy individual (male; age, 57 years; Mini-Mental State Examination [MMSE] score, 30), B, patient with ADAlzheimer disease (male; age, 52 years; MMSE score, 19), and, C, patient with frontotemporal lobar dementia (female; age, 53 years; MMSE score, 26). Functional images show predominant prefrontal abnormalities in FTD and parietal abnormalities in ADAlzheimer disease. Red color reflects normal metabolism and perfusion.32.33.34.35.36.Figure 5:37.Images in 50-year-old woman presenting with stroke, with 14 hours of right hemiparesis and aphasia, National Institutes of Health Stroke Scale score of 9 at the time of imaging. Patient was later found to have extracranial left internal carotid artery dissection. A, Diffusion-weighted images demonstrate irreversibly damaged tissue within the left caudate and putamen. By using a multidelay ASLarterial spin labeling sequence capable of acquiring both, B, CBFcerebral blood flow and, C, arterial transit time images, a larger region of perfusion abnormality is identified. D, Conventional DSCdynamic susceptibility contrast images show the region of perfusion abnormality (time to the maximum of the residue function) is concordant with the findings on ASLarterial spin labeling images.38.39.40.41.42.Figure 6:43.Example of multidelay ASLarterial spin labeling imaging. A fixed labeling duration of 2000 msec is used, but on subsequent images, different postlabel delays (PLD) ranging from 700 to 3000 msec are used, yielding ASLarterial spinlabeling difference (control label) images as shown in A. From these data, and the use of general kinetic modeling, one can simultaneously measure, B, an arrival-time–corrected CBFcerebral blood flow and, C, the arterial arrival time itself. In this patient, there is near symmetric CBFcerebral blood flow but clear arterial arrival delay in the right hemisphere, as shown by the higher values on the arrival time map.44.45.46.47.48.Figure 7:49.Images in 51-year-old man with exertional headaches and an arteriovenous fistula imaged at 1.5 T. A, T2-weighted images demonstrate very subtle flow voids in the inferior frontal lobe (arrow). B, ASLarterial spin labeling images demonstrate linear high signal intensity (arrows) in the region of the right inferior frontal lobe, which extends to the right cavernous sinus, indicative of an arteriovenous shunt lesion. C, Collapsed and, D, source MR angiographic images confirm the presence of an ethmoid dural fistula (arrow), which was recognized only after theobservation of the abnormal ASLarterial spin labeling signal within the venous structures draining the fistula. This case also demonstrates that while 3 T is preferable to 1.5 T, relevant clinical information can be obtained with ASLarterial spin labeling at 1.5 T.50.51.52.53.54.Figure 8:parison of ASLarterial spin labeling MR imaging and FDGfluorine 18 fluorodeoxyglucose PET in epilepsy. Each column represents imaging studies of a single patient. A, Preoperative axial T1-weighted MR images. B, Raw FDGfluorine 18 fluorodeoxyglucose PET images. C, Raw PASLpulsed ASL CBFcerebral blood flow maps. D, Image fusion of T1-weightedMR imaging and FDGfluorine 18 fluorodeoxyglucose PET. E, Image fusion of T1-weighted MR imaging and PASLpulsed ASL. Arrows indicate regions of focal cortical dysplasia that are epileptogenic. Numbers 1–5 refer to different patients. (Reprinted, with permission, from reference 80.)56.57.58.59.60.Figure 9:61.Images in 78-year-old man with unresectable anaplastic astrocytoma (arrow) (World Health Organization Grade 3), seen on, A, postcontrast T1-weighted and, B, FLAIR images. C, ASLarterial spin labeling image demonstrates increased CBFcerebral blood flow (arrow) in the region of the tumor. D, Increased cerebral blood volume (arrow) is also visibleon bolus DSCdynamic susceptibility contrast image, though it is more difficult to appreciate due to the extensive number of arterial and venous vessels that surround the tumor. The findings of high CBFcerebral blood flow are characteristic of high-grade (grades III and IV) glial neoplasms.62.63.64.65.66.Figure 10:67.A, T2-weighted, B, postcontrast T1-weighted, and C, ASLarterial spin labeling images in a 40-year-old man with von Hippel Lindau disease and multiple hemangioblastomas after multiple prior surgeries. Arrows point to the extremely high CBFcerebral blood flow measured with ASLarterial spin labeling even in very small lesions.68.69.70.71.72.Figure 11:73.Images in 57-year-old man with lung cancer brain metastasis 15 months after resection, radiation, and chemotherapy. A, Axial T1-weighted gadolinium-enhanced image shows a new enhancing lesion, with, B, axial fluid-attenuated inversion recovery image demonstrating extensive vasogenic edema in the region of the resection cavity. C, ASLarterial spin labeling image demonstrates no increase in CBFcerebral blood flow in this region, similar to findings on, D, FDGfluorine 18 fluorodeoxyglucose PET image. These findings were considered to represent radiation necrosis and the patient is being followed serially rather than with re-resection.74.75.76.77.78.Figure 12:79.Images in 29-year-old woman with bilateral Moyamoya disease. Both, A, fluid-attenuated inversion recovery and, B, diffusion-weighted images show evidence of prior infarcts in the deep white matter on the left side. C, Multidelay ASLarterial spin labeling image acquired at baseline shows normal CBFcerebral blood flow in the bilateral anterior circulation. D, However, image obtained 10 minutes after intravenous administration of 1 g of acetazolamide demonstrates the expected CBFcerebral blood flow increase in the posterior circulation but marked reduction in CBFcerebral blood flow in both anterior circulations, compatible with cerebrovascular steal. This finding has been associated with a high risk of subsequent cerebrovascular events and prompted bilateral direct superficial temporal artery-middle cerebral artery bypass.80.81.82.83.84.Figure 13:85.Functional connectivity analysis of ASLarterial spin labeling raw data in 154 healthy elderly control subjects and 66 cases with mild cognitive impairment. Note that for illustrative purposes, the raw ASLarterial spin labeling data were directly analyzed by using tensorial independent component in FSL (/fsl/), an established technique optimized for functional MR imaging analysis. A, Spatial representation of one of the independent components. B, The on-off labeling pattern of the raw ASLarterial spin labeling data is clearly visible on the corresponding temporal representation. Currently ongoing methodological adaptation and optimization to the specific properties of ASL data, such as implementing the known prior knowledge of the on-off time course, will improve the quality of ASL-derived functional connectivity networks.86.选自:87.Arterial Spin Labeling Perfusion of the Brain: Emerging Clinical Applications88.Sven Haller, Greg Zaharchuk, David L. Thomas, Karl-Olof Lovblad, Frederik Barkhof, and Xavier Golay89.Radiology 2016 281:2, 337-356全文见:/doi/full/10.1148/radiol.2016150789。
3D ASL脑灌注成像:不同标记后延迟时间对血流测量的影响赵光明;唐纳;张洁;张贵祥;孟捷【摘要】目的:探讨3D-ASL MRI中不同标记后延迟时间对脑血流量测量值的影响.方法:选取43例健康成人志愿者(男21例,女22例;年龄25~60岁,平均41岁),采用不同标记后延迟时间(1025 ms,1525ms,2025 ms)行3D-ASL检查,测量6个部位的血流量(CBF),包括小脑皮层、丘脑核团、枕叶、颞叶、顶叶和额叶皮层.三组(不同标记后延迟时间)间各脑区CBF值的比较采用方差分析,并进行两两比较分析.结果:方差分析结果显示三组间双侧小脑半球和左侧顶叶CBF值的差异有统计学意义(右小脑半球,F值6.629,P值0.011;左小脑半球,F值6.986,P值0.007;左顶叶,F 值5.143,P值0.020).进一步两两比较结果显示,双侧小脑半球、右枕叶和左顶叶的CBF值在1025 ms组与1525ms、1025ms组与2025 ms组间差异有统计学意义(P<0.05),在1525ms组与2025ms组间差异无统计学意义比较(P>0.05).结论:3D-ASL MRI中不同标记后延迟时间对脑血流量的测量有一定影响.【期刊名称】《放射学实践》【年(卷),期】2016(031)012【总页数】4页(P1168-1171)【关键词】磁共振成像;动脉自旋标记;标记后延迟时间;脑血流量【作者】赵光明;唐纳;张洁;张贵祥;孟捷【作者单位】200080上海,上海交通大学附属第一人民医院放射科;200080上海,上海交通大学附属第一人民医院放射科;200080上海,上海交通大学附属第一人民医院放射科;200080上海,上海交通大学附属第一人民医院放射科;200080上海,上海交通大学附属第一人民医院放射科【正文语种】中文【中图分类】R445.2;R743磁共振动脉自旋标记(arterial spin-labeling,ASL)灌注成像无需注射外源性对比剂,标记信号衰减快,具有短时间内可以重复检查、简便、快速而且完全无创等优点[1-4]。
ASL脑部灌注的原理及临床应用1. 引言Arterial Spin Labeling(ASL)是一种用于非侵入性测量脑部灌注的成像技术。
本文将介绍ASL脑部灌注的原理以及其在临床应用中的意义。
2. 原理ASL利用自身血流作为内部对照,通过对血流的标记来测量脑部灌注量。
其主要原理如下:•步骤1:用标记脉冲标记入颅内流动的磁化血水,此过程通常使用短暂的RF激脉。
•步骤2:标记脉冲后,磁化血水将继续流动并提供灌注给脑组织。
•步骤3:一段延迟时间后,将进行成像以测量在标记后之灌注和以标记前脑血流强度的差异。
3. 优势和局限性ASL脑部灌注成像技术相较于其他成像技术具有以下优势和局限性:3.1 优势•无需使用外部对比剂:ASL使用自身血流作为对照,无需注射对比剂,避免了对比剂可能带来的不良反应和肾脏负担。
•非侵入性:ASL成像是一种无创的技术,无需穿刺或侵入性操作。
•可重复性:由于不涉及使用对比剂,ASL能够进行多次重复扫描来观察脑部血氧水平的动态变化。
3.2 局限性•低信噪比:由于ASL是一种低信噪比的技术,其成像结果受到噪声的干扰,因此在实际应用中需要谨慎分析结果。
•灌注灵敏度限制:相比于其他成像技术,ASL受限于其对脑部灌注灵敏度的限制,对于某些特定的病理情况可能无法准确评估。
•空间覆盖范围小:由于脑部血管结构的限制,ASL的成像范围相对较小,无法全面评估整个脑部灌注情况。
4. 临床应用ASL脑部灌注成像技术在临床应用中具有广泛的意义,以下列举了几个典型的临床应用:4.1 早期脑缺血检测ASL脑部灌注成像可以通过测量脑组织的灌注情况来评估脑缺血的程度和范围,从而帮助早期诊断脑缺血。
4.2 脑血流动力学评估ASL脑部灌注成像可以评估脑血流动力学参数,如脑灌注量、脑灌注压和脑血流自主调节等,为对脑血流情况的研究提供重要信息。
4.3 神经精神疾病诊断ASL脑部灌注成像被广泛应用于神经精神疾病的诊断和评估,如脑血管病、阿尔茨海默病和抑郁症等,帮助医生了解脑部功能和结构的变化。
70 影像研究与医学应用 2020年5月 第4卷第10期脑转移瘤发病率为颅内肿瘤的3.5%~10%,属于发病率较高的脑肿瘤之一。
随着医疗技术的不断发展,ASL灌注成像的逐渐普及应用。
放射治疗主要是通过破坏肿瘤细胞的DNA,诱导细胞产生凋亡,或是引起肿瘤间质纤维增生与小血管损伤。
ASL灌注成像反映的就是组织的微血管功能状况[1-2]。
我院在对脑转移瘤放射治疗过程当中,使用ASL灌注成像进行评估放射治疗疗效,取得满意效果,现报道如下。
1 资料与方法1.1 一般资料选取我院2016年5月—2017年5月确诊为脑转移瘤,同时进行放射治疗的50例患者。
将所选患者随机平均分为两组,其中对照组男10例,女15例,年龄分布于57~73岁之间,平均年龄(65.55±8.4)岁。
研究组男13例,女12例,年龄分布于58~73岁之间,平均年龄(66.46±7.5)岁。
患者均知情同意本研究,一般资料具有可比性(P>0.05),同时经过医院伦理委员会批准。
1.2 方法对患者进行脑转移瘤放射治疗前、放疗结束后1个月、3个月、6个月行常规MR检查、增强检查及ASL灌注成像,获得3D ASL的脑血流量(CBF)图。
治疗过程中观测每一位患者的CBF图,并结合常规序列扫描图像,测量层面为瘤体实性最大层面。
T2FLAIR、T2、T1增强图像与CBF图对照观察,观察肿瘤的实性强化部分的灌注情况,分高灌注组、低灌注组、不确定组。
在CBF图上划分4个感兴趣区,取得各个感兴趣区的平均值,并计算出相对值,全脑的CBF值,平均肿瘤血流量TBF和最大肿瘤血流量TBFmax。
观察两组数据的差异,以此预测肿瘤的放射性治疗效果。
调查统计患者ASL灌注成像治疗后一个月、六个月的治疗区域性血流量(rCBF)、局部脑血容量(rCBV)。
1.3 观察指标放射治疗后一个月、六个月的治疗区域的血流量(rCBF)、局部脑血容量(rCBV)、以及患者全脑的CBF值,平均肿瘤血流量TBF等数据监测状况的评分1.4 统计学方法数据应用SPSS18.0进行分析,其中计数进行χ2(%)检验,计量进行t检测(x-±s)检验,P<0.05提示有显著差异。