中级宏观经济学(Macroeconomics)考试试题答案
- 格式:doc
- 大小:134.50 KB
- 文档页数:39
Microeconomics, 4e (Perloff)Chapter 4 Consumer Choice4.1 Preferences1) An indifference curve represents bundles of goods that a consumerA) views as equally desirable.B) ranks from most preferred to least preferred.C) refers to any other bundle of goods.D) All of the above.Answer: ATopic: Preferences2) The assumption of completeness means thatA) the consumer can rank all possible consumption bundles.B) more of a good is always better.C) the consumers can rank all affordable consumption bundles.D) all preferences conditions are met.Answer: ATopic: Preferences3) If a consumer prefers Apples to Bananas and prefers Bananas to Citrus Fruit, in order to satisfy assumptions about preferences she has to preferA) Bananas to Apples.B) Citrus Fruit to Bananas.C) Apples to Citrus Fruit.D) Citrus Fruit to Apples.Answer: CTopic: Preferences4) The principle that "More is better" results in indifference curvesA) sloping down.B) not intersecting.C) reflecting greater preferences the further they are from the origin.D) All of the above.Answer: DTopic: Preferences5) There is an indifference curve through every bundle because of the assumption ofA) transitivity.B) completeness.C) rationality.D) nonsatiation.Answer: BTopic: Preferences6) Indifference curves are downward sloping because of the assumption ofA) completeness.B) transitivity.C) more is better.D) All of the above.Answer: CTopic: Preferences7) If two indifference curves were to intersect at a point, this would violate the assumption ofA) transitivity.B) completeness.C) Both A and B above.D) None of the above.Answer: ATopic: Preferences8) Indifference curves that are thick violateA) the assumption of transitivity.B) the assumption that more is better.C) the assumption of completeness.D) none of the assumptions.Answer: BTopic: Preferences9) A consumer's willingness to trade one good for another can be expressed by the consumer'sA) indifference curve.B) marginal rate of substitution.C) Both A and B above.D) None of the above.Answer: CTopic: Preferences10) Convexity of indifference curves implies that consumers are willing toA) give up more "y" to get an extra "x" the more "x" they have.B) give up more "y" to get an extra "x" the less "x" they have.C) settle for less of both "x" and "y".D) acquire more "x" only if they do not have to give up any "y".Answer: BTopic: Preferences11) Measuring "y" on the vertical axis and "x" on the horizontal axis, convexity of indifference curves implies that the MRS of "y" for "x"A) is decreasing as "x" increases.B) is increasing as "x" increases.C) is constant as "x" increases.D) cannot be calculated for large levels of "x".Answer: ATopic: Preferences12) Diminishing marginal rate of substitution can be seen when indifference curvesA) cross.B) are convex.C) are downward sloping.D) become flatter as we move down and to the right.Answer: DTopic: Preferences13) For which of the following pairs of goods would most people likely have convex indifference curves?A) nickels and dimesB) left shoes and right shoesC) movie tickets and concert ticketsD) None of the above.Answer: CTopic: Preferences14) If two goods are perfect substitutes, then the indifference curves for those two goods would beA) upward sloping and concave to the origin.B) downward sloping and convex to the origin.C) downward sloping and straight.D) L-shaped.Answer: CTopic: Preferences15) The indifference curves for left shoes and right shoes would most likely beA) upward sloping and concave to the origin.B) downward sloping and convex to the origin.C) downward sloping and straight lines.D) L-shaped.Answer: DTopic: PreferencesFor the following, please answer "True" or "False" and explain why.16) Indifference curves cannot intersect.Answer:True. As seen in the above figure, points a and c are on the same indifference curve and are therefore equally preferred. Points b and c are also on the same indifference curve and are therefore equally preferred. Transitivity implies that the consumer would be indifferent between a and b; however, since more is preferred to less, a is preferred to b. Thus, as a result of the assumption of transitivity and the assumption that more is preferred to less, indifference curves cannot intersect.Topic: Preferences17) Indifference curves cannot ever be concave for two goods.Answer: False. While indifference curves are typically convex, they can be concave. This means, however, that the MRS of y for x increases as x increases. That is, the consumer places greater value on the next x the more x she has. The interpretation is that a consumer with concave indifference curves prefers to specialize in either x or y but not have a mix of both.Topic: Preferences18) Indifference curves for perfect substitutes must be parallel lines with a slope of negative one. Answer: False. Indifference curves for perfect substitutes are parallel lines, but the slope is not necessarily negative one.Topic: Preferences19) Indifference curves on the same indifference map can have different shapes.Answer: True. Indifference curves can meet all the necessary requirements and still have different shapes. Topic: Preferences20) Lisa views pizzas and burritos as goods. If she prefers a bundle of 4 burritos and 4 pizzas to a bundle of 4 burritos and 5 pizzas, which property of consumer preference is violated? What change in the assumptions could lead a rational consumer to prefer the first bundle?Answer: The property of more-is-better is violated. However, if pizza is a bad, then a rational consumer would prefer the first bundle.Topic: Preferences21) Explain why most indifference curves are convex.Answer: Diminishing marginal rates of substitution make most indifference curves convex. When people have a lot of one good, they are willing to give up a relatively larger amount of it to get a good of which they have relatively little.Topic: Preferences22) Draw the indifference curves for rock concerts and food for each of the following:(a) a typical 17-year-old(b) a typical 75-year-oldAnswer:See the above figure. These graphs assume that a typical 17-year-old would enjoy both food and rock concerts. The 75-year-old might find the rock concerts neutral or even bad.Topic: Preferences23) Draw the indifference curves for nickels and dimes. Would they ever have a non-constant slope? Explain.Answer:See the above figure. Two nickels are worth 1 dime. Yet, for extremely large amounts of money, people might prefer dimes to nickels for carrying purposes. That is why people often pay with exact change or don't like to break a twenty.Topic: Preferences4.3 Budget Constraint1) Joe's income is $500, the price of food (F) is $2 per unit, and the price of shelter (S) is $100. Which of the following represents his budget constraint?A) 500 = 2F + 100SB) F = 250 - 50SC) S = 5 - .02FD) All of the above.Answer: DTopic: Budget Constraint2) Joe's income is $500, the price of food (F) is $2 per unit, and the price of shelter (S) is $100. Which of the following represents his marginal rate of transformation of food for shelter?A) -5B) -50C) -.02D) None of the above.Answer: BTopic: Budget Constraint3) Joe's income is $500, the price of food (F) is $2 per unit, and the price of shelter (S) is $100. Which of the following represents his budget constraint?A) 500 = 100F + 2SB) 500 = 2F + 100SC) S = 500 - 2FD) All of the above.Answer: BTopic: Budget Constraint4) Joe's budget constraint equals 500 = 2F + 100S, where $500 is Joe's income, $2 is the price of food (F) and $100 is the price of shelter (S). How much food can Joe buy if he buys one unit of shelter?A) 2 unitsB) 200 unitsC) 250 unitsD) 400 unitsAnswer: BTopic: Budget Constraint5) Joe's income is $500, the price of food (F) is $2, and the price of shelter (S) is $100. Which of the following bundles is in Joe's opportunity set?A) 50 units of food, 5 units of shelterB) 200 units of food, 2 units of shelterC) 100 units of food, 1 unit of shelterD) 150 units of food, 3 units of shelterAnswer: CTopic: Budget Constraint6) The marginal rate of transformation of y for x representsA) the slope of the budget constraint.B) the rate at which the consumer must give up y to get one more x.C) - ⌧/⍓.D) All of the above.Answer: D Topic: Budget Constraint7) The marginal rate of transformation of y for x representsA) the slope of the budget constraint.B) the rate at which the consumer must give up x to get one more y.C) -P y/ P x.D) All of the above.Answer: ATopic: Budget Constraint8) The rate at which a consumer must give up y to get one more x is equal toA) – P x / P y.B) - P y / P x.C) – MU x / MU y.D) MU y / MU x.Answer: ATopic: Budget Constraint9) Betty consumes good x and good y. If the price of x = $3 and the price of y = $4, thenA) an extra unit of x costs 4/3 units of y.B) an extra unit of y costs 4/3 units of x.C) an extra unit of x costs 3/4 units of y.D) Both B and C.Answer: DTopic: Budget Constraint10) If the price of one good increases while the price of the other good and the consumer's income remain unchanged, what will happen to the budget line?A) The budget line rotates inward from the intercept on the axis of the good that did not change in price.B) The budget line rotates outward from the intercept on the axis of the good that did not change in price.C) The budget line shifts inward without a change in slope.D) The budget line shifts outward without a change in slope.Answer: ATopic: Budget Constraint11) Lisa eats both pizzas and burritos. If the price of a pizza increases, Lisa's opportunity setA) becomes larger.B) becomes smaller.C) is unchanged.D) cannot be determined without more information.Answer: BTopic: Budget Constraint12) If the consumer's income increases while the prices of both goods remain unchanged, what will happen to the budget line?A) The budget line rotates inward from the intercept on the horizontal axis.B) The budget line rotates outward from the intercept on the vertical axis.C) The budget line shifts inward without a change in slope.D) The budget line shifts outward without a change in slope.Answer: DTopic: Budget Constraint13) If the prices of both goods and income increase by the same percentage, what will happen to the budget line?A) The budget line rotates inward from the intercept on the axis of the good that did not change in price.B) The budget line rotates outward from the intercept on the axis of the good that did not change in price.C) The budget line shifts outward without a change in slope.D) Nothing.Answer: DTopic: Budget Constraint14) A consumer buys food (F) and shelter (S). If the consumer's income rises and there is no change in the prices of F or S, the marginal rate of transformation of F for S willA) increase.B) decrease.C) stay the same.D) change, but there is not enough information to know how.Answer: CTopic: Budget Constraint15) If both prices increases by 50%A) budget constraint will be unchanged.B) slope of the budget constraint stay the same.C) slope of the budget constraint will decrease.D) budget constraint will shift outward in a parallel fashion.Answer: BTopic: Budget Constraint16) If both prices decreases by 50%A) budget constraint will be unchanged.B) slope of the budget constraint will increase.C) slope of the budget constraint will decrease.D) budget constraint will shift outward in a parallel fashion.Answer: DTopic: Budget Constraint17) If a consumer's budget line for food (F) and shelter (S) is represented as F = 250 - 5S, we know thatA) the consumer's income is 250.B) the price of shelter is 5.C) the price of shelter is 5 times the price of food.D) All of the above.Answer: CTopic: Budget ConstraintFor the following, please answer "True" or "False" and explain why.18) The slope of the budget line represents the rate at which the consumer is willing to trade one good for another at any given bundle.Answer: False. This describes the slope of the indifference curve. The slope of the budget line represents the rate at which the consumer must trade one good for another at any given bundle.Topic: Budget Constraint19) Joe subscribes to an Internet provider that charges $2 per hour. Draw his budget line for Internet access on the horizontal axis and money spent on all other goods on the vertical axis assuming he has $100 per month to spend. Another company offers unlimited Internet access for a flat monthly fee of $20. Draw this budget line.Answer:See the above figure.Topic: Budget Constraint20) Lisa has an income of $100. She spends all of her income on pizza and burritos. A pizza costs $10 and a burrito costs $5. However, the store where Lisa buys her burritos has a special deal. After you've bought 6 burritos, then you can buy each burrito for $2.50. Draw Lisa's opportunity set.Answer:See the above figure.Topic: Budget Constraint21) Explain the difference between the marginal rate of substitution and the marginal rate of transformation. Answer: The marginal rate of substitution is a consumer's willingness to trade one good for another based on utility. The marginal rate of transformation is the consumer's ability to trade one good for another based on prices.Topic: Budget Constraint4.4 Constrained Consumer Choice1) Economists assume consumers select a bundle of goods that maximizes their well-being subject toA) their budget constraint.B) their income.C) relative prices.D) their marginal rate of substitution.Answer: ATopic: Constrained Consumer Choice2) An optimum that occurs as a corner solutionA) includes only one good.B) cannot be an equilibrium.C) cannot exhaust the budget constraint.D) includes the exact same amounts of each good.Answer: ATopic: Constrained Consumer Choice3) The consumer is in equilibrium whenA) MRT = MRS.B) P x / P y = MUx y / MU y.C) the budget line is tangent to the indifference curve at the bundle chosen.D) All of the above.Answer: DTopic: Constrained Consumer Choice4) By selecting a bundle where MRS = MRT, the consumer isA) achieving a corner solution.B) reaching the highest possible indifference curve she can afford.C) not behaving in an optimal way.D) All of the above.Answer: BTopic: Constrained Consumer Choice5) By selecting a bundle where MRS = MRT, the consumer is sayingA) "I value my last unit of each good equally."B) "I am willing to trade one good for the other at the same rate that I am required to do so."C) "I will equate the amounts spent on all goods consumed."D) All of the above.Answer: BTopic: Constrained Consumer Choice6) Assume the price of beer is $4, the price of pizza is $10 and the consumer's income is $250. Which consumption bundle will NOT be the consumers choice?A) A(5 Beer, 5 Pizza)B) B(0 Beer, 25 Pizza)C) C(25 Beer, 15 Pizza)D) None of the bundle will be chosen.Answer: ATopic: Constrained Consumer Choice7) With respect to consuming food and shelter, two consumers face the same prices and both claim to be in equilibrium. We therefore know thatA) they both have the same marginal utility for food.B) they both have the same marginal utility for shelter.C) they both have the same MRS of food for shelter.D) All of the above.Answer: CTopic: Constrained Consumer Choice8) Johnny has allocated $30 toward coffee and tea and feels that coffee and tea are perfect substitutes. Due to differences in caffeine levels, his MRS of tea for coffee equals 2. If coffee and tea sell for the same price, Johnny willA) spend all $30 on tea.B) spend all $30 on coffee.C) spend $20 on coffee and $10 on tea.D) be indifferent between any bundle of coffee and tea costing $30.Answer: BTopic: Constrained Consumer Choice9) Max has allocated $100 toward meats for his barbecue. His budget line and an indifference map are shown in the above figure. Which bundle will Max choose?A) aB) bC) cD) dAnswer: BTopic: Constrained Consumer Choiceshown in the above figure. What is the price of chicken?A) $0.80/lbB) $1.25/lbC) $4/lbD) $5/lbAnswer: DTopic: Constrained Consumer Choice11) Max has allocated $100 toward meats for his barbecue. His budget line and an indifference map are shown in the above figure. If the price of burger increases,A) Max will buy less burger and more chicken.B) Max will buy less burger and the same quantity of chicken.C) Max will buy less of both meats.D) More information is needed to answer the question.Answer: DTopic: Constrained Consumer Choice12) Max has allocated $100 toward meats for his barbecue. His budget line and an indifference map are shown in the above figure. What happens if Max's mother gives him 10 pounds of burger?A) Max would have preferred receiving the dollar value of the burger.B) Max is indifferent between this gift and the dollar value of the burger.C) Max prefers this gift to the dollar value of the burger.D) None of the above.Answer: BTopic: Constrained Consumer Choice13) Max has allocated $100 toward meats for his barbecue. His budget line and an indifference map are shown in the above figure. What happens if Max's mother gives him 30 pounds of burger?A) Max would have preferred receiving the dollar value of the burger.B) Max is indifferent between this gift and the dollar value of the burger.C) Max prefers this gift to the dollar value of the burger.D) None of the above.Answer: ATopic: Constrained Consumer Choice14) Max has allocated $100 toward meats for his barbecue. His budget line and an indifference map are shown in the above figure. What happens if Max receives a $100 cash grant to buy either meat or chicken?A) Max will double his consumption of both meats.B) Max will spend it all on burger. Because of its lower price, he can buy more of it.C) Max will take advantage of the gift by buying all chicken because it is the more expensive meat.D) There is not enough information to answer the question.Answer: ATopic: Constrained Consumer Choice15) Max has allocated $100 toward meats for his barbecue. His budget line and an indifference map are shown in the above figure. Which of the following best describes Max's preferences?A) d > b > eB) d = b = eC) a = b > cD) a = b > eAnswer: DTopic: Constrained Consumer Choiceshown in the above figure. Which of the following bundles are in Max's opportunity set?A) a, b, cB) b, d, eC) a, b, dD) None of the above.Answer: BTopic: Constrained Consumer Choice17) Max has allocated $100 toward meats for his barbecue. His budget line and indifference map are shown in the above figure. If the price of burger increases, which of the following bundles are in Max's opportunity set?A) b, d, eB) d, eC) a, b, c, d, eD) None of the labeled points are in Max's opportunity set.Answer: DTopic: Constrained Consumer Choice18) Cash may be preferred to food stamps because additional cashA) rotates the budget constraint.B) shifts out the budget constraint at every point.C) provides a smaller opportunity set.D) allows the purchase of more food.Answer: BTopic: Constrained Consumer Choice19) Max has allocated $100 toward meats for his barbecue. His budget line and indifference map are shown in the above figure. If Max is currently at point eA) his MRS is less than the trade-off offered by the market.B) is willing to give up more burger than he has to given market prices.C) is not maximizing his utility.D) All of the above.Answer: DTopic: Constrained Consumer Choice20) Max has allocated $100 toward meats for his barbecue. His budget line and indifference map are shown in the above figure. If Max is currently at point dA) his MRS is larger than the trade-off offered by the market.B) is willing to give up more chicken than he has to given market prices.C) is not maximizing his utility.D) All of the above.Answer: DTopic: Constrained Consumer ChoiceFor the following, please answer "True" or "False" and explain why.21) Consumers do not prefer gifts-in-kind to cash gifts.Answer: True. It is possible the consumer would buy the same gift with cash and therefore be just as well off. If the consumer bought something other than the gift, that means that this something else is preferred to the gift. At best, the gift yields the same utility as would have been achieved with the cash, but never more. Topic: Consumer's Constrained Choice22) If MRS > MRT, then the consumer is better off than at equilibrium.Answer: False. MRS > MRT implies that the consumer values the next unit of "x" more than it costs to obtain it. That is, there is a gain from trade to be made. As more "x" is purchased, MRS falls and eventually MRS = MRT. At this point, all gains from trade have been made.Topic: Constrained Consumer Choice23) Joe subscribes to an Internet provider that charges $2 per hour. He has $100 per month to spend and is at equilibrium by buying 10 hours of Internet access and $80 worth of other goods. Draw the indifference curve and budget line. If the company switches to a $20 monthly fee for unlimited Internet access, is Joe better off? Answer:See the above figure. Under the new plan Joe can still purchase his original bundle and get additional time on the Internet for free. Note that had Joe been consuming less than 10 hours at $2 per hour, the new pricing policy would leave him worse off.Topic: Constrained Consumer Choice24) Suppose Joe's utility for lobster (L) and soda (S) can be represented as U = L0.5 S0.5. Joe walks into a restaurant with $72. Lobsters cost $18 each and sodas cost $2 each. How much lobster and soda will Joe consume if he intends to spend all his money? (There are no tax and no tips.)Answer: Maximizing Joe's utility subject to his budget constraint yields:U = L0.5 S0.5 + l(72 - 18L - 2S)1. dU/dL = 0.5 L-0.5 S0.5. - l18 = 02. dU/dL = 0.5 L0.5 S-0.5 - l2 = 03. dU/dL = 72 - 18L - 2S = 0From 1) and 2), S/L = 9 or S = 9L. Substituting into 3) yields 72 - 36L = 0 or L = 2. Since S = 9L, S = 18. Thus, Joe will buy 2 lobsters and wash it all down with 18 sodas.Topic: Constrained Consumer Choice25) Joe's indifference map for lobster and soda is shown in the above figure along with his budget line. Will Joe choose point a? Explain your answer in terms both of MRS and the level of utility.Answer: Joe will not choose point a. Since the slope of his budget line tells us that he must give up only 9 sodas to get a lobster, Joe will wish to buy more lobsters and less soda than bundle a provides. From a utility standpoint, Joe will not choose point a because another bundle that lies on a higher indifference curve is obtainable.Topic: Constrained Consumer Choice26) John is indifferent between canned soup and fresh soup. Canned soup sells for $1 per serving and fresh soup sells for $2 per serving. Assuming that John has allocated $4 toward soup, how will he spend it? Explain your answer by drawing John's budget line and indifference curves.Answer:See the above figure. Canned and fresh soups are perfect substitutes. A corner solution exists where John spends all $4 on canned soup.Topic: Constrained Consumer Choice27) Suppose that left shoes and right shoes must be purchased separately. Ingrid needs an equal number of each type of shoe and has a budget of $100 for shoes. Left shoes always cost $1. If right shoes cost $19 each, how many of each will Ingrid buy? If the price of right shoes increases to $49 each, how will Ingrid react? Explain your answer by drawing the indifference curves and budget lines.Answer:See the above figure. Since Ingrid needs an equal number of each type of shoe, left shoes and right shoes are perfect complements. If right shoes are $19 each, Ingrid purchases 5 pairs of shoes. If right shoes are $49 each, Ingrid purchases 2 pairs.Topic: Constrained Consumer Choice28) Johnny has $100 to spend on books and all other goods. Books cost $20 each and Johnny is at equilibrium consuming 3 books and $40 worth of other goods. Johnny's grandmom wants to give Johnny either a book or $20 for his birthday. Which gift does Johnny prefer? Explain using an indifference map and budget lines.Answer:See the above figure. Since Johnny's equilibrium book consumption exceeds the quantity of books in the gift-in-kind, Johnny is indifferent between receiving the book or the cash. Had Johnny been consuming less than one book, he would have preferred the cash.Topic: Constrained Consumer Choice29) Lisa consumes only pizzas (P) and burritos (B). Her utility function is U = P0.5 B0.5. The price of per pizza is $10 and the price per burrito is $5. In equilibrium, Lisa consumes 4 pizzas. Using Lisa's utility function, calculate how many burritos she consumes.Answer: The marginal utility of pizza equals B0.5/2P0.5. The marginal utility of a burrito equals P0.5/2B0.5. In equilibrium, the ratio of the marginal utilities will equal the ratio of prices. The ratio of marginal utilities simplifies to B/P. The ratio of prices is 10/5. Since we know that Lisa consumes 4 pizzas, she must consume 8 burritos.Topic: Constrained Consumer Choice30) Lisa consumes only pizzas and burritos. In equilibrium, her marginal utility of pizza is 20 and her marginal utility of a burrito is 10. The price of a pizza is $4. What is the price of a burrito?Answer: In equilibrium, the ratio of the marginal utility of a pizza divided by the price of a pizza must equal the marginal utility of a burrito divided by the price of a burrito. Thus, the price of a burrito must be $2. Topic: Constrained Consumer Choice21。
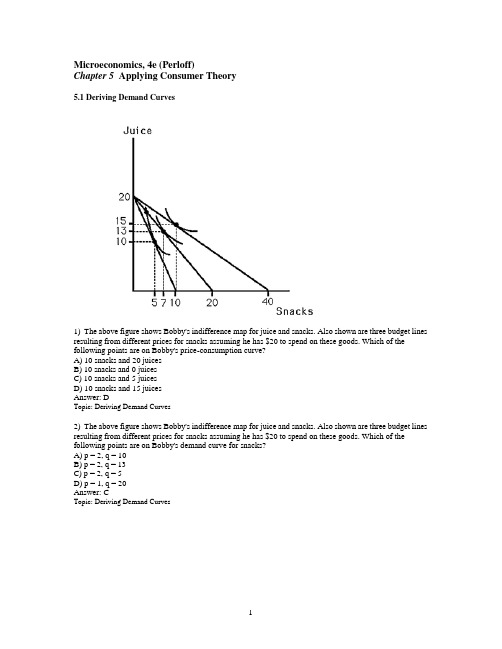
Microeconomics, 4e (Perloff)Chapter 5 Applying Consumer Theory5.1 Deriving Demand Curves1) The above figure shows Bobby's indifference map for juice and snacks. Also shown are three budget lines resulting from different prices for snacks assuming he has $20 to spend on these goods. Which of the following points are on Bobby's price-consumption curve?A) 10 snacks and 20 juicesB) 10 snacks and 0 juicesC) 10 snacks and 5 juicesD) 10 snacks and 15 juicesAnswer: DTopic: Deriving Demand Curves2) The above figure shows Bobby's indifference map for juice and snacks. Also shown are three budget lines resulting from different prices for snacks assuming he has $20 to spend on these goods. Which of the following points are on Bobby's demand curve for snacks?A) p = 2, q = 10B) p = 2, q = 13C) p = 2, q = 5D) p = 1, q = 20Answer: CTopic: Deriving Demand Curves3) The above figure shows Bobby's indifference map for juice and snacks. Also shown are three budget lines resulting from different prices for snacks. This information could be used to determineA) the slope of Bobby's demand curve for juice.B) the amount by which Bobby's demand curve for juice shifts when his income rises.C) the amount by which Bobby's demand curve for juice shifts when the price of snacks rises.D) All of the above.Answer: CTopic: Deriving Demand Curves4) The above figure shows Bobby's indifference map for juice and snacks. Also shown are three budget lines resulting from different prices for snacks. As the price of snacks rises, Bobby's utilityA) stays the same.B) increases.C) decreases.D) might change, but there is not enough information to determine.Answer: CTopic: Deriving Demand Curves5) The above figure shows Bobby's indifference map for juice and snacks. Also shown are three budget lines resulting from different prices for snacks. Bobby's demand for snacks isA) unit elastic.B) elastic.C) inelastic.D) perfectly elastic.Answer: CTopic: Deriving Demand Curves6) The above figure shows Bobby's indifference map for juice and snacks. Also shown are three budget lines resulting from different prices for snacks. As the price of snacks rises, the price for juiceA) stays the same.B) increases.C) decreasesD) might change, but there is not enough information to determine.Answer: ATopic: Deriving Demand Curves7) An individual's demand curve for a good can be derived by measuring the quantities selected asA) the price of the good changes.B) the price of substitute goods changes.C) income changes.D) All of the above.Answer: ATopic: Deriving Demand Curves8) As the price of a good rises, the consumer will experienceA) a desire to consume a different bundle.B) a decrease in utility.C) a southwesterly movement on the indifference map.D) All of the above.Answer: DTopic: Deriving Demand Curves9) An increase in the price of a good causesA) a change in the slope of the budget line.B) an increase in the consumption of that good.C) a rightward shift of the demand curve for that good.D) a parallel rightward shift of the budget line.Answer: ATopic: Deriving Demand Curves10) Suppose a graph is drawn to show a consumer's preferences for football tickets and basketball tickets. The quantity of football tickets is measured on the horizontal axis. If the price-consumption curve is horizontal when the price of football tickets changes, thenA) football tickets are an inferior good.B) the demand for football tickets is perfectly elastic.C) the demand for football tickets is unit elastic.D) the demand curve for football tickets will be horizontal.Answer: CTopic: Deriving Demand Curves11) In the relevant price range a demand curve for a Giffen good would beA) upward sloping.B) downward sloping.C) horizontal.D) vertical.Answer: ATopic: Deriving Demand Curves12) Suppose the quantity of x is measured on the horizontal axis. If the price consumption curve is vertical when the price of x changes, then the demand for x isA) perfectly elastic.B) perfectly inelastic.C) unit elastic.D) There is not enough information to determine the price elasticity of demand for x.Answer: BTopic: Deriving Demand CurvesFor the following, please answer "True" or "False" and explain why.13) If the price-consumption curve is upward sloping when the price of the good measured on the horizontal axis changes, then the demand curve for that good will be upward sloping.Answer: False. An upward-sloping price-consumption curve indicates that as the price of the good falls, more of both goods will be purchased. So, the demand curve for the good measured on the horizontal axis slopes downward.Topic: Deriving Demand Curves14) Draw two graphs, one directly above the other. On the upper graph, label the vertical axis Good X and label the horizontal axis Good Y. On the lower graph, label the vertical axis the Price of good Y and label the horizontal axis Good Y. In the upper graph, show the income and substitution effects of a decrease in the Price of good Y when Y is a Giffen good. Draw the corresponding demand curve for Good Y in the lower graph.Answer:See the above figure. Point A is the original consumption point. The movement from point A to point B is the substitution effect. The movement from point B to point C is the income effect.Topic: Deriving Demand Curves15) The above figure shows a consumer's indifference curves for soda and all other goods. Assuming a budget of $100, derive the consumer's demand for soda for prices of $4 and $10 per case of soda. Estimate the price elasticity of demand for soda.Answer: At a price of $4, 15 cases are purchased, At a price of $10, 6 cases are purchased. In both cases, the same total amount, $60, is spent on soda. This implies unit elasticity.Topic: Deriving Demand Curves16) Use the Slutsky equation to show that a Giffen good must be an inferior good, BUT an inferior good need not be a Giffen good.Answer: The Slutsky equation may be written as dQ/dp Total dp Total = dQ/ dp subs - _(dQ/dI). For a Giffen good, dQ/dp Total is positive, which implies that - _(dQ/dI) must be positive and large enough to offset dQ/ dp subs, which is always negative. For any inferior good, however, - _(dQ/dI) is positive but not necessarily large enough to make dQ/ dp Total positive.Topic: Deriving Demand Curves5.2 How Changes in Income Shift Demand Curves1) A movement upward along an upward sloping Engel curve corresponds toA) upward sloping indifference curves.B) crossing indifference curves.C) a rotation in the budget constraint.D) a parallel shift in the budget constraint.Answer: DTopic: How Changes in Income Shift Demand Curves2) When deriving an Engel curve the prices of both goodsA) are held constant.B) increase by the same percentage as income.C) decrease by the same percentage as income.D) can either decrease, increase or stay the same.Answer: ATopic: How Changes in Income Shift Demand Curves3) The above figure shows Larry's indifference map and budget lines for ham and pork. Which of the following statements is TRUE?A) Pork is an inferior good.B) Ham is an inferior good.C) Neither pork nor ham is an inferior good.D) Both ham and pork are inferior goods.Answer: BTopic: How Changes in Income Shift Demand Curves4) The above figure shows Larry's indifference map and budget lines for ham and pork. Which of the following statements is TRUE?A) Larry's Engel curve for pork will be upward sloping.B) Larry's Engel curve for pork will be downward sloping.C) Larry's Engel curve for pork will be backward bending.D) Larry's Engel curve for pork cannot be derived from the information provided.Answer: ATopic: How Changes in Income Shift Demand Curves5) The above figure shows Larry's indifference map and budget lines for ham and pork. Which of the following statements is TRUE?A) Larry's demand curve for pork shifts rightward when his income increases.B) Larry's income elasticity of demand for pork is greater than zero.C) Pork is a normal good.D) All of the above.Answer: DTopic: How Changes in Income Shift Demand Curves6) After Joyce and Larry purchased their first house, they made additional home improvements in response to increases in income. After a while, their income rose so much that they could afford a larger home. Once they realized they would be moving, they reduced the amount of home improvements. Their Engel curve for home improvements on their current home isA) negatively sloped.B) flat.C) positively sloped.D) backward bending.Answer: DTopic: How Changes in Income Shift Demand Curves7) Suppose the quantity of x is measured on the horizontal axis. If the income consumption curve is vertical, then the income elasticity of demand for x isA) 0.B) 1.C) -1.D) There is not enough information to determine the income elasticity of demand for x.Answer: ATopic: How Changes in Income Shift Demand Curves8) An inferior good exhibitsA) a negative income elasticity.B) a downward sloping Engel curve.C) a decline in the quantity demanded as income rises.D) All of the above.Answer: DTopic: How Changes in Income Shift Demand Curves9) When John's income was low, he could not afford to dine out and would respond to a pay raise by purchasing more frozen dinners. Now that his income is high, a pay raise causes him to dine out more often and buy fewer frozen dinners. Which graph in the above figure best represents John's Engel curve for frozen dinners?A) Graph AB) Graph BC) Graph CD) Graph DAnswer: ATopic: How Changes in Income Shift Demand Curves10) When John's income was low, he could not afford to dine out and would respond to a pay raise by purchasing more frozen dinners. Now that his income is high, a pay raise causes him to dine out more often and buy fewer frozen dinners. Which graph in the above figure best represents John's Engel curve for dining out?A) Graph AB) Graph BC) Graph CD) Graph DAnswer: BTopic: How Changes in Income Shift Demand Curves11) Even though Mary's income is very low, she makes sure that she purchases enough milk for her family to drink. As her income rises, she does buy more milk. Which graph in the above figure best represents Mary's Engel curve for milk?A) Graph AB) Graph BC) Graph CD) Graph DAnswer: CTopic: How Changes in Income Shift Demand Curves12) When John was in college and his income was low, he drank "Red Ribbon" beer. As his income increased, he purchased better-quality beer and less "Red Ribbon." Which graph in the above figure best represents John's Engel curve for "Red Ribbon" beer?A) Graph AB) Graph BC) Graph CD) Graph DAnswer: DTopic: How Changes in Income Shift Demand Curves13) Which graph in the above figure best represents a good that is an inferior good at some income levels, and a normal good at other income levels?A) Graph AB) Graph BC) Graph CD) Graph DAnswer: ATopic: How Changes in Income Shift Demand Curves14) If consumer income and prices increase by the same percentageA) the consumer will buy more of both goods.B) the consumer will buy more of both goods if they are both normal goods.C) the consumer will buy less of both goods if they are both inferior goods.D) the consumer's utility maximizing bundle stays the same.Answer: DTopic: How Changes in Income Shift Demand CurvesFor the following, please answer "True" or "False" and explain why.15) An increase in income (all else equal) will ALWAYS lead to a parallel shift of the budget line. Answer: True. Since prices are unchanged the relative prices of the goods stays the same and thus the slope of the budget line.Topic: How Changes in Income Shift Demand Curves16) Explain what the slope of the income consumption curve shows about the income elasticity of demand. Answer: A positive slope of the income consumption curve is associated with a positive income elasticity of demand, and a negatively sloped income consumption curve is associated with a negative income elasticity of demand. The income consumption curve represents how consumption changes with an increase in income. An upward sloping income consumption curve represents an increase in consumption as income rises, as does a positive income elasticity.Topic: How Changes in Income Shift Demand Curves17) Why can't all goods be inferior?Answer: If all goods were inferior, an increase in income would lead to a decline in the quantity demanded for all goods. This, however, would leave the consumer below the budget line and therefore not achieving the highest utility possible.Topic: How Changes in Income Shift Demand Curves18) The above figure shows three different Engel curves. Rank them in terms of income elasticity. Answer: Engel curve A implies that a certain level of income is required before any of the good is purchased. Engel curve B implies that the quantity demanded is proportional to income (unit elastic). Engel curve C implies that the good is a necessity since it would be consumed even if income were zero. Thus _A > _B > _C.Topic: How Changes in Income Shift Demand Curves19) When income increases by 1%, the quantity demanded of a good decreases by 2%. What is the income elasticity of the good? Is the good normal or inferior? Why?Answer: The income elasticity is -2. The good is inferior because the income elasticity is negative.Topic: How Changes in Income Shift Demand Curves20) Why would you expect the demand for diamond jewelry to fall faster than plastic, costume jewelry when all incomes fall?Answer: The income elasticities differ for the two goods. Diamond jewelry most likely has a larger income elasticity than costume jewelry.Topic: How Changes in Income Shift Demand Curves21) Draw budget constraints, indifference curves, and the income consumption curve for a good that has an income elasticity that is perfectly inelastic.Answer:See the above figure.Topic: How Changes in Income Shift Demand Curves5.3 Effects of a Price Change1) Median household income is $50,000 per year. The typical household spends about $125 per year on milk, which has an income elasticity of about 0.07. From this information, we can conclude thatA) milk is a luxury.B) milk is a Giffen good.C) the income effect from a change in the price of milk is very large.D) the income effect from a change in the price of milk is very small.Answer: DTopic: Effects of a Price Change2) When the price of a good changes, the total effect of the price change on the quantities purchased can be found by comparing the quantities purchasedA) on the old budget line and the new budget line.B) on the original indifference curve when faced with the original prices and when faced with the new prices.C) on the new budget line and a hypothetical budget line that is a parallel shift back to the original indifference curve.D) on the new indifference curve.Answer: ATopic: Effects of a Price Change3) When the price of a good changes, the substitution effect can be found by comparing the equilibrium quantities purchasedA) on the old budget line and the new budget line.B) on the original indifference curve when faced with the original prices and when faced with the new prices.C) on the new budget line and a hypothetical budget line that is a shift back to the original indifference curve parallel to the new budget line.D) on the new indifference curve.Answer: BTopic: Effects of a Price Change4) When the price of a good changes, the income effect can be found by comparing the equilibrium quantities purchasedA) on the old budget line and the new budget line.B) on the original indifference curve when faced with the original prices and when faced with the new prices.C) on the new budget line and a hypothetical budget line that is a shift back to the original indifference curve parallel to the new budget line.D) on the new indifference curve.Answer: CTopic: Effects of a Price Change5) The substitution effect can be measured holding ________ constant.A) incomeB) utilityC) the price of one goodD) the price of all goodsAnswer: BTopic: Effects of a Price Change6) Suppose that frozen dinners were once a normal good for John, but now frozen dinners are an inferior good for him. John's demand curve for frozen dinnersA) has become steeper as a result.B) has become flatter as a result.C) has not changed as a result.D) has disappeared as a result.Answer: ATopic: Effects of a Price Change7) One characteristic of a Giffen good is that itA) is a luxury good.B) is an inferior good.C) has an upward-sloping Engel curve.D) All of the above.Answer: BTopic: Effects of a Price Change8) A Giffen good hasA) a positive substitution effect.B) a negative income effect.C) a larger income effect than substitution effect.D) All of the above.Answer: DTopic: Effects of a Price Change9) If a good is an inferior good, then itsA) demand curve will be upward sloping.B) income effect reinforces the substitution effect.C) income elasticity is negative.D) Engel curve cannot be drawn.Answer: CTopic: Effects of a Price Change10) Suppose Lisa spends all of her money on books and coffee. When the price of coffee decreases, theA) substitution effect on coffee is positive, and the income effect on coffee is positive.B) substitution effect on coffee is ambiguous, and the income effect on coffee is ambiguous.C) substitution effect on coffee is positive, and the income effect on coffee is ambiguous.D) substitution effect on coffee is ambiguous, and the income effect on coffee is positive.Answer: CTopic: Effects of a Price Change11) In the case of a normal goodA) demand curves always slope downward.B) the income effect and substitution effect are in the same direction.C) the Engel curve slopes upward.D) All of the above.Answer: DTopic: Effects of a Price Change12) The above figure shows Bobby's indifference map for soda and juice. B1 indicates his original budget line. B2 indicates his budget line resulting from a decrease in the price of soda. What change in quantity best represents his substitution effect?A) 3B) 10C) 15D) 7Answer: ATopic: Effects of a Price Change13) The above figure shows Bobby's indifference map for soda and juice. B1 indicates his original budget line. B2 indicates his budget line resulting from a decrease in the price of soda. What change in quantity best represents his income effect?A) 3B) 10C) 15D) 7Answer: DTopic: Effects of a Price Change14) The above figure shows Bobby's indifference map for soda and juice. B1 indicates his original budget line. B2 indicates his budget line resulting from an increase in the price of soda. From the graph, one can conclude thatA) Bobby views soda as an inferior good.B) Bobby's demand for soda is perfectly inelastic.C) Bobby views soda as a normal good.D) the income elasticity of demand for soda is 1.Answer: CTopic: Effects of a Price Change15) When measuring the substitution effect one uses the change alongA) the old indifference curve.B) the new indifference curve.C) either the old or the new indifference curve.D) the budget constraint.Answer: CTopic: Effects of a Price Change16) The Slutsky equation shows that, holding the total effect constant, the income effect will be larger for goods thatA) have a smaller substitution effect.B) make up a larger percentage of a household's budget.C) have perfectly inelastic demand curves.D) All of the above.Answer: BTopic: Effects of a Price Change17) Suppose that the interest rate paid to savers increases. As a result, Tom wishes to save less. This suggests that, for Tom,A) the substitution effect is greater than the income effect.B) the income effect is greater than the substitution effect.C) utility maximization is not occurring.D) future consumption is a luxury.Answer: BTopic: Effects of a Price Change18) Suppose that the interest rate paid to savers increases. As a result, Tom wishes to save more. This suggests that, for Tom,A) the substitution effect is greater than the income effect.B) the income effect is greater than the substitution effect.C) utility maximization is not occurring.D) future consumption is a luxury.Answer: ATopic: Effects of a Price ChangeFor the following, please answer "True" or "False" and explain why.19) If a consumer is compensated for the income effect that occurs when the price of a good increases, then his demand curves can never slope upward.Answer: True. The demand curve would only include the substitution effect. Even for Giffen goods, dq/dp is negative holding utility constant.Topic: Effects of a Price Change20) A good may be inferior at some income levels and normal at others.Answer: True. A consumer may demand more of the good at low income levels and less of the good at higher income levels. Hamburger or macaroni and cheese dinners may be examples of such goods.Topic: Effects of a Price Change21) If the Engel curve for a good is upward sloping, the demand curve for that good must be downward sloping.Answer: True. If the Engel curve is upward sloping, the good is normal. As a result, the income effect will reinforce the substitution effect and guarantee a downward-sloping demand curve.Topic: Effects of a Price Change22) Suppose Joe earns $1,000 in year 1 and $0 in year 2. Any amount he saves will earn interest at a rate of 10%. Draw Joe's budget line. (Hint: He can either consume all $1000 this year or consume nothing this year and have $1,100 next year.) Assuming convex indifference curves, show that an increase in the rate of interest can cause Joe's savings to either increase or decrease. Explain in terms of income and substitution effect.Answer:See the above figure. On the graph, his original bundle is e1 so that his savings equal 1000 - C1*. A higher interest rate rotates the budget line so that, depending on the shape of his indifference map, he may choose either e2, which means savings increase, or e3, which means savings decrease. One plus the interest rate represents the price of current consumption. A higher interest rate has two effects. The substitution effect means that Joe will save more because current consumption has become more expensive. The income effect says Joe will save less because, with the higher interest rate, lower savings could actually generate more future consumption.Topic: Effects of a Price Change23) Many manufacturers sell products labeled as having imperfections at a discount at their factory outlets but do not ship these imperfect goods to regular retail outlets. Why?Answer: There is some substitutability between the goods, but imperfects sell for a lower price. Suppose, for example, the good sells for $2, but imperfects sell for $1. Both goods cost the same to ship, say $1. As a result, the relative price of an imperfect at a factory outlet is (1/2) but rises to (2/3) at the retail outlet, where imperfects will not sell because of the higher relative price.Topic: Effects of a Price Change5.4 Cost-of-Living Adjustments1) Due to inflation, nominal prices are usuallyA) equal to real prices.B) smaller than real prices.C) larger than real prices.D) a constant proportion different from real prices.Answer: CTopic: Cost-of-Living Adjustments2) A consumer price index adjustment overcompensates for inflation because it ignoresA) the income effect when relative prices change.B) the substitution effect when relative prices change.C) that some goods are inferior.D) that the substitution effect may offset the income effect.Answer: BTopic: Cost-of-Living Adjustments3) Employing a fixed-weight index like the Consumer Price Index to adjust a person's salary in response to inflation will overcompensate this person because doing so will allow this person toA) buy the same bundle of goods as he did before the inflation.B) achieve a higher level of utility than he did before the inflation.C) achieve the same level of utility as before the inflation.D) buy more of all goods.Answer: BTopic: Cost-of-Living Adjustments4) Under which of the following conditions will there be no substitution bias in the CPI?A) Indifference curves are convex.B) Indifference curves are L-shaped.C) Indifference curves are linear.D) Indifference curves are downward sloping.Answer: BTopic: Cost-of-Living Adjustments5) Under which of the following conditions will there be no substitution bias in the CPI?A) Lower-priced goods increase in price by a greater percentage than do higher-priced goods.B) Higher-price goods increase in price by a greater percentage than do lower-priced goods.C) All goods change in price by the same amount.D) All goods change in price by the same percentage.Answer: DTopic: Cost-of-Living Adjustments6) A true cost-of-living adjustment in response to a change in prices would compensate consumers so that they would be able toA) purchase the same bundle they purchased before prices changed.B) achieve the same level of utility they did before prices changed.C) face the same choices they did before prices changed.D) achieve an increase in utility that is equal to the rate of inflation.Answer: BTopic: Cost-of-Living Adjustments7) Richard receives government transfer payments and currently consumes 5 guns and 6 goose livers. Assume the price of guns decreases by 10% and the price of goose liver increases by 20%. The government raises Richard's transfer payments so he can still afford 5 guns and 6 goose livers. Does this constitute a true cost-of-living adjustment?A) No. Richard is overcompensated.B) No. Richard is undercompensated.C) Yes. The payment just achieves the right level of compensation.D) Not enough information.Answer: ATopic: Cost-of-Living Adjustments8) Before an uneven rise in prices Allan consumed 5 bread and 6 juice. After the price increase and with an increased welfare payment from the government Allan consumes 4 bread and 7 juice. Does the government payment represent a true cost-of-living adjustment?A) Yes, if the two consumption bundles lie on the same indifference curve.B) Yes, if the second bundle yields more utility than the first.C) No, the first bundle is clearly preferred.D) Not enough information.Answer: ATopic: Cost-of-Living AdjustmentsFor the following, please answer "True" or "False" and explain why.9) Inflation over time necessarily makes consumers worse off.Answer: False. Wages also increase over time. Workers may earn the price of some goods in less time than in the past.Topic: Cost-of-Living Adjustments10) Using the CPI to compensate workers for inflation is appropriate because, in the face of a change in relative prices, people should be allowed to purchase the same bundle as they did before the price changes. Answer: False. This assumes that people would still prefer the original bundle. Because they are facing a new set of relative prices, compensating people so that they could purchase the original bundle will allow them to be able to achieve a higher level of utility than they did before the price changes.Topic: Cost-of-Living Adjustments11) Suppose the typical consumer only purchases food and clothing, and her utility can be expressed as U =F * C. Currently, food costs $5 per unit and clothing costs $2 per unit. Her income is $70. If the price of food increases to $6, compare the resulting Laspyre's price index with a true cost of living index.Answer: Maximizing utility subject to the initial constraint (5F + 2C = 70) yields C/F = 5/2 or F = 7 and C = 17.5. The Laspyre's price index calculates the ratio of the income necessary to achieve the original bundle relative to the original income. In this case [(6 * 7) + (2 * 17.5)]/70 = 1.10. The true cost of living index calculates the ratio of the income necessary to achieve the original level of utility relative to the original income. Utility is held constant when C * F = 17.5 * 7 = 122.5. The consumer is on the new budget line when C/F = 3. Combining yields F = 6.39 and C = 19.17. At the new prices, this requires an income of 76.68 and a resulting cost of living index of 76.68/70 = 1.095.Topic: Cost-of-Living Adjustments。

Microeconomics, 4e (Perloff)Chapter 7 Costs7.1 Measuring Costs1) Economic costs of an input includeA) only implicit costs.B) only explicit costs.C) both implicit and explicit costs.D) whatever management wishes to report to the shareholders.Answer: CTopic: Measuring Costs2) The cost of waiting two months for health care to address a debilitating problem in Canada is most accurately described asA) an explicit cost.B) an accounting cost.C) no real cost.D) an opportunity cost.Answer: DTopic: Measuring Costs3) Sarah earns $40,000 per year working for a large corporation. She is thinking of quitting this job to work full time in her own business. She will invest her savings of $50,000 (which currently has an annual 10% rate of return) into the business. Her annual opportunity cost of this new business isA) $0.B) $40,000.C) $45,000.D) $90,000.Answer: CTopic: Measuring Costs4) The Nifty Gum Co. has purchased a large parcel of land for $1 million. The company recently discovered that the land is contaminated and is worthless to all possible buyers. The opportunity cost of the land isA) $0.B) $1 million.C) some amount greater than $0 but less than $1 million.D) equal to the cost of the factory that was planned to be built there.Answer: ATopic: Measuring Costs5) Johnny has worked as a CPA for five years and wants to open his own public accounting practice. The cost of his college degree in accounting representsA) the opportunity cost of this endeavor.B) a sunk cost.C) an expense.D) a variable cost.Answer: BTopic: Measuring Costs6) Economists proclaim that competitive firms make zero economic profit in the long run. This shows howA) detached economists are from the real world.B) unrealistic economic theory is.C) firms cover all their cost, both monetary and non-monetary.D) firms cover only monetary cost when economic profits are zero.Answer: CTopic: Measuring Costs7) If a firm buys a building so as to have office space for its workers, the monthly opportunity cost of the building is best measured asA) the monthly mortgage payment the firm must pay.B) the price the firm paid divided by twelve.C) zero.D) the rent the firm could earn if it rented the building to another firm.Answer: DTopic: Measuring CostsFor the following, please answer "True" or "False" and explain why.8) When buying a piece of equipment, it is always best for the firm to pay cash instead of borrowing the funds since this renders the equipment less costly.Answer: False. It depends. The opportunity cost of the capital when paying cash is the interest the firm receives on its cash reserves. This is an implicit cost. The opportunity cost of the capital when the funds are borrowed is the interest the firm must pay to the lender. This is an explicit cost. If the rate the firm receives on its cash reserves exceeds the rate at which it borrows, the firm is better off borrowing the funds to buy the equipment.Topic: Measuring Costs9) Four years after graduating from college you must decide if you want to go on as an accountant (your college major) or if you want to make a career change and become a singer. The cost of your education will matter for your decision.Answer: False. At this point the cost of your education represents a sunk cost and therefore should not figure into your decision. You incur it no matter what decision you make.Topic: Measuring Costs10) An accountant may amortize the expense of a durable good by dividing the total amount spent on the good by the number of years the good is expected to last. An economist may amortize the expense of a durable and never fully account for the total expense.Answer: True. The accountant uses a set of predetermined rules to amortize the total expense of the good. The economist amortizes based on the opportunity cost of the good, which may never sum to the total expense of the good.Topic: Measuring Costs11) Your company makes copper pipes. Over the years, you have collected a large inventory of raw copper. The production process involves melting the copper and shaping it into pipes. You also have a large stockpile of pennies. Suppose the price of copper rises so much that the copper in the penny becomes worth more than one cent. Should you melt down your pennies?Answer: This problem appeared as a puzzle in the Journal of Economic Perspectives (Winter, 1988). It is true (in this problem) that the pennies when melted currently have a value greater than one cent. Yet, the price of copper can fluctuate. If the price of copper stays high, it does not matter if you melt pennies or not. However, if the price of copper falls so that the value of the copper in the penny falls below one cent, your unmelted pennies are still worth one cent. Your melted pennies would be worth less than one cent. Thus, as long as you have some other source of copper, you are better off melting that copper and not the pennies.Topic: Measuring Costs12) You have two career options. You can work for someone else for $50,000 a year, or, you can run your own business, with an annual revenue of $100,000, and explicit costs of $40,000 annually. Explain which career option a profit-maximizer would select and why.Answer: In the absence of other implicit costs a profit-maximizer will run their own business. The business owner will receive $100,000 - $40,000 = $60,000. The opportunity cost is only $50,000.Topic: Measuring Costs7.2 Short-Run Costs1) A firm's marginal cost can always be thought of as the change in total cost ifA) the firm produces one more unit of output.B) the firm buys one more unit of capital.C) the firm's average cost increases by $1.D) the firm moves to the next highest isoquant.Answer: ATopic: Short-run Costs2) Fixed costs areA) a production expense that does not vary with output.B) a production expense that changes with the quantity of output produced.C) equal to total cost divided by the units of output produced.D) the amount by which a firm's cost changes if the firm produces one more unit of output.Answer: ATopic: Short-run Costs3) Variable costs areA) a production expense that does not vary with output.B) a production expense that changes with the quantity of output produced.C) equal to total cost divided by the units of output produced.D) the amount by which a firm's cost changes if the firm produces one more unit of output.Answer: BTopic: Short-run Costs4) Which of the following statements is NOT true?A) AC = AFC + AVCB) C = F + VCC) AVC = wage/MP LD) AFC = AC - AVCAnswer: CTopic: Short-run Costs5) Joey's Lawncutting Service rents office space from Joey's dad for $300 per month. Joey's dad is thinking of increasing the rent to $400 per month. As a result Joey's marginal cost of cutting grass willA) increase by $100 divided by the amount of grass cut.B) increase by $100.C) decrease by $100.D) not change.Answer: DTopic: Short-run Costs6) Suppose a firm can only vary the quantity of labor hired in the short run. An increase in the cost of capital willA) increase the firm's marginal cost.B) decrease the firm's marginal cost.C) have no effect on the firm's marginal cost.D) More information is needed to answer the question.Answer: CTopic: Short-run Costs7) Suppose the total cost of producing T-shirts can be represented as TC = 50 + 2q. The marginal cost of the 5th T-shirt isA) 2.B) 10.C) 12.D) 60.Answer: ATopic: Short-run Costs8) Suppose the total cost of producing T-shirts can be represented as TC = 50 + 2q. The average cost of the 5th T-shirt isA) 2.B) 12.C) 52.D) 60.Answer: BTopic: Short-run Costs9) Suppose the total cost of producing T-shirts can be represented as TC = 50 + 2q. Which of the following statements is TRUE at all levels of production?A) MC = AVCB) MC = ACC) MC > AFCD) All of the above.Answer: ATopic: Short-run Costs10) Suppose the short-run production function is q = 10 * L. If the wage rate is $10 per unit of labor, then AVC equalsA) q.B) q/10.C) 10/q.D) 1.Answer: DTopic: Short-run Costs11) Suppose the short-run production function is q = 10 * L. If the wage rate is $10 per unit of labor, then MC equalsA) q.B) q/10.C) 10/q.D) 1.Answer: DTopic: Short-run Costs12) If average cost is decreasingA) Marginal cost equals average cost.B) Marginal cost exceeds average cost.C) Marginal cost is less average cost.D) Not enough informationAnswer: CTopic: Short-run Costs13) If average cost is positiveA) Marginal cost equals average cost.B) Marginal cost exceeds average cost.C) Marginal cost is less average cost.D) Not enough informationAnswer: DTopic: Short-run Costs14) Suppose the short-run production function is q = L0.5. If the marginal cost of producing the tenth unit is $5, what is the wage per unit of labor?A) $1B) $0.5C) $0.25D) It cannot be determined without more information.Answer: CTopic: Short-run Costs15) Suppose the short-run production function is q = 10 * L. If the wage rate is $10 per unit of labor, then AFC equalsA) 0.B) 1.C) 10/q.D) It cannot be determined from the information provided.Answer: DTopic: Short-run Costs16) When a firm produces one unit, the variable cost is $3. When the firm produces two units, the variable cost is $6. What is the marginal cost associated with two units of production?A) $2B) $0.5C) $6D) $3Answer: DTopic: Short-run Costs17) In the short run, the point at which diminishing marginal returns to labor begin is the point at which the marginal cost curveA) peaks.B) bottoms out.C) is upward sloping.D) is downward sloping.Answer: BTopic: Short-run Costs18) If the marginal cost of producing a good is increasing as a firm produces more of the good, then which of the following must be TRUE?A) AFC is rising.B) AVC is rising.C) MC > AVC.D) MPL is falling.Answer: DTopic: Short-run Costs19) If the average cost of producing a good is increasing as a firm produces more of the good, then which of the following must be TRUE?A) AFC is falling.B) AVC is rising.C) MC > AVC.D) All of the above.Answer: DTopic: Short-run Costs20) If a particular production process is subject to diminishing marginal returns to labor at every level of output, then at every level of outputA) AC is upward sloping.B) MC exceeds AVC.C) AFC is constant.D) All of the above.Answer: BTopic: Short-run Costs21) Marginal Cost is equal toA) the increase in total cost from increasing the amount of labor by one unit.B) the increase in average cost from increasing the amount of labor by one unit.C) Both A and B.D) Neither A nor B.Answer: CTopic: Short-run Costs22) Suppose each worker must use only one shovel to dig a trench, and shovels are useless by themselves. In the short run, an increase in the price of shovels will result inA) fewer shovels being purchased.B) more workers being hired.C) a decrease in the firm's output.D) no change in the firm's output.Answer: DTopic: Short-run Costs23) Which of the following will cause the marginal cost curve of making cigarettes to shift?A) A $5 million penalty charged to each cigarette maker.B) A $1 per pack tax on cigarettes.C) A $1 million advertising campaign by the American Cancer Society.D) All of the above.Answer: BTopic: Short-run Costs24) Which of the following will cause the average cost curve of making cigarettes to shift?A) A $5 million penalty charged to each cigarette maker.B) A $1 per pack tax on cigarettes.C) A $1 an hour wage increase paid to all cigarette production workers.D) All of the above.Answer: DTopic: Short-run Costs25) Which of the following will cause the average fixed cost curve of making cigarettes to shift?A) A $5 million penalty charged to each cigarette maker.B) A $1 per pack tax on cigarettes.C) A $3 per hour wage increase.D) An increase in the demand for cigarettes.Answer: ATopic: Short-run Costs26) A specific tax of $1 per unit of output will affect a firm'sA) average total cost, average variable cost, average fixed cost, and marginal cost.B) average total cost, average variable cost, and average fixed cost.C) average total cost, average variable cost, and marginal cost.D) marginal cost only.Answer: CTopic: Short-run CostsFor the following, please answer "True" or "False" and explain why.27) The "Law of Diminishing Marginal Returns" could also be termed the "Law of Increasing Marginal Costs."Answer: True. Since MC = w/MP L in the short run, the fact that MPL eventually declines means that MC must eventually increase.Topic: Short-run Costs28) The marginal cost curve intersects the average fixed cost curve at its minimum.Answer: False. Marginal cost intersects average variable cost (and average cost) at its minimum.Topic: Short-run Costs29) A consumer purchases a book by driving across town to a bookstore, standing in line for five minutes to pay the cashier, and then pays $5. The same book is purchased by another consumer who spends 2 minutes placing the order over the internet for $10. The book necessarily cost the first consumer less.Answer: False. The opportunity cost of driving across town and standing in line may have raised the total cost of the book to the first consumer to more than $10.Topic: Short-run Costs30) A firm's production function for pretzels is shown in the above figure. If the firm's fixed cost equals $100 per time period and the wage rate equals $1 per unit of labor per time period, calculate the firm's MC, AVC, and AC schedules. Do these cost functions follow the general rules concerning the relationships between MC, AVC and AC?Answer:❑✌☞ ✌✞✌ MC > AVC, AVC is rising.MC < AC, AC is falling.Topic: Short-run Costs31) Explain why the marginal cost curve intersects a U-shaped average cost curve at its minimum point. Answer: At low quantities, the average cost curve declines as the quantity increases. The marginal cost is below the average cost. The marginal cost represents the cost of an additional unit of production. Thus, as the marginal cost curve declines, this pulls the average cost down from its previous level. Then, the marginal cost curve will begin to rise. However, the marginal cost is still below the average cost, which will continue to lower the average cost. When the two costs are equal the marginal cost will leave the average cost unchanged. Then, the marginal cost will be above the average cost so it will start to pull up the average cost. Thus, the marginal cost curve will intersect the average cost curve at its minimum point.Topic: Short-run Costs7.3 Long-Run Costs1) In the long run, fixed costs areA) sunk.B) avoidable.C) larger than in the short run.D) not included in production decisions.Answer: BTopic: Long-run Costs2) The slope of the isocost line tells the firm how muchA) capital must be reduced to keep total cost constant when hiring one more unit of labor.B) capital must be increased to keep total cost constant when hiring one more unit of labor.C) more expensive a unit of capital costs relative a unit of labor.D) the isocost curve will shift outward if the firm wishes to produce more.Answer: ATopic: Long-run Costs3) Which of the following does NOT represent a possible shape of the long-run average cost curve?A) downward-slopingB) upward-slopingC) U-shapedD) verticalAnswer: DTopic: Long-run Costs4) The slope of the isoquant tells the firm how muchA) output increases when labor increases by one unit.B) output increases when capital and labor are doubled.C) capital must decrease to keep output constant when labor increases by one unit.D) a unit of capital costs relative to the cost of labor.Answer: CTopic: Long-run Costs5) If an isocost line crosses the isoquant twice, a cost minimizing firm willA) use a different isocost line to select the bundle of inputs.B) use the input bundle associated with the intersection on the higher point of the isoquant.C) use the input bundle associated with the intersection on the lower point of the isoquant.D) Both B and C.Answer: ATopic: Long-run Costs6) When the isocost line is tangent to the isoquant, thenA) MRTS = w/r.B) the firm is producing that level of output at minimum cost.C) the last dollar spent on capital yields as much extra output as the last dollar spent on labor.D) All of the above.Answer: DTopic: Long-run Costs7) A firm can minimize cost byA) picking the bundle of inputs where the lowest isocost line touches the isoquant.B) picking the bundle of inputs where the isoquant is tangent to the isocost line.C) picking the bundle of inputs where the last dollar spent on one input gives as much extra output as the last dollar spent on any other input.D) All of the above.Answer: DTopic: Long-run Costs8) When the isocost line is tangent to the isoquant, thenA) MPL = MPK.B) the firm is producing that level of output at minimum cost.C) the firm has achieved the right economies of scale.D) All of the above.Answer: BTopic: Long-run Costs9) If the wage in increases the isocost line willA) stay the same.B) shift outward in parallel fashion.C) rotate inward around the point where only capital is employed in production.D) shift inward in parallel fashion.Answer: CTopic: Long-run Costs10) If the isoquants are straight lines or L-shaped, then a cost-minimizing firm willA) not be able to minimize costs.B) find the lowest isocost line touching the relevant isoquant.C) find the highest isocost line touching the relevant isoquant.D) choose not to produce any output.Answer: BTopic: Long-run Costs11) If the marginal rate of technical substitution for a cost minimizing firm is 10, and the wage rate for labor is $5, what is the rental rate for capital in dollars?A) .5B) 1C) 2D) 10Answer: ATopic: Long-run Costs12) Suppose MPL = 0.5 * (q/L) and MPK = 0.5 * (q/K). In the long run, the firm will hire equal amounts of capital and laborA) all of the time.B) only when w = r.C) only when w = 0.5 * r.D) at no point in time.Answer: BTopic: Long-run Costs13) Suppose that each worker must use only one shovel to dig a trench, and shovels are useless by themselves. In the long run, an increase in the price of shovels will result inA) fewer shovels being purchased to produce the same number of trenches.B) more workers being hired to produce the same number of trenches.C) the firm wishing to produce more trenches.D) no change in the firm's input mix.Answer: DTopic: Long-run Costs14) Suppose that each worker must use only one shovel to dig a trench, and shovels are useless by themselves. In the long run, the firm will experienceA) increasing returns to scale.B) constant returns to scale.C) decreasing returns to scale.D) The returns to scale cannot be determined from the information provided.Answer: BTopic: Long-run Costs15) Suppose that each worker must use only one shovel to dig a trench, and shovels are useless by themselves. In the long run, the firm's cost function isA) TC = (w/r) * q.B) TC = (w + r)/q.C) TC = (w + r).D) TC = (w + r) * q.Answer: DTopic: Long-run Costs16) At the XYZ Co., a unit of capital costs 3 times as much as a unit of labor. If the isoquants are convex, and the firm does not change its input mix in the long run, we can conclude thatA) MPK = 3 * MP L.B) the firm will not hire any capital.C) the firm will hire 3 times as much labor as capital.D) the firm will hire 3 times as much capital as labor.Answer: ATopic: Long-run Costs17) The production of cigarettes is highly automated; however, a worker is required to monitor each machine. Machines and workers do not interact with one another. Given this information, there are most likelyA) economies of scale.B) economies of scope.C) constant returns to scale.D) increasing returns to scale.Answer: CTopic: Long-run Costs18) Suppose that capital and labor must be kept in a fixed proportion to produce a particular good. For example, digging a trench requires one worker who has one shovel. What does this imply about returns to scale?A) There are constant returns to scale.B) There are increasing returns to scale.C) There are decreasing returns to scale.D) Nothing.Answer: ATopic: Long-run Costs19) A change in relative factor prices will always result inA) a change in the slope of the isoquants.B) a tangency between the new isocost line and a new isoquant.C) a rotation of the isocost lines.D) All of the above.Answer: CTopic: Long-run Costs20) Assuming that w and r are both positive, if the long-run expansion path is horizontal, thenA) MP K = 0.B) MRTS is a function of capital only.C) w = r.D) All of the above.Answer: BTopic: Long-run Costs21) The above figure shows the long-run expansion path. The long-run average cost curve will beA) horizontal.B) downward sloping.C) upward sloping.D) vertical.Answer: BTopic: Long-run Costs22) The long run average cost curve may initially slope downward due toA) decreasing average fixed costs.B) increasing marginal returns.C) economies of scale.D) All of the above.Answer: CTopic: Long-run Costs23) If a production function is represented as q = LαKβ, the long-run average cost curve will be horizontal as long asA) a + b = 0.B) a + b = 1.C) q > 0.D) L = K.Answer: BTopic: Long-run Costs24) If there are diseconomies of scale within a given range of output, which of following is(are) TRUE?A) The short-run average cost curve must be upward sloping within that range of output.B) The long-run average cost curve must be upward sloping within that range of output.C) Long-run average cost must equal short-run average cost.D) All of the above.Answer: BTopic: Long-run Costs25) The total cost of producing one unit is $50. The total cost of producing two units is $75. At a production level of two units, the cost function exhibitsA) economies of scale.B) rising average costs.C) increasing marginal costs.D) constant returns to scale.Answer: ATopic: Long-run CostsFor the following, please answer "True" or "False" and explain why.26) If increasing returns to scale are present, the long-run average cost increases as more output is produced. Answer: False. Increasing returns to scale imply that with a doubling of inputs, output more than doubles. Since average cost is the ratio of total cost divided by output, this increase in inputs will cause the numerator to be just double the old value while the new denominator is more than double the old value. As a result, long-run average cost falls as more output is produced.Topic: Long-run Costs27) Economies of scale and Increasing Returns to Scale are the same thing looked at from either the production or cost perspective.Answer: False. Increasing returns to scale imply economies of scale but the reverse is not true. A firm can experience economies of scale for other reasons (without increasing returns to scale)Topic: Long-run Costs28) Explain the difference between fixed costs in the short run and fixed costs in the long run.Answer: In the short run fixed costs are sunk; in the long run, fixed costs are avoidable.Topic: Long-run Costs29) What are the functions for MC and AC if TC = 100q + 100q2? Are the returns to scale increasing, decreasing, or constant?Answer: MC = 100 + 200qAC = 100 + 100qSince AC increases with an increase in output, there are decreasing returns to scale.Topic: Long-run Costs30) Explain how a firm can have constant returns to scale in production and economies of scale in cost. Answer: A firm can have constant returns to scale in production at every output level. If the firm doubled all inputs the output would double. However, the firm may have a decreasing average cost. As more inputs areused and output increases, the average cost declines, which is known as economies of scale.Topic: Long-run Costs31) Explain why the long-run total cost curve, not the short-run total cost curve, shows the lowest cost of producing any level of output. Is there an exception?Answer: In the long run, all costs are variable so the firm can select the least-cost mix of all inputs to produce any given quantity. The exception would be at minimum long-run cost where min. LR and min. SR costs are equal.Topic: Long-run Costs32) A local non-profit group prints a weekly newsletter. Professional typists earn $10 per hour and can type 2 pages per hour. Unpaid volunteers can type only 1 page per hour. Measuring hours of professional typist services on the vertical axis and hours of unpaid volunteer typist services on the horizontal axis, draw the relevant isoquant and isocost curves if the newsletter is 10 pages long. What input mix is chosen by the non-profit group if they wish to minimize the cost of the newsletter? If the group will reimburse volunteers for expenses (lunch, driving), how much must the reimbursement be for your answer to change? Answer:See the above figure. The isoquant is a straight line with a slope of 1/2. The group can use either 5 pros, 10 volunteers, or some combination of the two. The isocost curves are horizontal since volunteers are free. As a result, the lowest isocost curve is achieved by hiring all volunteers. If the group reimbursed volunteers for expenses (lunch, driving, etc.) then the group will still hire all volunteers as long as they do not cost more than $5 per hour.Topic: Long-run Costs33) A firm pays $5 for each unit of capital. Labor costs $5 per hour for the first 10 hours and $10 per hour for every hour thereafter. Draw the isocost curves for total costs of $50 and $100.Answer:See the above figure.Topic: Long-run Costs34) To dig a trench, each worker needs a shovel. Workers can use only one shovel at a time. Workers without shovels do nothing, and shovels cannot operate on their own. Graphically determine the number of shovels and workers used by a firm to dig 2 trenches when:(a) w = 10 and r = 10(b) w = 10 and r = 5Answer:See the above figure. Because the production process requires fixed proportions of K and L, the firm cannot change input mix when the relative factor costs change.Topic: Long-run Costs35) Suppose the production function is q = 12 L0.25K0.75. Determine the long-run capital-to-labor ratio (K/L) if the cost a unit of capital (r) is three times the cost of a unit of labor (w).Answer: The firm minimizes costs by setting MRTS = w/r. MRTS = MP L/MP K = K/3L = 1/3 = w/r. This firm will set K/L equal to one.Topic: Long-run Costs36) "If the wage rate paid to one form of labor is twice the cost of another form of labor, the first type of labor must be twice as productive." Comment.Answer: This is true. Firms minimize cost by setting the ratio of marginal productivity per unit cost equally across all inputs. If one form of labor is twice as expensive as another, the firm will want the MP of the first type of labor to be twice that of the second.Topic: Long-run Costs。

第一章1.Macroeconomics does not try to answer the question of:答案:what is the rateof return on education.2.All of the following are types of macroeconomics data except the:答案:priceof an IBM computer.3.The total income of everyone in the economy adjusted for the level of baseyear prices is called:答案:real GDP.4.Real GDP ______ over time and the growth rate of real GDP ______.答案:grows;fluctuates5. A period of falling prices is called:答案:deflation.第二章1.The assumption of continuous market clearing means that:答案:at any giveninstant, buyers can buy all that they want and sellers can sell all that theywant at the going price.2.All of the following statements about sticky prices are true except:答案:thesticky-price model describes the equilibrium toward which the economyslowly gravitates.3.The assumption of flexible prices is a more plausible assumption whenapplied to price changes that occur:答案:in the long run.4.GNP equals GDP ______ income earned domestically by foreigners ______income that nationals earn abroad.答案:minus; plus5.The largest component of national income is:答案:compensation ofemployees.6.If nominal GDP grew by 5 percent and real GDP grew by 3 percent, then theGDP deflator grew by approximately ______ percent.答案:2第三章1.In the long run, the level of national income in an economy is determined byits:答案:factors of production and production function.2.At any particular point in time, the output of the economy:答案:is fixedbecause the supplies of capital and labor and the technology are fixed.3.In a Cobb-douglas production function the marginal product of labor willincrease if:答案:the quantity of capital increases.4.According to the neoclassical theory of distribution, in an economy describedby a Cobb-douglas production function, workers should experience highrates of real wage growth when:答案:average labor productivity is growingrapidly.5.In the classical model with fixed income, an increase in the real interest ratecould be the result of a(n):答案:increase in government spending.1.Money’s liquidity refers to the ease with which:答案:money can be convertedinto goods and services.2.In a fractional-reserve banking system, banks create money when they:答案:make loans.3.If the currency-eposit ratio equals 0.5 and the reserve-eposit ratio equals 0.1,then the money multiplier equals答案:2.5.4.When the Fed makes an open-market sale, it:答案:decreases the monetarybase (B).5.When the Federal Reserve conducts an open-market purchase, it buys bondsfrom the:答案:public.第五章1.If the demand for real money balances is proportional to real income,velocity will:答案:remain constant.2.The quantity equation for money, by itself:答案:may be thought of as adefinition for velocity of money.3.In the long run, according to the quantity theory of money and the classicalmacroeconomic theory, if velocity is constant, then ______ determines realGDP and ______ determines nominal GDP.答案:the productive capability of the economy; the money supply4.According to the classical dichotomy, when the money supply decreases, _____will decrease.答案:the price level5.The concept of monetary neutrality in the classical model means that anincrease in the money supply will increase:答案:nominal interest rates.第六章 capital outflow is equal to:答案:national saving minus domesticinvestment.2.If domestic saving exceeds domestic investment, then net exports are ______and net capital outflows are ______.答案:positive; positive3.In a small open economy, if exports equal $5 billion and imports equal $7billion, then there is a trade ______ and ______ net capital outflow.答案:deficit;negative4.Starting from a trade balance, if the world interest rate falls, then, holdingother factors constant, in a small open economy the amount of domesticinvestment will _____ and net exports will _____.答案:increase; decrease5.If purchasing-power parity holds, then changes in domestic saving will _____the real exchange rate.答案:not change1. A policy that decreases the job separation rate _____ the natural rate ofunemployment.答案:will decrease2.Any policy aimed at lowering the natural rate of unemployment must either______ the rate of job separation or ______ the rate of job finding.答案:reduce;increase3.The unemployment resulting from wage rigidity and job rationing is called______ unemployment.答案:structural4.The minimum wage:答案:has its greatest impact on teenage unemployment.5.Which of the following is the best example of structural unemployment?答案:Kirby is seeking a job as an airline pilot, but the high union wages in theindustry have limited the number of jobs available.第八章1.Two economies are identical except that the level of capital per worker ishigher in Highland than in Lowland. The production functions in botheconomies exhibit diminishing marginal product of capital. An extra unit ofcapital per worker increases output per worker:答案:more in Lowland.2.In the Solow growth model the saving rate determines the allocation ofoutput between:答案:investment and consumption.3.In the Solow growth model, the steady-state occurs when:答案:capital perworker is constant.4.In the Solow growth model, the steady state level of output per worker wouldbe higher if the _____ increased or the _____ decreased.答案:saving rate;depreciation rate5.In the Solow growth model, with a given production function, depreciationrate, saving rate, and no technological change, higher rates of populationgrowth produce:答案:higher steady-state growth rates of total output.第九章1.The Golden Rule level of the steady-state capital stock:答案:implies a choiceof a particular saving rate.2.If an economy is in a steady state with no population growth or technologicalchange and the marginal product of capital is less than the depreciation rate:答案:steady-state consumption per worker would be higher in a steady state with a lower saving rate.3.If an economy is in a steady state with a saving rate below the Golden Rulelevel, efforts to increase the saving rate result in:答案:both higher per-capita output and higher per-capita depreciation, but the increase in per-capitaoutput would be greater.4.When an economy begins above the Golden Rule, reaching the Golden Rule:答案:produces higher consumption at all times in the future.5.In the Solow growth model of an economy with population growth but notechnological change, the break-even level of investment must do all of thefollowing except:答案:equal the marginal productivity of capital (MPK).第十章1.If an aggregate demand curve is drawn with real GDP (Y) along thehorizontal axis and the price level (P) along the vertical axis, using thequantity theory of money as a theory of aggregate demand, this curve slopes ______ to the right and gets ______ as it moves farther to the right.答案:downward; flatter2. A short-run aggregate supply curve shows fixed ______, and a long-runaggregate supply curve shows fixed ______.答案:prices; output3.If the long-run aggregate supply curve is vertical, then changes in aggregatedemand affect:答案:prices but not level of output.4.Assume that the economy starts from long-run equilibrium. If the FederalReserve increases the money supply, then ______ increase(s) in the short run and ______ increase(s) in the long run.答案:output; prices5.Monetary neutrality is a characteristic of the aggregate demand朼ggregatesupply model in:答案:in the long run, but not in the short run.第十一章1.Two interpretations of the IS-LM model are that the model explains:答案:thedetermination of income in the short run when prices are fixed, or whatshifts the aggregate demand curve.2.In the Keynesian-cross model, actual expenditures differ from plannedexpenditures by the amount of:答案:unplanned inventory investment.3.Along any given IS curve:答案:both government spending and tax rates arefixed.4.In the Keynesian-cross model, a decrease in the interest rate ______ plannedinvestment spending and ______ the equilibrium level of income答案:increases; increases5.An IS curve shows combinations of:答案:interest rates and income that bringequilibrium in the market for goods and services.6.If the interest rate is above the equilibrium value, the:答案:supply of realbalances exceeds the demand.第十二章1.In the IS?LM model when taxation increases, in short-run equilibrium, theinterest rate ______ and output ______.答案:falls; fallsing the IS-LM analysis, if the LM curve is not horizontal, the multiplier foran increase in government spending is ______ for an increase in governmentpurchases using the Keynesian-cross analysis.答案:smaller than themultiplier3.An economic change that does not shift the aggregate demand curve is achange in:答案:the price level.4. A tax cut shifts the ______ to the right, and the aggregate demand curve __答案:IS; shifts to the right5.If real money balances enter the IS?LM model both through the theory ofliquidity preference and the Pigou effect, then a fall in the price level will shift:答案:both the LM and the IS curves.第十三章1.In the Mundell-Fleming model, the domestic interest rate is determined bythe:答案:world interest rate.2.If short-run equilibrium in the Mundell-Fleming model is represented by agraph with Y along the horizontal axis and the exchange rate along thevertical axis, then the LM* curve:答案:is vertical because the exchange ratedoes not enter into the LM* equation.3.In a small open economy with a floating exchange rate, if the governmentincreases the money supply, then in the new short-run equilibrium the:答案:exchange rate falls and net exports increase.4.To maintain a fixed-exchange-rate system, if the exchange rate moves belowthe fixed-exchange-rate level, then the central bank must:答案:sell foreigncurrency from reserves.5.According to the Mundell-Fleming model, import restrictions in an economywith flexible exchange rates cause net exports to ______ and in an economywith fixed exchange rates import restrictions cause net exports to ____.答案:remain unchanged; increase第十四章1.Aggregate supply is the relationship between the quantity of goods andservices supplied and the:答案:price level.2.In the long run, the level of output is determined by the:答案:amounts ofcapital and labor and the available technology.3.The assumption of constant velocity in the quantity equation is theequivalent of the assumption of a constant:答案:demand for real balancesper unit of output.4.The long-run aggregate supply curve is vertical at the level of output:答案:atwhich unemployment is at its natural rate.5.Starting from long-run equilibrium, if the velocity of money increases (due to,for example, the invention of automatic teller machines) and no action istaken by the government:答案:output will rise in the short run and priceswill rise in the long run.。

中级宏观经济学计算题解答(总10页)--本页仅作为文档封面,使用时请直接删除即可----内页可以根据需求调整合适字体及大小--1、在以下列函数描述的经济体中,考察税收对均衡收入决定的作用。
C=50+, I =70, G =200, TR =100, t=(1)计算模型中的均衡收入和乘数;(2)计算预算赢余;(3)设想t 增加到,新的均衡收入是什么新的乘数是什么(4)计算预算赢余的变动。
如果c 是而不是,预算赢余是增加还是减少2、在三部门经济中,已知消费函数为C=100+,YD 为可支配收入,投资I=300亿元,政府购买G=160亿元,税收TA=。
试求:(1)均衡的国民收入水平;(2)政府购买乘数;(3)若政府购买增加到300亿元时,新的均衡国民收入。
3、考虑如下经济:(1)消费函数是)(75.0200T Y C -+=,投资函数是r I 25200-=,政府购买和税收都是100,针对这个经济体,画出r 在0~8之间的IS 曲线。
(2)在该经济下,货币需求函数是r Y d P M 100)/(-=,货币供给M 是1000,物价水平P 是2,针对这个经济,画出r 在0~8之间的LM 曲线。
(3)找出均衡利率r 和均衡收入水平y 。
(4)推导并画出总需求曲线。
4.某一两部门的经济由下述关系式描述:消费函数C=100+,投资函数为I=150-6i ,货币需求函数为L=,设P 为价格水平,货币供给为M=150。
试求:(1)总需求函数(2)若P=1,均衡的收入和利率各为多少(3)若该经济的总供给函数为AS=800+150P ,求均衡的收入和价格水平。
5.以下等式描绘一个经济(C 、I 、G 等以10亿美元为计量单位,i 以百分率计量,5%的利率意味着i=5)。
C=(1-t)Y ,t=,I=900-50i ,G =800,L= 500=P M(1)描述IS 曲线的是什么方程(2)描述LM 曲线的是什么方程(3)什么是均衡的收入与均衡的利率水平6.在三部门经济中,消费函数为YD C 8.080+=,投资函数为i I 520-=,货币需求函数为i Y L 104.0-=,政府采购支出20=G ,税收Y T 25.0=,名义货币供给量90=M ,充分就业的产出水平285=Y 。

中宏试题及答案1. 用AS-AD模型说明货币扩张对产量、名义利率、价格水平、消费和投资的短期和中长期影响。
(1)短期影响:货币扩张,AD曲线向右移动。
产量增加;价格水平上升;LM曲线向下移动,名义利率下降;消费增加;投资增加。
(10分)(2)中长期影响:AS曲线向上移动。
产量回到自然产量水平;价格进一步上升;LM曲线向上移动,名义利率回到初始水平;消费和投资回到初始水平。
(10分)2. 用AS-AD模型说明预算赤字削减对产量、名义利率、价格水平、消费和投资的短期和中长期影响。
(1)短期影响:预算赤字削减,AD曲线向左移动。
产量减少;价格水平下降;IS 曲线向左移动,名义利率下降;消费减少;投资不确定。
(10分)(2)中长期影响:AS曲线向下移动。
产量回到自然产量水平;价格进一步下降;LM曲线向下移动,名义利率下降;消费回到初始水平;投资增加。
(10分)3. 用AS-AD模型说明石油价格上涨对产量、名义利率、价格水平、消费和投资的短期和中长期影响。
(1)短期影响:石油价格上涨,自然失业率上升,AS曲线向上移动。
产量减少;价格水平上升;LM曲线向上移动,名义利率上升;消费减少;投资减少(10分)(2)中长期影响:AS曲线向上移动。
产量达到新的自然产量水平;价格上升;LM 曲线向上移动,名义利率上升;消费减少;投资减少。
(10分)4. 为降低通货膨胀,中央银行应如何设计名义货币增长路径?(1)中央银行确定每年应达到的目标通货膨胀率,然后利用奥肯定律、菲利普斯曲线和总需求关系计算所需要的货币增长率。
(2分)(2)对奥肯定律、菲利普斯曲线和总需求关系的说明。
(8分)(3)中央银行确定每年应达到的目标通货膨胀率,根据菲利普斯曲线计算相应的失业率;根据奥肯定律计算相应的经济增长率;再根据总需求关系计算各年需要达到的名义货币增长率,确定名义货币增长率路径。
(可举例说明)(10分)5. 一经济体有柯布—道格拉斯生产函数。
一、概念辨析1.国内生产总值(GDP)与国民生产总值(GNP)2.政府支出与政府购买3.国民生产总值与国民收入4.消费者价格指数与GDP消胀指数5.固定汇率制与可变汇率制6.预算盈余与充分就业预算盈余7.真实汇率与购买力平价8.经常账户与资本账户9.商品市场均衡曲线(IS)与货币市场均衡曲线(LM)10.边际消费倾向与边际储蓄倾向11.法定贬值与真实贬值12.凯恩斯消费理论与LC-PIH消费理论二、简述题(图解题)1、恒等式“储蓄等于投资”(如果是四部门经济则为“国民储蓄等于国民投资”)在传统意义上很好理解,比如你把钱存银行,银行贷款给企业投资。
那么假设人把钱放枕头底下,该恒等式还成立吗?2.如果甲乙两个国家合并成一个国家,对GDP总和会有什么影响(假定两国产出不变)?3.在实行累进税制的国家,比例所得税为何能对经济起到自动稳定器的作用?4.写出现代菲利普斯曲线方程,配以图形简述其如何解释经济中的滞胀现象?5.货币需求对利率的弹性越大,货币政策就越无效的判断是否正确?6.政府采购支出增加一定会挤出私人投资和导致通货膨胀吗?7.古典学派和凯恩斯主义的总供给观点各自基于怎样的假定前提以及适合在什么情况下分析宏观经济问题?8.在国民收入核算中,Y≡C+I+G+NX;在均衡收入的决定中,只有当Y=AD 时,Y=C+I+G+NX才会成立。
这是否存在矛盾,并请说明理由。
9.名义货币存量的增加使AD曲线上移的程度恰恰与名义货币增加的程度一致,为什么?10.封闭经济中的IS曲线和开放经济中的IS曲线哪一个更陡峭?11.贸易伙伴收入提高、本国货币真实贬值将对本国IS曲线产生何种影响?12.凯恩斯学派认为货币政策的传递机制包含哪些环节?最主要的环节是什么?13.经济处于充分就业状态。
若政府要改变需求构成,从消费转向投资,但不允许超过充分就业水平。
需要采取何种形式的政策组合?运用IS—LM模型进行分析。
14.考虑两种紧缩方案,一种是取消投资补贴;另一种是提高所得税率。
二、简述题(图解题)1、该恒等式仍然成立。
理巾(丨)国民收入核算中的恒等式中的储蓄和投资是真实产出中川于储蓄和投资的商品的价值总额。
(2)某人将部分现金存放在家里,所产生的效应相当于中央银行从货币市场中回笼了这笔现金。
即一定程度(轻微)的货币紧缩政策。
这一行为会影响经济体的产出,但不会破坏储蓄和投资之间的恒等关系。
3、自动稳定器是经济屮的一种机制,它自动减少为适应自主需求变动所需的产出变动:W:,政府不需要逐项加以干预;导致经济周期性起伏的主要原因是自主需求的变动,特别是投资耑求的变动,投资者乐观时投资耑求高涨,导致产出水平高涨;投资者悲观时投资耑求下降,导致产出水平下降。
比例所得税能起到自动稳定器的作用是因为经济体的税率水平会随经济的周期性变动而发生变化,并导致乘数# = _!_的变化。
经济繁荣时,整l-c(l-r)体税率水平t提高,导致乘数变小,自主投资耑求对均衡收入产生的乘数效应变小。
经济萧条吋,整体税率水平t下降,导致乘数变大,自主投资需求对均衡收入产生的乘数效应变大。
这意味着由于比例所得税的自动稳定器作用,经济周期性波动的幅度降低了(波峰岛度和波谷深度都降低了)。
4、现代菲利普斯曲线方程:7T = 7T e-e(U-U)o其中,7T为实际通货膨胀率,浐为预期通货膨胀率,W为实际失业率,:为自然失业率。
6•为大于零的常数。
现代菲利普斯曲线反映了通货膨胀率和失业率之间的反向关系,但经过了通过膨胀预期的调整。
滞胀指的是经济停滞和通货膨胀并存的现象,以用现代菲利普斯曲线来解释:图中的A 点和B点对比而言,A点表示失业率和通货膨胀率都很髙,它是一个滞胀点。
之所以会形成A点的滞胀状态,原因是A点所处的短期菲利普斯曲线的通货膨胀预期要大幅商于B点所处的短期菲利普斯曲线的通货膨胀预期。
一旦经济处于高通货膨胀预期的短期菲利普斯曲线上, 衰退将实际通货膨胀推导低于预期通货膨胀的水平,但通货膨胀的绝对水平仍然保持高水平。
2003-2004学年第二学期中级宏观经济学(Macroeconomics)考试试题答案(经济试验班021、022)Ⅰ.Choose the best answers (2'×10)1.B2.A3.C4.B5.C6.A7.B8.C9.C 10.DⅡ. Explain the following terms. (20 points)1.Endogenous variables: 经济模型中要解释的变量。
Exogenous variables:模型给出作为既定的变量。
2. Menu costs:企业因通货膨胀改变价格的成本。
shoe-leather costs:为减少持有货币的损失而发生的成本。
3. GDP deflator :名义GDP/实际GDP,是相对于基年商品和劳务价格的那一年的商品和劳务价格。
CPI:即消费价格指数,是相对于某个基年一篮子物品与劳务价格的同样一篮子物品与劳务的现期价格。
4. Adaptive expectation :人们根据过去的经验或数据来预测未来。
rational expectation:人们尽可能地利用所有可以获得地信息,包括关于现在政府政策地信息预测未来。
5. Real exchange rate :两国物品的相对价格。
nominal exchange rate:两国通货的相对价格。
Ⅲ.Answer the following questions by drawing or calculating. (10’ ×4) 1.We want to consider the effects of a tax cut when the LM* curve depends on disposable income instead of income: M/P = L[r, Y –T].A tax cut now shifts both the IS* and the LM* curves. Figure 12–22 shows the case of floating exchange rates. The IS* curve shifts to the right, from IS to IS . The LM* curve shifts to the left, however, from LM to LM .We know that real balances M/P are fixed in the short run, while the interest rate is fixed at the level of the world interest rate r*. Disposable income is the only variable that can adjust to bring the money market into equilibrium: hence, the LM* equation determines the level of disposable income. If taxes T fall, then income Y must also fall to keep disposable income fixed. In Figure 12–22, we move from an original equilibrium at point A to a new equilibrium at point B. Income falls by the amount of the tax cut, and the exchange rate appreciates. If there are fixed exchange rates, theIS* curve still shifts to the right; but the initial shift in the LM* curve no longer matters. That is, the upward pressure on the exchange rate causes the central bank to sell dollars and buy foreign exchange; this increases the money supply and shifts the LM* curve to the right, as shown in Figure 12–23. The new equilibrium, at point B, is at the intersection of the new IS* curve, IS , and the horizontal line at the level of the fixed exchange rate. There is no difference between this case and the standard case where money demand depends on income.2. a.将生产函数两边同时除以效率工人,则有:()4.04.06.04.0k L E K L E L E K L E Y y =⎪⎭⎫ ⎝⎛⨯=⨯⨯=⨯=b .s=0.25 δ=5% n=2% g=3%; 带入经济稳定的条件:38.15.275.0)1(*84.15.2*6.45.2*1.025.0)()(3/23/24.03/54.0≈⨯=-=≈==≈==⋅++=⋅y s c k y k kk kg n k f s δc.当g 变为5%时,有: 63.11225*4.31225*12.025.0)()(3/24.03/54.0≈⎪⎭⎫ ⎝⎛==≈⎪⎭⎫ ⎝⎛==⋅++=⋅k y k kk kg n k f s δ 这种变化导致了效率工人的人均资本量减少,效率工人的人均产量下降;但总产出会增加。
Microeconomics, 4e (Perloff)Chapter 2 Supply and Demand2.1 Demand1) According to the Law of Demand, the demand curve for a good willA) shift leftward when the price of the good increases.B) shift rightward when the price of the good increases.C) slope downward.D) slope upward.Answer: CTopic: Demand2) An increase in the price of pork will lead toA) a movement up along the demand curve.B) a movement down along the demand curve.C) a rightward shift of the demand curve.D) a leftward shift of the demand curve.Answer: ATopic: Demand3) An increase in consumer incomes will lead toA) a rightward shift of the demand curve for plasma TVs.B) a movement upward along the demand curve for plasma TVs.C) a rightward shift of the supply curve for plasma TVs.D) no change of the demand curve for plasma TVs.Answer: ATopic: Demand4) Consider the demand function Qd = 150 - 2P. The effects of other determinants of Qd is reflected inA) the intercept of the function.B) the slope of the function.C) neither the slope nor the intercept of the function.D) in both the slope and the intercept of the function.Answer: ATopic: Demand5) Consider the demand functions: A) Qd = 250 - 2P B) Qd = 300 - 3P.Which of the demand functions reflects a higher level of consumer incomes?A) AB) BC) A and B reflect the same consumer incomes.D) More information is needed.Answer: DTopic: Demand6) Holding all other factors constant, consumers demand more of a good theA) higher its price.B) lower its price.C) steeper the downward slope of the demand curve.D) steeper the upward slope of the demand curve.Answer: BTopic: Demand7) As the price of a good increases, the change in the quantity demanded can be shown byA) shifting the demand curve leftward.B) shifting the demand curve rightward.C) moving down along the same demand curve.D) moving up along the same demand curve.Answer: DTopic: Demand8) If the price of automobiles were to increase substantially, the demand curve for gasoline would most likelyA) shift leftward.B) shift rightward.C) become flatter.D) become steeper.Answer: ATopic: Demand9) If the price of automobiles were to decrease substantially, the demand curve for automobiles would most likelyA) shift rightward.B) shift leftward.C) remain unchanged.D) become steeper.Answer: CTopic: Demand10) If the price of automobiles were to decrease substantially, the demand curve for public transportation would most likelyA) shift rightward.B) shift leftward.C) remain unchanged.D) remain unchanged while quantity demanded would change.Answer: BTopic: Demand11) An increase in the demand curve for orange juice would be illustrated as aA) leftward shift of the demand curve.B) rightward shift of the demand curve.C) movement up along the demand curve.D) movement down along the demand curve.Answer: BTopic: Demand12) The term "inverse demand curve" refers toA) a demand curve that slopes upward.B) expressing the demand curve in terms of price as a function of quantity.C) the demand for "inverses."D) the difference between quantity demanded and supplied at each price.Answer: BTopic: Demand13) If the demand for oranges is written as Q = 100 - 5p, then the inverse demand function isA) Q = 5p - 100.B) Q = 20 - .2p.C) p = 20 - 5Q.D) p = 20 - .2Q.Answer: DTopic: Demand14) To determine the total demand for all consumers, sum the quantity each consumer demandsA) at a given price.B) at all prices and then sum this amount across all consumers.C) Both A and B will generate the same total demand.D) None of the above.Answer: ATopic: Demand15) The above figure shows a graph of the market for pizzas in a large town. No pizzas will be demanded unless price is less thanA) $0.B) $5.C) $12.D) $14.Answer: DTopic: DemandFor the following, please answer "True" or "False" and explain why.16) If a good is not produced, then there is no demand for it.Answer: False. The demand for a product is independent of its supply. It is possible that people want to buy some of the product but at prices that are below what sellers would require to begin production.Topic: Demand17) Because people prefer name-brand pain-relieving drugs over store-brand pain-relieving drugs, demand curves do not slope downward for pain-relieving drugs.Answer: False. Demand curves slope downward assuming all other factors do not change. Consumers may view brand-name drugs to be of higher quality than store-brand drugs, and therefore the demand curve for brand-name drugs lies to the right of the demand curve for store-brand drugs.Topic: Demand18) The quantity of a good that consumers demand depends only on the price of the good.Answer: False. The quantity of a good demanded depends on many factors including: price, consumers' incomes, and the price of related goods.Topic: Demand19) During the winter of 1997-1998, the northeastern United States experienced warmer than usual conditions. The price of home heating oil was less than it was during the previous winter, but people bought less home heating oil. This contradicts the Law of Demand.Answer: False. The statement claiming a contradiction confuses a change in quantity demanded with a change in the demand curve. The law of demand refers to movements along a given demand curve. The mild weather caused a leftward shift of the demand curve.Topic: Demand20) Suppose an individual inverse demand curve is given as P = 2 - 1/2 q i, where q i is the quantity demanded by individual i. There are 50 individual consumers with this identical, individual inverse demand curve. Solve for the market demand curve.Answer: Solve for the individual, regular demand curve, q i = 4 - 2P. Multiply the individual demand curve by 50 to yield q D = 200 - 100P.Topic: Demand21) Suppose the market demand curve for pizza can be expressed as QD = 100 - 2P + 3Pb, where QD is the quantity of pizza demanded, P is the price of a pizza, and Pb is the price of a burrito. What is the slope of this demand function, and what information does the slope provide?Answer: The slope is -2. The slope tells us how a change in the price of pizzas affects the quantity of pizzas demanded. An increase in the price of pizzas by $1 will result in a decrease of the quantity demanded by 2 pizzas.Topic: Demand22) Suppose the demand for a particular product can be expressed as Q = 100/p. Calculate the total amount spent on this good when p = 10, 20, and 50. Can you make a generalization about the mathematical form of this demand curve and consumer behavior in this market?Answer: In all cases, total expenditure equals 100 (since p * Q = 100). In general, a nonlinear demand curve of the form Q = A/p means that consumers wish to spend a total of A on this good regardless of its price. Topic: Demand2.2 Supply1) Suppose the demand curve for a good shifts rightward, causing the equilibrium price to increase. This increase in the price of the good results inA) a rightward shift of the supply curve.B) an increase in quantity supplied.C) a leftward shift of the supply curve.D) a downward movement along the supply curve.Answer: BTopic: Supply2) A rise in the oil price willA) shift the supply curve to the left.B) shift the supply curve to the right.C) leave the supply curve unchanged.D) not enough information.Answer: ATopic: Supply3) The above figure shows a graph of the market for pizzas in a large town. No pizzas will be supplied unless the price is aboveA) $0.B) $5.C) $12.D) $14.Answer: BTopic: Supply4) Supply curvesA) slope upward.B) slope downward.C) are horizontal.D) can have many shapes.Answer: DTopic: Supply5) Suppose there are 100 identical firms in the rag industry, and each firm is willing to supply 10 rags at any price. The market supply curve will be a(n)A) vertical line where Q = 10.B) vertical line where Q = 100.C) vertical line where Q = 1000.D) horizontal line where Q = 1000.Answer: CTopic: Supply6) The expression "increase in quantity supplied" is illustrated graphically as aA) leftward shift in the supply curve.B) rightward shift in the supply curve.C) movement up along the supply curve.D) movement down along the supply curve.Answer: CTopic: Supply7) If the supply curve of a product changes so that sellers are now willing to sell 2 additional units at any given price, the supply curve willA) shift leftward by 2 units.B) shift rightward by 2 units.C) shift vertically up by 2 units.D) shift vertically down by 2 units.Answer: BTopic: Supply8) The market supply curve is found byA) horizontally summing all individual supply curves.B) vertically summing all individual supply curves.C) Either A or B above since they both give the same answer.D) None of the above.Answer: ATopic: Supply9) Technological innovation in the production of computers has led toA) a decrease in the quantity demanded for computers.B) a rightward shift of the supply curve for computers.C) a decrease in the quantity supplied of computers.D) None of the above.Answer: BTopic: Supply10) Restricting imports tends toA) shift the demand curve for the product to the left.B) shift the demand curve for the product to the right.C) change the shape of the supply curve.D) increase the quantity supplied of a product.Answer: CTopic: SupplyFor the following, please answer "True" or "False" and explain why.11) The Law of Supply insures that supply curves slope upward.Answer: False. There is no Law of Supply. Supply curves can take multiple shapes and thus don't have to be upward-sloping. (p. 22)Topic: Supply12) Suppose the following information is known about a market:1. Sellers will not sell at all below a price of $2.2. At a price of $10, any given seller will sell 10 units.3. There are 100 identical sellers in the market.Assuming a linear supply curve, use this information to derive the market supply curve.Answer: First, Q = 100q since all firms are identical. This gives two points: (p = 2, Q = 0) and (p = 10, Q = 1000). From the first point, it is known that p = 2 + bQ. When Q = 1000, 10 = 2 + b(1000). Solving for b yields b = .008. Rearranging to solve for Q yields: Q = -250 + 125p or P= 2 + .008Q.Topic: Supply2.3 Market Equilibrium1) Equilibrium is defined as a situation in whichA) neither buyers nor sellers want to change their behavior.B) no government regulations exist.C) demand curves are perfectly horizontal.D) suppliers will supply any amount that buyers wish to buy.Answer: ATopic: Market Equilibrium2) Once an equilibrium is achieved, it can persist indefinitely becauseA) shocks that shift the demand curve or the supply curve cannot occur.B) shocks to the demand curve are always exactly offset by shocks to the supply curve.C) the government never intervenes in markets at equilibrium.D) in the absence of supply/demand shocks no one applies pressure to change the price. Answer: DTopic: Market Equilibrium3) If price is initially above the equilibrium level,A) the supply curve will shift rightward.B) the supply curve will shift leftward.C) excess supply exists.D) all firms can sell as much as they want.Answer: CTopic: Market Equilibrium4) A competitive equilibrium is described byA) a price only.B) a quantity only.C) the excess supply minus the excess demand.D) a price and a quantity.Answer: DTopic: Market Equilibrium5) The above figure shows a graph of the market for pizzas in a large town. At a price of $14, there will beA) no pizzas supplied.B) equilibrium.C) excess supply.D) excess demand.Answer: CTopic: Market Equilibrium6) The above figure shows a graph of the market for pizzas in a large town. At a price of $5, there will beA) excess demand.B) excess supply.C) equilibrium.D) zero demand.Answer: ATopic: Market Equilibrium7) The above figure shows a graph of the market for pizzas in a large town. What are the equilibrium price and quantity?A) p = 8, Q = 60B) p = 60, Q = 8C) p = 14, Q = 140D) p = 5, Q = 60Answer: ATopic: Market Equilibrium8) The above figure shows a graph of a market for pizzas in a large town. At a price of $7, what is the amount of excess demand?A) 0; there is excess supply at $7.B) 20 unitsC) 30 unitsD) 10 unitsAnswer: CTopic: Market Equilibrium9) The above figure shows a graph of a market for pizzas in a large town. At a price of $10, the marketA) is not in equilibrium.B) has excess supply.C) does not have excess demand.D) All of the above.Answer: DTopic: Market Equilibrium10) The above figure shows three different supply-and-demand graphs. Which graph best represents the market for vacations on Mars?A) Graph AB) Graph BC) Graph CD) None of the above.Answer: ATopic: Market Equilibrium11) The above figure shows three different supply-and-demand graphs. Which graph best represents the market for workers at your nearest fast-food restaurant?A) Graph AB) Graph BC) Graph CD) None of the above.Answer: CTopic: Market Equilibrium12) The above figure shows three different supply-and-demand graphs. Which graph best represents the market for the air we are currently breathing?A) Graph AB) Graph BC) Graph CD) None of the above.Answer: BTopic: Market Equilibrium13) After tickets for a major sporting event are purchased at the official box office price, a market often develops whereby these tickets sell at prices well above the official box office price. Which of the following scenarios would NOT be able to explain this result?A) The official price was below equilibrium from the moment the tickets were available.B) Increased publicity causes the demand curve for the event to shift rightward.C) The event was not a sellout.D) Not everyone who wanted a ticket was able to buy one at the box office.Answer: CTopic: Market EquilibriumFor the following, please answer "True" or "False" and explain why.14) When a market is in disequilibrium consumers and producers change their behavior. As a result the market reaches equilibrium.Answer: True. For example, when a shortage exists at a given price consumer bid up the price and firms increase production until the equilibrium is reached.Topic: Market Equilibrium15) Suppose the market for potatoes can be expressed as follows:Supply: Q S = -20 + 10pDemand: Q D = 400 - 20pSolve for the equilibrium price and quantity.Answer: Equate the RHS of the supply equation to the RHS of the demand equation: -20 + 10p = 400 - 20p. Rearrange: 30p = 420 or p = 14. Plug this into either S or D to get Q: Q = 400 - 20(14) = 120.Topic: Market Equilibrium16) Use supply-and-demand graphs to explain why parking is free at the suburban shopping mall but one typically must pay to park when shopping downtown.Answer:See the above figure. At the suburban shopping mall, the only cars typically on the lot belong to shoppers and employees. Mall lots are usually built to be large enough to handle peak crowds. For the relevant quantities, the supply curve is horizontal at a price of zero. As a result, the quantity demanded never exceeds the amount that is provided freely. Downtown, shoppers compete with a larger quantity and greater variety of drivers for parking spaces. The quantity that is available freely is not enough to accommodate all of those who wish to park downtown.Topic: Market Equilibrium17) Explain why the equilibrium price is called the market clearing price.Answer: At the equilibrium price, sellers want to sell the exact amount consumers want to buy. There is no excess demand or excess supply. The market is exactly cleared of all goods.Topic: Market Equilibrium2.4 Shocking the Equilibrium1) From the 1970s through the 1990s, the relative price of a college education has increased greatly. During the same time period, college enrollment has also increased. This evidence suggests that during this time periodA) the demand curve for a college education has shifted leftward.B) the demand curve for a college education has shifted rightward.C) the supply curve for a college education has shifted leftward.D) the supply curve for a college education has shifted rightward.Answer: BTopic: Shocking the Equilibrium2) The above figure shows four different markets with changes in either the supply curve or the demand curve. Which graph best illustrates the market for coffee after severe weather destroys a large portion of the coffee crop?A) Graph AB) Graph BC) Graph CD) Graph DAnswer: CTopic: Shocking the Equilibrium3) The above figure shows four different markets with changes in either the supply curve or the demand curve. Which graph best illustrates the market for tea after severe weather destroys a large portion of the coffee crop?A) Graph AB) Graph BC) Graph CD) Graph DAnswer: ATopic: Shocking the Equilibrium4) The above figure shows four different markets with changes in either the supply curve or the demand curve. Which graph best illustrates the market for non-dairy coffee creamer after severe weather destroys a large portion of the coffee crop?A) Graph AB) Graph BC) Graph CD) Graph DAnswer: DTopic: Shocking the Equilibrium5) The above figure shows four different markets with changes in either the supply curve or the demand curve. Which graph best illustrates the market for computers after technological advances in making computers occur?A) Graph AB) Graph BC) Graph CD) Graph DAnswer: BTopic: Shocking the Equilibrium6) The above figure shows four different markets with changes in either the supply curve or the demand curve. Which graph best illustrates the market for computer manuals after technological advances in making computers occur?A) Graph AB) Graph BC) Graph CD) Graph DAnswer: ATopic: Shocking the Equilibrium7) The above figure shows four different markets with changes in either the supply curve or the demand curve. Which graph best illustrates the market for typewriters after technological advances in computerized word-processing software occur?A) Graph AB) Graph BC) Graph CD) Graph DAnswer: DTopic: Shocking the Equilibrium8) Suppose a market were currently at equilibrium. A rightward shift of the demand curve would causeA) an increase in price but a decrease in quantity.B) a decrease in price but an increase in quantity.C) an increase in both price and quantity.D) a decrease in both price and quantity.Answer: CTopic: Shocking the Equilibrium9) Suppose a market were currently at equilibrium. A rightward shift of the supply curve would cause a(n)A) increase in price but a decrease in quantity.B) decrease in price but an increase in quantity.C) increase in both price and quantity.D) decrease in both price and quantity.Answer: BTopic: Shocking the Equilibrium10) A rightward shift of the demand curve will lead to a(n)A) increase in equilibrium price.B) excess demand at the old equilibrium price.C) increase in quantity supplied.D) All of the above.Answer: DTopic: Shocking the Equilibrium11) A rightward shift of the supply curve will lead to a(n)A) decrease in equilibrium price.B) excess supply at the old equilibrium price.C) increase in quantity demanded.D) All of the above.Answer: DTopic: Shocking the Equilibrium12) If the demand curve is vertical a rightward shift of the supply curve will lead toA) an increase in quantity supplied.B) an increase in quantity demanded.C) a decrease in quantity demanded.D) an increase in price.Answer: DTopic: Shocking the Equilibrium13) When import restrictions are placed on a good, and as a result the price of the good increases, the demand curve for that good willA) shift rightward.B) shift leftward.C) become steeper.D) be unaffected.Answer: DTopic: Shocking the Equilibrium14) When two goods are substitutes, a shock that raises the price of one good causes the price of the other good toA) remain unchanged.B) decrease.C) increase.D) change in an unpredictable manner.Answer: CTopic: Shocking the Equilibrium15) A drought in the Midwest will raise the price of wheat because of aA) leftward shift in the supply curve.B) rightward shift in the supply curve.C) leftward shift in the demand curve.D) rightward shift in the demand curve.Answer: ATopic: Shocking the Equilibrium16) If pizza and tacos are substitutes, a decrease in the price of tacos would lead to aA) decrease in the demand curve for pizza.B) decrease in the quantity demanded of pizza.C) decrease in the price of pizza.D) All of the above.Answer: DTopic: Shocking the EquilibriumFor the following, please answer "True" or "False" and explain why.17) During a mild winter, the price of home heating oil is expected to be less than it would be during a normal winter.Answer: True. During a mild winter, people do not need to operate their furnace as often as in a normal winter. The demand for home heating oil lies to the left of where it would be under normal weather conditions. As a result, the price of oil falls.Topic: Shocking the Equilibrium18) What happens to the equilibrium price and quantity of coffee when there is a leftward shift of the supply curve for tea? Explain.Answer:See the above figure. The leftward shift in the supply of tea causes tea prices to increase. Since coffee and tea are substitutes, the demand for coffee increases, resulting in higher coffee prices.Topic: Shocking the Equilibrium19) Suppose there is a linear downward-sloping demand curve and a linear upward-sloping supply curve fora good. The price of a substitute good increases and the price of an input to production also increases. Graph the original demand and supply curves, and the curves after the substitute good and input prices increase. How will the equilibrium price change after the substitute and input prices increase?Answer:See the above figure. The new demand curve will be to the right of the original demand curve and the new supply curve will be to the left of the original supply curve. The equilibrium price will increase. The change in equilibrium quantity cannot be determined and will depend on the relative magnitude of the supply and demand shifts.Topic: Shocking the Equilibrium2.5 Effects of Government Interventions1) Government actions can cause aA) shift in the supply curve.B) shift in the demand curve.C) reaction from firms in other countries.D) All of the above.Answer: DTopic: Effects of Government Intervention2) Municipalities that have adopted the policy of "rent control" typically set the rentals on certain apartments well below equilibrium. As a result,A) landlords have a difficult time finding tenants.B) prospective tenants have a difficult time finding available apartments.C) there is a surplus of apartments.D) All of the above.Answer: BTopic: Effects of Government Intervention3) Complete the sentence. "Next to bombing ________ are the best way to destroy a city."A) rent controlsB) minimum wagesC) health insurance premiums.D) price floors.Answer: ATopic: Effects of Government Intervention4) When "rent controls" result in a shortage of housing, landlordsA) use criteria other than price to allocate housing.B) lower the price to allocate the housing.C) attempt to attract renters.D) None of the above.Answer: ATopic: Effects of Government Intervention5) A restriction on the number of people allowed to be medical doctors in the United States would most likelyA) increase doctors' fees.B) decrease the demand for doctors.C) decrease the demand for nurses.D) decrease the number of people who get sick.Answer: ATopic: Effects of Government Intervention6) The above figure shows the market for crude oil. If a consumer group convinces the government to set a maximum price of $2 per barrel, thenA) 300 barrels of crude oil will be sold at $2.B) zero barrels of crude oil will be sold.C) zero barrels of crude oil will be demanded.D) None of the above.Answer: BTopic: Effects of Government Intervention7) The above figure shows the market for crude oil. If the oil exploration firms convince the government to set a minimum price of $4 per barrel, thenA) 100 barrels of crude oil will be sold at $4.B) zero barrels of crude oil will be sold.C) zero barrels of crude oil will be demanded.D) None of the above.Answer: ATopic: Effects of Government Intervention8) The above figure shows the market for crude oil. If the government restricts output to no more than 300 barrels, thenA) 300 barrels of crude oil will be sold at $3.B) 200 barrels of crude oil will be sold at $3.C) zero barrels of crude oil will be sold.D) None of the above.Answer: BTopic: Effects of Government Intervention9) If a government-imposed price ceiling causes the observed price in a market to be below the equilibrium price,A) there will be excess demand.B) there will be excess supply.C) the curves will shift to make a new equilibrium at the regulated price.D) None of the above.Answer: ATopic: Effects of Government Intervention10) In the labor market, if the government imposes a minimum wage that is below the equilibrium wage, thenA) workers who wish to work at the minimum wage will have a difficult time finding jobs.B) firms will hire fewer workers than without the minimum wage law.C) some workers may lose their jobs as a result.D) nothing will happen to the wage rate or employment.Answer: DTopic: Effects of Government Intervention11) Government prohibition of advertising liquor on television would most likely result inA) a rightward shift in the demand curve for liquor.B) a leftward shift in the demand curve for liquor.C) a rightward shift in the demand curve for television advertising time.D) no change in the market for either liquor or television advertising.Answer: BTopic: Effects of Government Intervention12) The above figure shows a graph of the market for pizzas in a large town. Suppose that concern over dietary habits has led the government to impose a restriction that limits suppliers to produce no more than 40 pizzas. What will the price of pizza be as a result of this quota?A) $2B) $7C) $8D) $10Answer: DTopic: Effects of Government Intervention13) The above figure shows a graph of the market for pizzas in a large town. Suppose that concern over dietary habits has led the government to impose a restriction that limits suppliers to produce only 40 pizzas. As a result, for prices greater than $7, theA) supply curve is unchanged.B) supply curve is vertical.C) demand curve becomes vertical.D) demand curve becomes horizontal.Answer: BTopic: Effects of Government Intervention。
2003-2004学年第二学期中级宏观经济学(Macroeconomics)考试试题答案(经济试验班021、022)Ⅰ.Choose the best answers (2'×10)1.B2.A3.C4.B5.C6.A7.B8.C9.C 10.DⅡ. Explain the following terms. (20 points)1.Endogenous variables: 经济模型中要解释的变量。
Exogenous variables:模型给出作为既定的变量。
2. Menu costs:企业因通货膨胀改变价格的成本。
shoe-leather costs:为减少持有货币的损失而发生的成本。
3. GDP deflator :名义GDP/实际GDP,是相对于基年商品和劳务价格的那一年的商品和劳务价格。
CPI:即消费价格指数,是相对于某个基年一篮子物品与劳务价格的同样一篮子物品与劳务的现期价格。
4. Adaptive expectation :人们根据过去的经验或数据来预测未来。
rational expectation:人们尽可能地利用所有可以获得地信息,包括关于现在政府政策地信息预测未来。
5. Real exchange rate :两国物品的相对价格。
nominal exchange rate:两国通货的相对价格。
Ⅲ.Answer the following questions by drawing or calculating. (10’ ×4) 1.We want to consider the effects of a tax cut when the LM* curve depends on disposable income instead of income: M/P = L[r, Y –T].A tax cut now shifts both the IS* and the LM* curves. Figure 12–22 shows the case of floating exchange rates. The IS* curve shifts to the right, from IS to IS . The LM* curve shifts to the left, however, from LM to LM .We know that real balances M/P are fixed in the short run, while the interest rate is fixed at the level of the world interest rate r*. Disposable income is the only variable that can adjust to bring the money market into equilibrium: hence, the LM* equation determines the level of disposable income. If taxes T fall, then income Y must also fall to keep disposable income fixed. In Figure 12–22, we move from an original equilibrium at point A to a new equilibrium at point B. Income falls by the amount of the tax cut, and the exchange rate appreciates. If there are fixed exchange rates, theIS* curve still shifts to the right; but the initial shift in the LM* curve no longer matters. That is, the upward pressure on the exchange rate causes the central bank to sell dollars and buy foreign exchange; this increases the money supply and shifts the LM* curve to the right, as shown in Figure 12–23. The new equilibrium, at point B, is at the intersection of the new IS* curve, IS , and the horizontal line at the level of the fixed exchange rate. There is no difference between this case and the standard case where money demand depends on income.2. a.将生产函数两边同时除以效率工人,则有:()4.04.06.04.0k L E K L E L E K L E Y y =⎪⎭⎫ ⎝⎛⨯=⨯⨯=⨯=b .s=0.25 δ=5% n=2% g=3%; 带入经济稳定的条件:38.15.275.0)1(*84.15.2*6.45.2*1.025.0)()(3/23/24.03/54.0≈⨯=-=≈==≈==⋅++=⋅y s c k y k kk kg n k f s δc.当g 变为5%时,有: 63.11225*4.31225*12.025.0)()(3/24.03/54.0≈⎪⎭⎫ ⎝⎛==≈⎪⎭⎫ ⎝⎛==⋅++=⋅k y k kk kg n k f s δ 这种变化导致了效率工人的人均资本量减少,效率工人的人均产量下降;但总产出会增加。
3.The aggregate demand curve represents the negative relationship between the price level and the level of national income. In Chapter 9, we looked at a simplified theory of aggregate demand based on the quantity theory. In this chapter, we explore how the IS –LM model provides a more complete theory of aggregate demand. We can see why the aggregate demand curve slopes downward by considering what happens in the IS –LM model when the price level changes. As Figure 11–1(A) illustrates, for a given money supply, an increase in the price level from P 1 to P 2 shifts the LM curve upward because real balances decline; this reduces income from Y 1 to Y 2. Theaggregate demand curve in Figure 11–1(B) summarizes this relationship between the price level and income that results from the IS –LM model.4.a. Recall from Chapter 4 that we can express the quantity equation in terms of percentage changes: % in M + % in V = % in P + % in Y.If we assume that velocity is constant, then the % in V = 0. Therefore, % in M = % in P + % in Y.We know that in the short run, the price level is fixed. This implies that the % in P = 0. Therefore,% in M = % in Y.Based on this equation, we conclude that in the short run a 5-percent reduction in the money supply leads to a 5-percent reduction in output. This is shown in Figure9-9.In the long run we know that prices are flexible and the economy returns to its natural rate of output. This implies that in the long run, the % in Y = 0. Therefore, % in M= % in P. Based on this equation, we conclude that in the long run a 5-percent reduction in the money supply leads to a 5-percent reduction in the price level, as shown in Figure 9–9.b.Okun’s law refers to the neg ative relationship that exists between unemployment and real GDP. Okun’s law can be summarized by the equation:% in Real GDP = 3% – 2 ⋅ [ in Unemployment Rate]. That is, output moves in the opposite direction from unemployment, with a ratio of 2 to 1. In the short run, when Y falls 5 percent, unemployment increases 2-1/2 percent. In the long run, both output and unemployment return to their natural rate levels. Thus, there is no long-run change in nemployment.Ⅳ.Use the theories that you just have learnt to analysis the macroeconomics policies in china and give your suggestions. (20'×1)略以下是附加文档,不需要的朋友下载后删除,谢谢班主任工作总结专题8篇第一篇:班主任工作总结小学班主任特别是一年级的班主任,是一个复合性角色。