雅思小作文流程图 地图题PPT课件
- 格式:pptx
- 大小:2.07 MB
- 文档页数:26

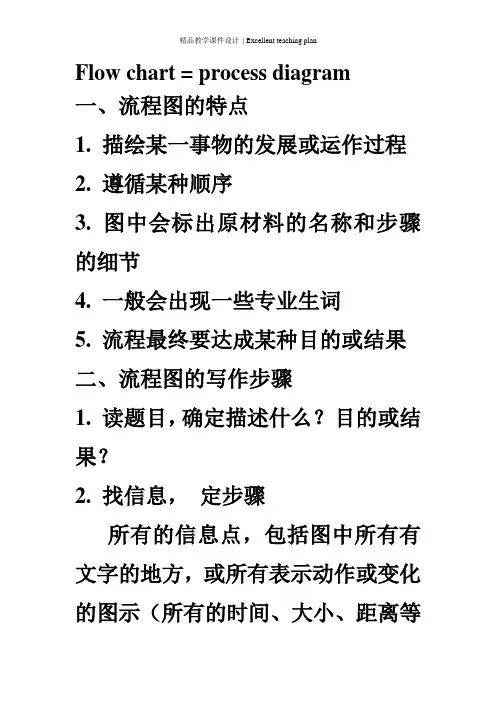
Flow chart = process diagram一、流程图的特点1. 描绘某一事物的发展或运作过程2. 遵循某种顺序3. 图中会标出原材料的名称和步骤的细节4. 一般会出现一些专业生词5. 流程最终要达成某种目的或结果二、流程图的写作步骤1. 读题目,确定描述什么?目的或结果?2. 找信息,定步骤所有的信息点,包括图中所有有文字的地方,或所有表示动作或变化的图示(所有的时间、大小、距离等数字信息)1.定框架,写文章第一段:介绍流程图是做什么的。
第二段:详细介绍原料与准备、每一步的变化、过程及结果。
第三段:简单总结2.读文章,做检查单词拼写、语法、替换重复的词汇等。
三.流程图常用的表达1. The flow chart illustrates the recycling process of _____.2. The process of ____ involves the following steps.3. The whole procedure of ___ can be categorised into ____ stages.4. The row materials for ____ include ___, ___ and ____.5. The first step is to ______.6. ____ with ____ is prepared to _____.7. ____ is used as ____ of ____.8. _____ is mixed with ____ to produce _____.9. _____ can change into ____, when ____.10. The process of ____ is really a simple(complicated) process.The pictures below show the recycling process of wasted glass bottles.As is displayed in the flow chart, the recycling process of glass is really a complex one.The overall process can be categorised=classified=divided into three stages.First, glass products in various forms are gathered=assembled in the Collection point, so that they are easily transported by special trucks or vans to the Cleaning plant, where they get sterilisation byhigh-pressured water. There are three different channels in the Recycling plant, namely Brown, Green and Clear, which represent the colors of glass. After recycled in the furnace, glass products are melted=forged into recycled liquid glass. Mixed with new liquid glass, the compound is finally moulded into solid glass, which, afterwards, will be sent to various customer supermarkets for selling. Thus, the glass will go to the customers for different purposes.Through a brief introduction of the circle of glass recycling, we come to realize that recycling plays a vital role in environmental protection and ecological preservation.The diagram below describes how to recycle organic waste to produce compost(fertilizer).1. The flow chart illustrates the recycling process of organic waste to produce fertilizer.As is clearly shown in the picture, thefirst step is to find a plastic container of two cubic metres and stab several holes on its body so that air could fill in. Secondly, a 15cm thick layer of food is placed at the bottom of the container and grass is put just above the layer for the same height with some news paper covered on the very top. After that, some nitrogen and water are added into the container, and the water should only be hot. Finally, the container is sealed up and the external heat would help the formation of the compost. After six months, when the fertilizer is ready, all we have to do is to pour it into garden soil to nourish plants and flowers.Generally speaking, making garden fertilizer in this way is easy to operate but it costs much time.2. The flow chart shows the wholeprocess of producing fertilizer by recycling organic waste.Firstly, a two cubic metres plastic container is prepared, with some air holes on its body. Secondly, some organic waste is put into the plastic container. The organic waste includes news paper, grass and food. The right order of adding them is putting food in the bottom 15cm of the container and grass in the middle 15cm upon food. News paper is on the very top. Then nitrogen and water are added into the container. What should be noticed is that water can only be hot water. The next step is to seal up and heat the container. After six months, compost is produced. So we can use them to fertilize the garden.As can be seen from the picture, it isusually simple to change organic waste into fertilizer used to water flowers and trees in the garden.3. The information provided in the diagram is about how to use organic waste to produce compost in the following several simple stages.The first stage is to prepare a plastic container, two cubic metres in volume, with some ventilation holes on the side. Then organic waste such as leaves, pieces of paper and residues can be placed into the container so that three layers (each 15 cm) can be formed in the bottom---news paper, grass and food respectively from up to down. The next important step is to add nitrogen into it and then pour hot water only in to mix together. What is remembered to do next is that the container needs to besealed and heated. As a result, the vapor can be emitted through the holes located on its body. After that it takes roughly six months to convert into composts and then they are ready for fertilizing plants and flowers in the garden.。


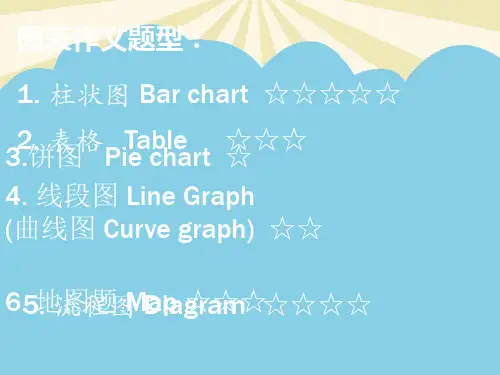

静态图表和流程地图的写法技巧、词汇句型和得分点屠鸭联盟:老徐雅思◆数据图表题线图line chart柱图column / bar chart饼图pie chart表格table◆非数据图表题流程图flow chart地图map柱图、饼图、表格静态图:项目之间对比1. 判断图表主要比较什么内容2. 注意句型的变化(变换主语)3. 比较级与最高级结合使用4. 最大值、其次值、相等值、最小值、倍数、合并、省略5. 如何读数字功能句型(比较)(1) The number of French visitors was the largest in the four countries / larger than any other countries'.(2) Women spent 36 hours on housework, compared with men who spent 25 hours at home.(3) The consumption of beef was 70 grams more / less than that of lamb.(4) The consumption of beef ranked the second / was the second largest in the four foods.(5) The consumption of beef was the largest (250 g), followed by lamb (220g).(6) Students who watch less television have higher scores.功能句型(倍数)(1) The amount of coal was three times as much as / more than that of oil.(2) The number of cars produced in factory A was three times as many as that in factory B.(3) The amount of beef almost doubled / tripled,rising / climbing from *** to ***.(4) The percentage of female students increased four times.(5) Factory A produced three times as many cars as Factory B.表格:The table below gives information on consumer spending on different items in five different countries in 2002. (剑7-1)参考范文(主体段节选)It can be seen from the table that the spending on food/drinks/tobacco was much more than that on clothing/footwear and leisure/education in all five countries.In these five countries, Turkish people spent the highest percentage on food, drinks and tobacco(almost one third), closely followed by Irish people(nearly 30%). The figures in Sweden, Italy and Spain were much smaller and they were all less than 20%.The expenditure on leisure and education in Turkey was 4.35%, which was nearly twice as much as the percentage in Ireland(2.21%). By contrast, Spanish people spent the lowest proportion on this item(1.98%). Swedish and Italian people spent almost the same percentage (3.2%).参考范文(结尾段)Among the five countries, Turkish people spent the highest proportion on food/drink/tobacco and on leisure/education and the largest spender on clothes/footwear was Italy.表格:The pie chart below shows the main reasons why agricultural land becomes less productive. The table shows how these causes affected three regions of the world during the 1990s. (剑8-1)表格参考范文(老徐版本)The percentage of land degraded in Europe was the highest, at 23%. The most significant cause was deforestation, which was responsible for 9.8% of land degradation. North America and Oceania were less affected by this reason (0.2% and 1.7%). Europe also suffered from over-cultivation (7.7%) and over-grazing (5.5%). By contrast, Oceania had 13% of land degraded and it was mainly due to over-grazing (11.3%). Land degradation was the lowest in North America at only 5%, and the main causes were over-cultivation (3.3%) and over-grazing (1.5%).结尾段(考官版本):Overall, it is clear that Europe suffered more from farmland degradation than the other regions, and the main causes there were deforestation and over-cultivation.静态饼图:2013年1月5号考题对于这个饼图,可以按饼的顺序来写,也可以按项目顺序来写。