电化学交流阻抗谱(免费)
- 格式:ppt
- 大小:1.89 MB
- 文档页数:38
交流阻抗谱
交流阻抗谱是一种用于描述材料或电化学系统的阻抗随频率变化而变化的谱图。
它通常由实部和虚部组成,实部表示对电流的阻碍程度,虚部表示由于电化学反应引起的相位差。
交流阻抗谱通常用于分析电化学体系中的电极界面和电解质界面的反应动力学过程。
通过测量电流和电压之间的相位差和幅度,可以获得材料或电化学系统在不同频率下的电极过程和界面反应的信息。
交流阻抗谱的形状和特征可以提供有关材料或电化学系统的信息,比如材料的电导率、电容特性、界面电极反应速率等。
通过分析交流阻抗谱可以获得材料的电化学特性,从而应用于电池、燃料电池、传感器等领域的研究和开发中。
交流阻抗谱通常以Bode图或Nyquist图的形式呈现,其中Bode图以频率为横轴,以幅度和相位为纵轴;Nyquist 图以实部为横轴,虚部为纵轴。
通过分析这些图像,可以得到关于材料或系统的详细信息。
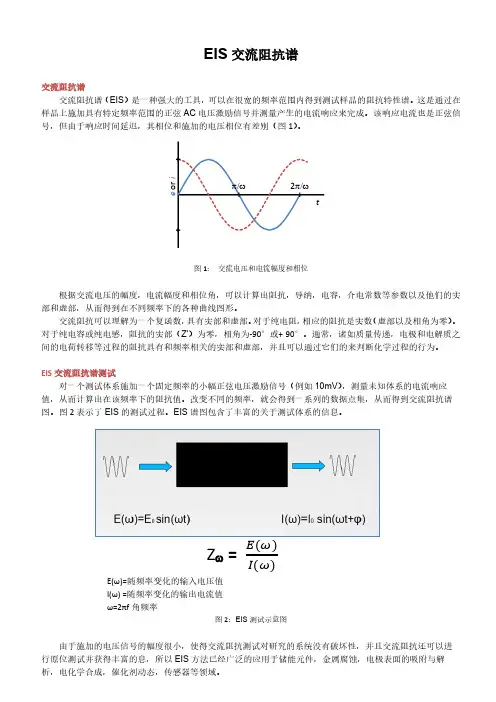
EIS 交流阻抗谱交流阻抗谱交流阻抗谱(EIS )是一种强大的工具,可以在很宽的频率范围内得到测试样品的阻抗特性谱。
这是通过在样品上施加具有特定频率范围的正弦AC 电压激励信号并测量产生的电流响应来完成。
该响应电流也是正弦信号,但由于响应时间延迟,其相位和施加的电压相位有差别(图1)。
图1: 交流电压和电流幅度和相位根据交流电压的幅度,电流幅度和相位角,可以计算出阻抗,导纳,电容,介电常数等参数以及他们的实部和虚部,从而得到在不同频率下的各种曲线图形。
交流阻抗可以理解为一个复函数,具有实部和虚部。
对于纯电阻,相应的阻抗是实数(虚部以及相角为零)。
对于纯电容或纯电感,阻抗的实部(Z')为零,相角为-90°或+ 90°。
通常,诸如质量传递,电极和电解质之间的电荷转移等过程的阻抗具有和频率相关的实部和虚部,并且可以通过它们的来判断化学过程的行为。
EIS 交流阻抗谱测试对一个测试体系施加一个固定频率的小幅正弦电压激励信号(例如10mV ),测量未知体系的电流响应值,从而计算出在该频率下的阻抗值。
改变不同的频率,就会得到一系列的数据点集,从而得到交流阻抗谱图。
图2表示了EIS 的测试过程。
EIS 谱图包含了丰富的关于测试体系的信息。
Z ω =E(ω)I(ω)E(ω)=随频率变化的输入电压值 I(ω) =随频率变化的输出电流值 ω=2πf 角频率图2:EIS 测试示意图由于施加的电压信号的幅度很小,使得交流阻抗测试对研究的系统没有破坏性,并且交流阻抗还可以进行原位测试并获得丰富的息,所以EIS 方法已经广泛的应用于储能元件,金属腐蚀,电极表面的吸附与解析,电化学合成,催化剂动态,传感器等领域。
进行EIS测试时,严格来讲,需要满足以下三个条件,这样才能保证交流阻抗的结果的可靠性。
1.因果关系:当用一个正弦波的电压信号对测试体系进行扰动时,测试体系只对施加的扰动信号有响应。
2. 线性条件:施加扰动信号和响应信号在一个线性范围内,这就要求扰动信号足够小时,才能保证线性响应。
电化学交流阻抗谱电阻读数
电化学交流阻抗谱(EIS)是一种用来研究电化学系统的技术,
它可以提供关于电化学界面和材料的信息。
在EIS中,电阻读数是
指通过电化学交流阻抗谱测量得到的电阻值。
电阻读数可以用来表
征电极/电解质界面的电阻性质,以及电化学过程中的电阻变化。
从理论角度来看,电阻读数可以反映电化学系统中电子传输和
离子传输的阻力情况。
在实际应用中,电阻读数可以帮助我们了解
电化学系统的动力学特性,比如电化学反应的速率、电极表面的活
性等。
此外,电阻读数还可以用于研究电化学界面的变化,比如材
料的腐蚀情况、电极表面的吸附现象等。
在实验中,通过测量电化学交流阻抗谱并对数据进行拟合分析,可以得到不同频率下的电阻读数。
这些电阻读数可以用来构建等效
电路模型,进而帮助我们理解电化学系统的复杂性。
通过对电阻读
数的分析,可以更深入地研究电化学系统的动力学行为和界面特性。
总之,电阻读数在电化学交流阻抗谱中扮演着重要的角色,它
提供了关于电化学系统动力学特性和界面特性的重要信息,对于研
究和应用电化学技术具有重要意义。

Chapter 11: AC Impedance Spectroscopyz Introductionz Basic elements in an electric circuitz Nyquist and Bode plotsz Data analysis and softwarez ExamplesTerminology:•AC Impedance Spectroscopy (IS)•Electrochemical Impedance Spectroscopy (EIS)•Complex Impedance Spectroscopy (CIS) References:•J.R. MacDonald, Impedance Spectroscopy, Chapel Hill, North Carolina, 1987. (John-Wiley, 2005?)•史美伦,交流阻抗谱原理及应用,国防工业出版社,2001.•曹楚南, 张鉴清,电化学阻抗谱导论,科学出版社,2002.--This is a transient technique, but one that requires a general steady state condition.--can be used for determining both:Interfacial parametersa) reaction rates b) rate constantsc) capacitance/charge storage abilitiesd) diffusion coefficients e) adsorption rate constantsf) reaction mechanismsAndMaterial parametersa) conductivity b) dielectric constantsc) bulk generation-recombination reaction ratesd) charge mobilities e) film thicknessf) equilibrium conc. of charged speciesg) presence of pores and cracksGeneral concept--in EIS, we apply a potential perturbation (usually a Sine wave)and observe the current response, which is a sine wave at the same frequency, but with a different amplitude and phase than thepotential signal.--like other spectroscopy experiments, we apply an excitation to the system under study and observe its response (generally as a function of frequency)Advantageous features of EIS--measurements are made under steady state conditions--all electrical parameters of the system can be determined in a single experiment--a simple measurement, easy to automate--characterize bulk and interfacial properties of all sorts of materials (conductors, semiconductors, ionic transport media, dielectrics (insulators))--can be used to help verify mechanistic models--works even in low conductivity electrolyte solutions--signal can be averaged over long periods to achieve high precision--nondestructiveCaution:Because it is easy to do, it is also easy to collect large amounts of meaningless data!Why impedance spectroscopy?Possible to know the grain-boundaryconductivityR: Resistance in ACC: Capacitance in ACL: Inductance in ACComplex impedance (impedance and admittance)2221'RC R ω+=22221RC CR ωω+−=222)(")'(R Z R Z =+−半圆:CR Z Z ωθ=−='/)"()tan(RLC parallel circuitR, L, CRC serial, RL serial, RLC serialRC parallel, RL parallel, RLC parallelRC-RCA typical electrode-solution interface in a cell--We have a capacitance due to charging/discharging the electrical double layer--In parallel with the double layer we have a faradaic reaction proceding at some potential-dependent rate. This is equivalent to a resistance (remember linear polarization ΔE/ΔI = Rct).--Finally, in series with those, there is the ever-present solution resistance RsbutAdvantages of Bode plotsOther parameters3-D impedance: resistance variation3-D impedance: capacitance variation3-D impedance: R&C variationDepression of semicirclesAn origin of depressed semicirclesdifferent R and C atdifferent spots on surface3D-impedance: depression angle variationSelection of plotData analysisBrick layer model: two-phase microstructureBlocking of ions-easy pathImpedance spectra for two zirconia ceramics, obtained at 300°C using sputteredplatinum electrodes: (a) Tetragonal zirconia ceramic (ZrO2: 3 mole % Y2O3) withlarge grain boundary arc due to continuous grain boundary phase.(b) Partiallystabilized ceramic (ZrO2: 6 mole % Y2O3) with small grain boundary arc due todiscrete grain boundary phase.(a) Tetragonal zirconia ceramic (ZrO2: 3 mole % Y2O3) in which the lines havedifferent slopes, as expected from the brick layer model. (b) Partially stabilizedceramic (ZrO2: 6 mole % Y2O3)in which the slopes of the lines are similar, as expectedfor discrete grain boundary phase.Simple analysis of impedance dataDefine equivalent circuitImpedance Spectroscopy: Application (PTCR Thermistor)difference in C?。
【⼲货】电化学交流阻抗谱(EIS)⼲货教程课件分析软件超级合集
电化学阻抗谱是(EIS)是电化学体系研究中应⽤最⼴泛的技术之⼀,也是测量电化学电容中等
效串联电阻最常⽤的⽅法。
电化学阻抗谱即通过测量阻抗随正弦波频率的变化,进⽽分析电极
过程动⼒学、双电层和扩散等,研究电极材料、固体电解质、导电⾼分⼦以及腐蚀防护等机
理。
EIS的优势在于对研究体系的⽆损检测,不影响后续的电化学测量与研究。
☝☝典型EIS谱图
⼩编整理了全系列的电化学阻抗谱学习资料,有⼲货,有课件,还有软件及教程,献给被EIS困
扰的各位童鞋:。
电化学阻抗谱(EIS)是一种研究电极系统的实验方法,通过测量电极系统在很宽频率范围内的交流电势与电流信号的比值(此比值即为系统的阻抗),以此来研究电极系统。
EIS在水解电解质体系中最早的应用则是1960年的Sluyters等人将阻抗在阻抗平面中绘出。
如今,EIS方法已经成为研究复杂化学和电化学过程(如腐蚀)的有力工具,特别是在近二十年来,在电化学能源系统(燃料电池,超级电容和二次电池)上的应用非常广泛,尤其是在预测电池状态(SOC,SOH)和确定限制电极性能因素(电导率、电荷转移特性、钝化膜特性等)方面。
其中,RCT代表的是电荷传递电阻,它是电极过程控制的体系中,在电极表面上电荷传递的电阻,也是电化学反应速度控制的步骤。
电荷传递电阻的数值通常用交流阻抗谱测定,并与控制步骤的动力学方程结合,从而得出控制步骤的动力学常数。