additive interaction
- 格式:pdf
- 大小:159.68 KB
- 文档页数:6
�9�9 934�9�9 �9�9 基础理论与方法�9�9 logistic回归模型中交互作用的分析及评价邱宏余德新王晓蓉付振明谢立亚【导读】流行病学病因学研究常运用logistic回归模型分析影响因素的作用,并利用纳入乘积项的方法分析因素间交互作用,如有统计学意义表示两因素间存在相乘交互作用,但乘积项若元统计学意义并不表示两因素间相加交互作用或生物学交互作用的有无。
文中介绍Rothman提出的针对logistic或Cox回归模型的三个评价相加交互作用的指标及其可信区间的计算,并以SPSS15.O软件应用实例分析得出logistic回归模型的参数估计值和协方差矩阵,引入Andersson等编制的Excel计算表,计算相加交瓦作用指标及其可信区间,用于评价因素间的相加交互作用,为研究人员分析生物学交互作用提供依据。
该方法方便快捷,且Excel计算表可在线免费下载。
【关键词】logistic回归模型;相加交互作用指标;女性肺癌StudyontheinteractionunderlogisticregressionmodelingOtuHong,Ignatius%奄一SUTIyU,WANGXiao-rong,FUZhen—ming,ShellyLapAhTSE.DepartmentofCommunityandFamilyMedicine,SchoolofPublicHealth。
ChineseUniversityofHongKong,H.K.S.A.RCorrespondingauthor:Ignatius死^一SUnyU,Email:iyu@cuhk.edu.hk【Introduction】whenstudyonepidemiologicalcausationiscarriedout,logisticregressionhasbeencommonlyusedtoestimatetheindependenteffectsofriskfactors.舾wellastoexaminepossibleinteractionsamongindividualriskfactorbyaddingoneormoreproducttermstotheregressionmodel.InlogisticorCox‟Sregressionmodel.theregressioncoefficientoftheproducttermestimatestheinteractiononamultiplicativescalewhilestatisticalsignificanceindicatesthedeparturefrommultiplicativity.Rothmanarguesthatwhenbiologicinteractionisexamined,weneedtofocusoninteractionasdeparturefromadditivityratherthandeparturefrommultiplicativity.Hepresentsthreeindicestomeasureinteractiononanadditivescaleordeparturefromadditivity。


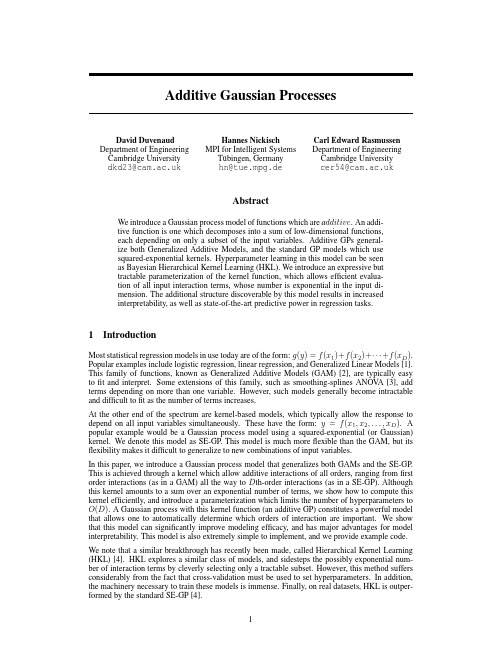
Agricultural Sciences in China 2009, 8(9): 1039-1045September 2009© 2009, CAAS. All rights reserved. Published by Elsevier Ltd.Detection of QTLs with Additive Effects, Epistatic Effects, and QTL ×Environment Interactions for Zeleny Sedimentation Value Using a Doubled Haploid Population in Cultivated WheatZHAO Liang, LIU Bin, ZHANG Kun-pu, TIAN Ji-chun and DENG Zhi-yingState Key Laboratory of Crop Biology, Group of Quality Wheat Breeding, Shandong Agricultural University, Tai’an 271018, P.R.ChinaAbstractIn order to understand the genetic basis for Zeleny sedimentation value (ZSV) of wheat, a doubled haploid (DH) population Huapei 3×Yumai 57 (Yumai 57 is superior to Huapei 3 for ZSV), and a linkage map consisting of 323 marker loci were used to search QTLs for ZSV. This program was based on mixed linear models and allowed simultaneous mapping of additive effect QTLs, epistatic QTLs, and QTL×environment interactions (QEs). The DH population and the parents were evaluated for ZSV in three field trials. Mapping analysis produced a total of 8 QTLs and 2 QEs for ZSV with a single QTL explaining 0.64-14.39% of phenotypic variations. Four additive QTLs, 4 pairs of epistatic QTLs, and two QEs collectively explained 46.11% of the phenotypic variation (PVE). This study provided a precise location of ZSV gene within the Xwmc 93 and GluD1 interval, which was designated as Qzsv-1D. The information obtained in this study should be useful for manipulating the QTLs for ZSV by marker assisted selection (MAS) in wheat breeding programs.Key words: doubled haploid population, Zeleny sedimentation value, quantitative trait loci (QTLs), wheat (Triticum aestivum L.)INTRODUCTIONThe Zeleny sedimentation value (ZSV) has been provento be useful in wheat breeding programs for the esti-mation of wheat eating and cooking quality (Mesdag1964; Kne et al. 1993; Liu et al. 2003; He et al.2004; Zhang et al. 2005; Özberk et al. 2006; Ozturket al. 2008). There is a positive correlation betweensedimentation volume and gluten strength or loaf volume.The ZSV method is often used as a screening test inwheat breeding. Mesdag (1964) showed that the valueof ZSV is a measure for the quantity and quality of thegluten. Because the baking value of wheat flour is largelydetermined by these components, the ZSV is also con-sidered as a useful predictor for the baking value. LiuReceived 3 December, 2008 Accepted 9 April, 2009Correspondence TIAN Ji-chun, Professor, Tel/Fax: +86-538-8242040, E-mail: jctian9666@et al. (2003) detected that the associations betweenZSV and DWCN’s (dry white Chinese noodle) appear-ance and taste also fit quadratic regression modelsignificantly. The gluten quality-related parameter ofsedimentation value was significantly associated withpan bread quality score (He et al. 2004). Özberk et al.(2006) found that the only quality analyses showingsignificant correlations with market price were Zelenysedimentation value and hectolitre weights (kg hL-1).Ozturk et al. (2008) reported that the cookie diametergave highly significant correlations with ZSV.The advent and utilization of molecular markers hasprovided powerful tools for elucidating the genetic ba-sis of quantitatively inherited traits. However, only afew studies have reported genetic loci that influenceZSV in wheat (Rousset et al. 2001; Kunert et al. 2007;1040ZHAO Liang et al.Sun et al. 2008). Rousset et al. (2001) reported that one strong QTL for ZSV was mapped on the long arm of chromosome 1A around Glu-A1. A distally located QTL for ZSV was mapped on chromosome arm 1BS, centered on the Gli-B1/Glu-B3 region. And a major QTL for ZSV, clearly corresponding to the Glu-D1 locus, was detected on chromosome arm 1DL. Kunert et al. (2007) found four putative QTLs for ZSV. Sun et al. (2008) identified three QTLs for ZSV in a F14 RIL derived from the cross between Chuan 35050 and Shannong 483.Additive effect QTLs were first identified and epi-static interactions among these additive effect QTLs were then estimated (Zanetti et al. 2001). However, this approach usually leaves out many QTLs that may have no additive effects but influence the trait only through epistatic interactions or QTL×environment in-teractions (QEs) (Ma et al. 2005, 2007; Rebetzke et al. 2007). Additive effect QTLs, epistatic QTLs, and QEs were detected using two-locus analyses in both the populations (Kulwal et al. 2005). Sometimes QTLs involved in such interactions contribute substantially to the total variation of a quantitative trait, and therefore should not be ignored. Further experimentation is needed to clarify whether the traits are also affected by epistatic and environment, and to dissect the genotype ×environment interaction effects at the molecular level. In this study, QTLs for ZSV were investigated based on the mixed linear model in a DH population across environments. The objective of this study was to com-prehensively characterize the genetic basis for ZSV of wheat in order to facilitate the future breeding of high-quality wheat varieties.MATERIALS AND METHODSMaterialsA population of 168 DH lines was produced from the cross between two Chinese wheat cultivars Huapei 3 (Hp3)/Yumai 57 (Ym57) and was used for the con-struction of a linkage map. The DH population and parents were kindly provided by Professor Yanhai, Henan Academy of Agricultural Sciences, Zhengzhou, China. Hp3 and Ym57 were registered by Henan Prov-ince of China in 2006 (Hai and Kang 2007) and by the state (China) in 2003 (Guo et al. 2004), respectively. The parents, planted over a large area in the Huang-Huai wheat region in China, differ in several agronomi-cally important traits as well as baking quality traits (Guo et al. 2004; Hai and Kang 2007).The field trials were conducted in three environments, at Tai’an (36.18°N, 117.13°E), Shandong Province, China, in 2005 and 2006, and at Suzhou (31.32°N, 120.62°E), Anhui Province, China, in 2006. The ex-perimental design followed a completely randomized block design with two replications at each location. In autumn 2005, all lines and parental lines were grown in 2 m long by three-row plots (25 cm apart); in autumn 2006, the lines were grown in 2 m long by four-row plots (25 cm apart). Suzhou and Tai’an differ in cli-mate and soil conditions. In Tai’an, there were differ-ences in temperature and soil conditions between the years 2005 and 2006. During the growing season, man-agement was in accordance with the local practice. The lines were harvested individually at maturity to prevent yield loss from over-ripening. Harvested grain samples were cleaned prior to conditioning and flour milling was performed in a mill (Quadrumat Senior, Brabender, Germany) to flour extraction rates of around 70%. Prior to milling, the hard, medium hard (mixtures of hard and soft wheat) and soft wheats were tempered to around 14, 15, and 16% moisture contents, respectively.Measurements of ZSVZeleny sedimentation volume was determined using AACC method 56-61A.Construction of the genetic linkage mapA genetic linkage map of DH population with 323 markers, including 284 SSR, 37 ESTs loci, 1 ISSR loci and 1 HMW-GS loci, was constructed. This linkage map covered a total length of 2485.7 cM with an aver-age distance of 7.67 cM between adjacent markers. Thirteen markers remained unlinked. These markers formed 24 linkage groups at LOD 4.0. The chromo-somal locations and the orders of the markers in the map were in accordance with the one reported for Triti-cum aestivum L. (Somers et al. 2004). The recom-mended map distance for genome wide QTL scanningDetection of QTLs with Additive Effects, Epistatic Effects, and QTL×Environment Interactions for Zeleny Sedimentation1041 was an interval length less than 10 cM (Doerge 2002).Thus the map was suitable for genome-wide QTL scan-ning in this study.Statistical analysisAnalysis of variance (ANOVA) was carried out usingSPSS ver. 13.0 (SPSS, Chicago, USA). QTLs withadditive effects and epistatic effects as well as QEs inthe DH population were mapped by the softwareQTLNetwork ver. 2.0 (Yang and Zhu 2005) based on amixed linear model (Wang et al. 1999). Composite in-terval analysis was undertaken using forward-backwardstepwise multiple linear regression with a probabilityinto and out of the model of 0.05 and window size setat 10 cM. Significant thresholds for QTL detectionwere calculated for each data set using 1000 permuta-tions and a genome-wide error rate of 0.10 (suggestive)and 0.05 (significant). The final genetic model incor-porated significant additive effects and epistatic effectsas well as their environmental interactions.RESULTSPhenotypic variation for DH lines and parentsAs is shown in Fig.1, ZSV of Ym57 showed highervalues than ZSV of Hp3; the means of the ZSV fellbetween the two parent’s values. It expressed the ex-istence of the large transgressive segregation. ZSV seg-regated continuously and approximately fit normal dis-tributions with absolute values of both skewness andkurtosis less than 1.0, indicating that this trait was suit-able for QTL mapping.QTLs with additive effects and additive×environment (AE) interactionsFour QTLs with significant additive effects were iden-tified on chromosomes 1B, 1D, 5A, and 5D (Table 1and Fig.2). These QTLs explained from 2.66 to14.39% of the phenotypic variance. The Qzsv-1B had the most significant effect, accounting for 14.39% of the phenotypic variance. The Ym57 alleles at three loci, Qzsv-1B,Qzsv-1D, and Qzsv-5D, increased Fig. 1 Frequency distributions of ZSV in 168 DH lines derived from a cross of Hp3×Ym57 evaluated at three environments in the 2005 and 2006 cropping seasons. The means of trait values for the DH lines and both parents are indicated by arrows. Several statistics for the traits in the DH lines are shown on the right of each plot.Zeleny sedimentation volume (mL)2006 in SuzhouZeleny sedimentation volume (mL)2006 in Tai’anZeleny sedimentation volume (mL)2005 in Tai’anMean: 24.39SD: 5.45Range: 12.00-39.00Skewness: 0.171Kurtosis: -0.153 252015105No.ofDHlinesDH linesYm57Hp315.0020.0025.0030.0035.0040.00DH linesYm57Hp320.0030.0040.0050.0060.00252015105No.ofDHlines30DH linesYm57Hp320.0030.0040.002015105No.ofDHlinesMean: 24.39SD: 5.45Range: 12.00-39.00Skewness: 0.171Kurtosis: -0.153Mean: 24.39SD: 5.45Range: 12.00-39.00Skewness: 0.171Kurtosis: -0.1531042ZHAO Liang et al.Table 1 Estimated additive effects and additive ×environment (AE) interactions of QTLs for ZSV at three environments in the 2005 and 2006 cropping seasonsQTL Flanking-marker 1)Position (cM)2)F -value P A 3)H 2 (A, %)4)AE 1H 2 (AE 1, %)5)AE 2H 2 (AE 2, %)AE 3H 2 (AE 3, %)Qzsv -1B Xwmc412.2-Xcfe023.236.425.220.000-2.5214.39------Qzsv -1D Xwmc93-GluD161.915.910.000-1.988.93------Qzsv -5A Xbarc358.2-Xgwm18638.18.100.000 1.08 2.66------Qzsv -5DXcfd101-Xbarc32060.612.690.000-1.203.25---1.042.44--1)Flanking marker, the interval of F peak value for QTL. The same as below.2)Position, the location of F peak value for QTL in “Flanking marker”. The same as below.3)Additive effects, a positive value indicates that the allele from Hp3 increased ZSV, a negative value indicates that the allele from Ym57 increased ZSV.4)H 2(A, %) indicates the contribution explained by putative additive QTL.5)H 2(AE 1, %) indicates the contribution explained by additive QTL ×environment 1 interaction. E 1, Tai’an 2005; E 2, Tai’an 2006; E 3, Suzhou 2006.Fig. 2 A genetic linkage map of wheat showing mapping QTLs with additive effects, epistatic effects, AE, and AAE for ZSV.1A 1B 1D 2A 3A5A 5D 7A 7DLocus involved in AELocus involved in additive effects Locus involved in epistasisLocus involved in AAEDetection of QTLs with Additive Effects, Epistatic Effects, and QTL ×Environment Interactions for Zeleny Sedimentation 1043ZSV by 2.52, 1.98, and 1.20 mL, respectively, owing to additive effects. The Hp3 allele increased ZSV at the Qzsv -5A by 1.08 mL, accounting for 2.66% of the phe-notypic variance. This suggested that alleles, which increased ZSV, were dispersed within the two parents,resulting in small differences of phenotypic values be-tween the parents and transgressive segregants among the DH population. The total additive QTLs detected for ZSV accounted for 29.23% of the phenotypic variance.One additive effect was involved in AE interactions (Table 1 and Fig.2). The Ym57 alleles at one locus,Qzsv -5D , increased the ZSV by 1.04 mL with corre-spondingly contributing 2.44% of the phenotypic variance.QTLs with epistasis effects and epistasis ×environment (AAE) interactionsFour pairs of epistatic QTLs were identified for ZSV,and were located on chromosomes 1A, 2A, 3A, 7A and 7D (Table 2 and Fig.2). These QTLs had correspond-ing contributions ranging from 0.64 to 6.79%. One pair of epistasis, occurring between the loci Qzsv -2A /Qzsv -7A , had the largest effect, which contributed ZSV of 1.73 mL and accounted for 6.79% of the phenotypic variance. The four pairs of epistatic QTLs explained 12.11% of the phenotypic variance. All the epistatic effects were non-main-effect QTLs.One pair of epistatic QTL was detected in AAE in-teractions for ZSV (Table 2 and Fig.2). The AAE ef-fects explained 2.33% of the phenotypic variance and this QTL, Qzsv3A.2/Qzsv7D.1, increased ZSV by 1.01mL owing to AAE effects, simultaneously the positive value means that the parent-type effect is greater than the recombinant-type effect.DISCUSSIONEpistatic effects and QTL ×environment interactions were important genetic basis for ZSV in wheatEpistasis, as an important genetic basis for complex traits, has been well demonstrated in recent QTL map-ping studies (Cao et al . 2001; Fan et al . 2005; Ma et al .2005, 2007). Ma et al . (2005) provided a strong evi-dence for the presence of epistatic effects on dough rheological properties in a wheat DH population. In the present study, four pairs of QTLs with epistatic ef-fects were detected for ZSV in three environments (Table 2 and Fig.2). The four pairs of epistatic QTLs explained 12.11% of the phenotypic variance.ZSV was predominantly influenced by the effects of genotype (Zhang et al . 2004, 2005), and in the present study, only one AE interaction and one AAE interaction were found. It is suggested that QTL ×environment interactions just play a minor role, but QTL ×environment interactions should not be ignored.ZSV and subunits of high molecular weight gluteninsSubunits of high molecular weight glutenins strongly influence wheat bread making quality. This study pro-vided a precise location of ZSV gene within the Xwmc 93 and GluD1 interval, which was designated Qzsv -1D and was located in the central region of a 2 cM interval.Also Rousset et al . (2001) detected a major QTL for sedimentation volume on 1DL, clearly corresponding to the Glu -D1 locus. Kunert et al . (2007) found that the SSR marker Xgwm642 on 1DL identified a QTLTable 2 Estimated epistatic effects and epistasis ×environment (AAE) interactions of QTLs for ZSV at three environments in the 2005 and 2006 cropping seasonsPosition Position H 2H 2H 2H 2(cM)(cM)(AA, %)2)(AAE 1, %)3)(AAE 2, %)(AAE 3, %)Qzsv -1A Xwmc278-Xbarc120.156.3Qzsv -3A.1Xbarc1177-Xbarc276.2196.3-0.94 1.99------Qzsv -2A Xgwm636-Xcfe6729.1Qzsv -7A Xbarc259-Xwmc59653.7-1.73 6.79------Qzsv -3A.2Xcfa2193-Xgwm155152.7Qzsv -7D.1Xcfd175-Xwmc14181.5-1.09 2.69 1.01 2.33----Qzsv -3A.2Xcfa2193-Xgwm155152.7Qzsv -7D.2Xgdm67-Xwmc634161.5-0.530.64------1)The epistatic effect. A positive value means that the parent-type effect is greater than the recombinant-type effect, and the negative value means that the parent-type effect is less than the recombinant-type effect.2)H 2 (AA, %) indicates the contribution explained by putative epistatic QTL.3)H 2 (AAE 1, %) indicates the contribution explained by epistatic QTL ×environment 1 interaction. E 1, Tai’an 2005; E 2, Tai’an 2006; E 3, Suzhou 2006.QTL Flanking-marker QTL Flanking-markerAA 1)AAE 1AAE 2AAE 31044ZHAO Liang et al. for ZSV. The position indicates an influence of theGlu-D1 locus. And a major QTL, clearly correspond-ing to the Glu-D1 locus, was detected on chromosomearm 1DL. Correlation coefficient between Glu-1 scoreand sedimentation values was significant (r=0.553).There were significant correlations between sedimen-tation values and Glu-lAa,Glu-1Ac,Glu-Ba, and Glu-1Bcalleles, respectively (Kne et al. 1993). Thesedimentation values showed statistically significantassociations with the status of the Glu-A1 locus(Witkowski et al. 2008).In this study, the Qzsv-1D increased ZSV by 1.98mL, correspondingly contributing 8.93% of the pheno-typic variance. Barro et al. (2003) found that HMW-GS 1Ax1 increased the sedimentation value. In contrast,HMW-GS 1Dx5 drastically decreased in sedimentationvalue.In summary, four additive QTLs, four pairs of epi-static QTLs, and two QEs were detected for ZSV in168 DH lines derived from a cross Hp3×Ym57. Onemajor QTL,Qzsv-1B, was closely linked to Xwmc412.20.2cM and could account for 14.39% of the phenotypicvariation without any influence from the environment.Therefore, the Qzsv-1B could be used in MAS in wheatbreeding programs. The results showed that both ad-ditive and epistatic effects were important as a geneticbasis for ZSV, and were also sometimes subject to en-vironmental modifications.AcknowledgementsThis work was supported by the National Basic Re-search Program of China (2009CB118301), the NationalHigh-Tech Research and Development (863) Programof China (2006AA100101 and 2006AA10Z1E9), andthe Doctor Foundation of Shandong AgriculturalUniversity, China (23023). Thanks Prof. Chuck Walker,University of Kansas State University, USA, for hiskindly constructive advice on the language editing ofthe manuscript.ReferencesBarro F, Barceló P, Lazzeri P A, Shewry P R, Ballesteros J,Martín A. 2003. Functional properties of flours from fieldgrown transgenic wheat lines expressing the HMW gluteninsubunit 1Ax1 and 1Dx5 genes. Molecular Breeding,12,223-229.Cao G, Zhu J, He C, Gao Y, Yan J, Wu P. 2001. Impact ofepistasis and QTL×environment interaction on thedevelopmental behavior of plant height in rice (Oryza sativaL.). Theoretical and Applied Genetics,103, 153-160.Doerge R W. 2002. Multifactorial genetics: Mapping and analysisof quantitative trait loci in experimental populations. NatureReviews,3, 43-52.Fan C C, Yu X Q, Xing Y Z, Xu C G, Luo L J, Zhang Q F. 2005.The main effects, epistatic effects and environmentalinteractions of QTLs on the cooking and eating quality ofrice in a doubled-haploid line population. Theoretical andApplied Genetics,110, 1445-1452.Guo C Q, Bai Z A, Liao P A, Jin W K. 2004. New high qualityand yield wheat variety Yumai 57. China Seed Industry,4, 54(in Chinese)Hai Y, Kang M H. 2007. Breeding of a new wheat vatiety Huapei 3with high yield and early maturing. Henan AgriculturalSciences, 5, 36-37. (in Chinese)He Z H, Yang J, Zhang Y, Quail K J, Peña R J. 2004. Pan breadand dry white Chinese noodle quality in Chinese winterwheats.Euphytica,139, 257-267.,G, D. 1993. Allelic variationat Glu-1 loci in some Yugoslav wheat cultivars. Euphytica,69,89-94.Kulwal P, Kumar N, Kumar A, Balyan H S, Gupta P K. 2005.Gene networks in hexaploid wheat: interacting quantitativetrait loci for grain protein content. Functional & IntegrativeGenomics,5, 254-259.Kunert A, Naz A A, Oliver D, Pillen K, Léon J. 2007. AB-QTLanalysis in winter wheat: I. Synthetic hexaploid wheat(T.turgidum ssp. dicoccoides × T. tauschii) as a source offavourable alleles for milling and baking quality traits.Theoretical and Applied Genetics,115, 683-695.Liu J J, He Z H, Zhao Z D, Peña R J, Rajaram S. 2003. Wheatquality traits and quality parameters of cooked dry whiteChinese noodles. Euphytica,131, 147-154.Ma W, Appels R, Bekes F, Larroque O, Morell M K, Gale K R.2005. Genetic characterisation of dough rheological propertiesin a wheat doubled haploid population: additive genetic effectsand epistatic interactions. Theoretical and Applied Genetics,111, 410-422.Ma X Q, Tang J H, Teng W T, Yan J B, Meng Y J, Li J S. 2007.Epistatic interaction is an important genetic basis of grainyield and its components in maize. Molecular Breeding,20,41-51.Mesdag J. 1964. in the protein content of wheat and its influenceon the sedimentation value and the baking quality. Euphytica,13, 250-261.Özberk I, Kýlýç H, Atlý A, Özberk F, Karlý B. 2006. Selectionof wheat based on economic returns per unit area. Euphytica,Detection of QTLs with Additive Effects, Epistatic Effects, and QTL×Environment Interactions for Zeleny Sedimentation1045152, 235-245.Ozturk S, Kahraman K, Tiftik B, Koksel H. 2008. Predicting the cookie quality of flours by using Mixolab. European Food Research and Technology,227, 1549-1554.Rebetzke G J, Ellis M H, Bonnett D G, Richards R A. 2007.Molecular mapping of genes for Coleoptile growth in bread wheat (Triticum aestivum L.). Theoretical and Applied Genetics,114, 1173-1183.Rousset M, Brabant P, Kota R S, Dubcovsky J, Dvorak J. 2001.Use of recombinant substitution lines for gene mapping and QTL analysis of bread making quality in wheat. Euphytica, 119,81-87.Somers D J, Isaac P, Edwards K. 2004. A high-density microsatellite consensus map for bread wheat (Triticum aestivum L.). Theoretical and Applied Genetics,109, 1105-1114.Sun H Y, Lu J H, Fan Y D, Zhao Y, Kong F, Li R J, Wang H G, Li S S. 2008. Quantitative trait loci (QTLs) for quality traits related to protein and starch in wheat. Progress in Natural Science,18, 825-831.Wang D L, Zhu J, Li Z K, Paterson A H. 1999. Mapping QTLswith epistatic effects and QTL × environment interactions by mixed linear model approaches. Theoretical and Applied Genetics,99, 1255-1264.Witkowski E, Waga J, Witkowska K, Rapacz M, Gut M, Bielawska A, Luber H, Lukaszewski A J. 2008. Association between frost tolerance and the alleles of high molecular weight glutenin subunits present in Polish winter wheats. Euphytica, 159,377-384.Yang J, Zhu J. 2005. Methods for predicting superior genotypes in multiple environments based on QTL effects. Theoretical and Applied Genetics,110, 1268-1274.Zanetti S, Winzeler M, Feuillet C, Keller B, Messmer M. 2001.Genetic analysis of bread-making quality in wheat and spelt.Plant Breeding,120, 13-19.Zhang Y, He Z H, Guo Y Y, Zhang A M, Maarten V G.2004.Effect of environment and genotype on bread-making quality of spring-sown spring wheat cultivars in China. Euphytica, 139, 75-83.Zhang Y, Zhang Y, He Z H, Ye G Y. 2005. Milling quality and protein properties of autumn-sown Chinese wheats evaluated through multi-location trials. Euphytica,143,209-222.(Edited by ZHANG Yi-min)。
2015-2016学年第二学期《英语》期末试卷A班级:2015护理3-3 护理3-4 助产3-2一. 1.overspend 1.透支,超支2.alert2.警觉的, 警惕的3.envy, 3.羡慕,嫉妒4.expenditure4.支出,花费5.ingredient,5.因素,成分6.attribute6.,属性,品质7.split,7.裂开,劈开8.mould,8.霉变9.substance,9.物质10.exposure,10.暴露11.moisture,11.湿度,潮湿grind,研磨,磨碎scandal,丑闻,耻辱contaminate,污染infant,婴儿protein,蛋白质flavor风味,滋味additive添加剂contingency偶然、可能发生的事件,意外事故;应急开支arise出现,发生advisable值得推荐的,明智的,可取的flow,流程,流动specify,确定,制定,详细说明poverty贫穷,贫乏equivalent等价的,相等的mobility,灵活性depletion,消耗,损耗interaction, 交流,交往;互动infrastructure, 基础设施基础结构distribution,分布,分配controversy, 争论;辩论;争议Sweeping,影响大的;彻底的;广泛的interaction, 交流,交往;互动infrastructure, 基础设施.基础结构distribution,分布,分配controversy, 争论;辩论;争议mass-produced,大批生产的,revolution,革命,mobility,灵活性depletion,消耗,损耗,non-renewable, (能源)不可再生的isolation,孤立,隔离obesity,肥大,urban,城市的,市内的,expansion,扩张,膨胀manufacturing,制造业priority,优先考虑的事widening加宽,扩展impact,冲击,影响habitat, (植物的)生长地,产地;(动物的)栖息地ecosystem,生态系统incorporate, 把(某物)并入,包含;吸收intensive, 加强的;集中的assemble,组装,装配prediction,预言,预报manufacturer,制造商,厂商plant,工厂,车间typical,典型的chassis,车辆的底盘install,安装component,零件,组成部分underbody,底部brake,制动器,刹车weld,焊接framework,框架,结构coveralls,工作服hairnet,发网,发罩protective,保护的interior,内部的,里面的instrument,仪表,器械windshield,挡风玻璃pedal,踏板proceed,继续进行,行进gasoline,汽油A2课volunteer义务工作者,志愿者immigrant移民,侨民poverty贫穷,贫乏equivalent等价的,相等的diploma文凭;毕业证书,学位证书handle处理landlord房东,地主preschool学前的surround,围绕,包围bunch束,串,捆count 计数focus集中(注意力);使集中,使聚焦brand-new全新的,崭新的grant补助金,(政府、机构的) 拨款donate捐赠,赠送individual个人,个体pronounce发音,宣告philosophy哲学, 理念kindergarten幼儿园practically几乎,简直,实际上B2课category,种类,类别vary,变化,使多样化neighborhood,附近,临近deliver,送递,交付brighten,使明亮,使活跃appropriate,合适的,恰当的agency,机构,代理disabled,残疾的assistant,助手,助理buddy,密友,伙伴anti-,反对,抵抗campaign,活动,运动awareness,觉悟,意识talent,才能,天才assembly,集会,集合band,乐队coach,教练,指导shelter,避难所,庇护所A3课finance,金融management,管理,经营fundamental基本的financial金融的,财政的expenditure支出,花费worthwhile值得做的revealing有启发作用的,揭示的up-to-date最新的,现代的,新式的flow,流程,流动fund, 资金,基金transaction交易specify,确定,制定,详细说明regular定期的,规则的,正常contingency偶然、可能发生的事件,意外事故;应急开支arise出现,发生unexpectedly意外地,出乎意料地advisable 值得推荐的,明智的,可取的savings. 存款motivate激励,激发assess评估,衡量accurate,正确的,精确的B3课virtual,虚拟的consumer,消费者criminal,罪犯alike,相同的issue,问题security,安全ensure,确保,保证legitimate,合法的,合理的encryption,加密,编密码password,密码,口令combination,组合,结合false,错误的,假的credible,可靠的,可信的trick,欺骗,欺诈favorites,收藏夹virtually,事实上,几乎guarantee保证,保护A4课processing加工,处理miller磨坊主pursuit追求,追赶productivity生产率,生产力flavor风味,滋味additive添加剂potentially,潜在地chemical化学物质protein,蛋白质allergy,过敏immune免疫的dairy,奶制品soybean大豆peel果皮bakery面包店watery,稀薄的scandal,丑闻,耻辱contaminate,污染infant,婴儿remake,重做,再做reformulate修订,重新准备,重新制定solid, 固体,结实的liquid,液体uniform统一的,一致的remaining,剩余的butterfat,乳脂consequence后果,结果abandon放弃,遗弃deficient缺乏的,不足的infertile不结果实的,不能生育的B4课specification,说明书,规格sauce,沙司,酱曝光extreme,极端moisture,湿度,潮湿variation,变异,变化ongoing,不间断地,正在进行的pasteurize,巴斯消毒法消毒texture,质地,结构assistance,援助,帮助criteria,标准inspection,视察,检查certification,证明,检定approval,批准,赞成statistical,统计的,统计学sampling,取样,抽样packaging,包装label,贴标签A.overspend透支,超支alert警觉的, 警惕的envy, 羡慕,嫉妒expenditure支出,花费ingredient,因素,成分attribute,属性,品质split,裂开,劈开mould,霉变substance,物质exposure,暴露moisture,湿度,潮湿grind,研磨,磨碎scandal,丑闻,耻辱contaminate,污染infant,婴儿protein,蛋白质flavor风味,滋味additive添加剂contingency偶然、可能发生的事件,意外事故;应急开支arise出现,发生advisable值得推荐的,明智的,可取的flow,流程,流动specify,确定,制定,详细说明poverty贫穷,贫乏equivalent等价的,相等的mobility,灵活性depletion,消耗,损耗interaction, 交流,交往;互动infrastructure, 基础设施基础结构distribution,分布,分配controversy, 争论;辩论;争议二.选择C. For the mothers1.earn higher diplomas2.learn life skills,,For the children1.improve English reading ability 2. prepare for future studyVocabulary A. Choose the correct form of the words to complete the following sentences1. importance, important, importantly,a. It’s to find out what he is doing.b. We should make sure everyone is aware of the of this meeting.2. demonstrate, demonstrative, demonstration,a. His new book is a of his patriotisim.b. our computers are of a high quality, Now we can them.1. ( )Thinking is necessary. a. correct b.correctly c.correction2. ( )Canada has many from Europe. a. immigrates b. immigrants c. immigrations3. ( )Could you please give me some on how to learn English well? a. advice b.advise c.advisable4. ( )During the meeting, my computer went dead. a. expect b. expected c. unexpectedly5. ( )In , competitive forces are dynamic and changing all the time. a. essence b.essential c.essentially6. ( )I would hesitate to this long walking tour. a. be promoted b. get involved in c. get through7. ( ) She is the student who best in the class. a. volunteers b. focus c. pronouncesb. It is for you to keep it secret. 1.b 2.b 3.a 4.c. 5.a4. immigrate, immigrant, immigration,a. The American government is very particular about who is allowed there.b. Canada has many from Europe.5. success, successful, successfully,a. congratulation on your in the match. You played so well! B. Many women can balance their marriage and career.4. a. to immigrate b. immigrants5. a. success b. successfullyB.Match the words in column A with the appropriate word and phrases in column BA B1. purchase a. the number of people2.count b. a living3. focus on c. some books4. demonstrate d. your study5. earn e. the whole procedure 1. c 2. a 3. d. 4. e. 5. bC. complete the sentences below with the correct form of the words and phrases in the boxdonate pronounce practically volunteerget involved in assistant a bunch of essential1. I would hesitate to this long walking tour.2. You are going to be promoted as the to a manager.3. They bought Prof. Wang flowers on Teacher’s Day.4. Food is for life.5. He a large sum of money to the Red Cross last year.6. She is the student who best in the class.7. She’s always late for school. 8. The school needs some to help children to read.1. get involved in2. assistant3. a bunch of4. essential5. donated6. focus7. practically8. volunteersStructure A. Rearrange the words and phrases into correct sentences.1. thanks to, were able to, successfully, we, your, the disaster, get through, donation,1. Thanks to your donation, we were able to get through the disaster successfully.2. thanks to, now, focus on, my wife, can, I, my research, 2. Thanks to my wife, I can focus on my research now.3. thanks to, recovered, the illness, she, from, the doctor, quickly,3.Thanks to the doctor, she quickly recovered from the illness.4. thanks to, it’s, to, clear, your explanation, me, now, 4. Thanks to your explanation, it’s clear to me now.5. thanks to, finally, I, passed, the, exam, difficult, my teacher, 5. Thanks to my teacher, I finally passed the difficult exam.B. compose sentences using the words and phrases in the brackets1. a. nothing, than, health, is, more important, a. Nothing is more important than health.b. nothing, than, that of today, more fashionable, seems, b. Nothing seems more fashionable than that of today.c. nothing, than, war, worse, is, c. Nothing is worse than war.2. a. besides, also, Mandarin, she, English, speaks, a. Besides English, she also speaks Mandarin.b. besides, also, we, delicious food, have, other, the turkey, b. Besides the turkey, we also have other delicious food.c. besides, also, goes swimming, he, playing football, every week,c. Besides playing football, he also goes swimming every weekTranslation A. translating the following sentences into Chinese.1. She also makes every effort to train the kids to sit quietly, to follow a story, and to focus.1. 她还尽一切努力训练这些孩子们安静地坐着,认真听故事,集中注意力。
如何实现英语课堂深层互动作者:娄立国叶晓芳来源:《消费导刊·理论版》2008年第23期[摘要]课堂互动是每一位英语教师都十分关注的课题之一。
本文讨论了两个层次的英语课堂互动,即表层互动和深层互动,分析了深层互动的要求以及无法实现深层互动的原因,并在结论部分点明了深层互动的实质。
[关键词]英语课堂深层互动质量形式本文所讨论的互动主要指英语阅读课中的互动与传统外语教学方法相比,现代外语教学强调课堂以学生为中心,而课堂互动则是以学生为中心的外语课堂的关键因素之一。
尽管我们深谙课堂互动的重要意义,我们对“互动”的真正涵义并未给予足够的注意,对真正互动(深层互动)的要领把握不准。
一、两种层次的外语课堂互动我们可以将外语课堂互动活动分为两个层次:浅层互动(surface level interaction)和深层互动(in-depth interaction)。
浅层互动是指仅仅满足于让学生参与课堂任务而没有沉默不语的互动,其主要特征是学生“Yes/No”式的简短回答和教师“Ok/That’s right”式的机械式评价。
深层互动意味着内心感受或反思在两颗心灵之间的交流,一般而言,它以就相关话题或问题而展开的不停的追问和激烈的争论为特征。
深层互动对于提升教师和学生的表达能力以及增强自信心具有十分重要的意义,如果师生的互动总是停留在表层互动水平上,必将导致学生学习兴趣和信心的丧失,师生关系也会疏远。
只有深层互动才能实现教学相长。
这样的互动通常会激发讲话者将一个观点或其立场阐述得更清楚、更有力的欲望,从而会激发一个人的创造性思维。
二、无法实现深层互动的两种情形2007年上半年,笔者观摩了 16位教师的大学英语课,由于每位教师都精心备课,这16节公开课各具特色,精彩纷呈,同时也有这样或那样的不足。
其中有一条不足之处是大部分教师所共有的,即只实现了表层互动,满足于让学生站起来回答一些“Yes/No”式的简短回答问题,或让学生说出事先已经背诵下来的答案,然后给予学生一些最简单的反馈。
·4061··论著·倒班与不良生活方式的交互作用对钢铁工人高胆固醇血症的影响研究薛超,李庆林,王涵,张生奎,秦盛,袁聚祥*【摘要】 背景 我国成人血脂异常患病率不断提高,血清总胆固醇升高是动脉粥样硬化性心血管疾病的重要危险因素。
同时,我国倒班工人数量逐渐增加,目前对于倒班与血脂异常关系的研究结果并不相同,并且也较少有研究探讨倒班、不良生活方式与人群高胆固醇血症的关系。
目的 探究倒班及不良生活方式对钢铁工人高胆固醇血症的联合作用。
方法 采用整群抽样选择某钢厂2017年职业体检的员工,采用自行设计的《健康评估调查表》收集个人基本信息(性别、年龄、身高、体质量、家族史等)、倒班情况(倒班时间、倒班开始年龄等)、个人生活方式(饮食、体力活动、吸烟、饮酒等 );采用限制性立方样条(RCS)模型分析倒班年限与高胆固醇血症的剂量-反应关系;根据RCS 结果,对倒班年限进行分组,使用多因素Logistic 回归模型分析倒班和不良生活方式与高胆固醇血症的关系。
通过计算超额相对危险度(RERI )、交互作用归因比(AP )来评价倒班与不良生活方式的相加交互作用。
结果 根据RCS 结果分为0 年、>0~年、23.8~年 3组,以是否患有高胆固醇血症为因变量,采用Logistic 回归分析倒班与高胆固醇血症的关系,结果显示,在>0~年倒班年限中,倒班与高胆固醇血症呈正相关(P<0.05)。
吸烟、饮酒、BMI 均与高胆固醇血症呈正相关(P<0.05)。
体力活动与DASH 饮食评分在调整年龄、性别、高血压、糖尿病、家族史等变量后与高胆固醇血症无明显相关性(P>0.05)。
当综合考虑时,不良生活方式评分3分及以上组合的工人患高胆固醇血症是不良生活方式评分1分及以下工人的1.703倍。
倒班年限在23.8年内且不良生活方式评分3分及以上的工人发生高胆固醇血症的危险是从不倒班、不良生活方式评分1分及以下工人的2.527倍。
METHODSEstimating measures of interaction on an additive scale for preventive exposuresMirjam J.Knol •Tyler J.VanderWeele •Rolf H.H.Groenwold •Olaf H.Klungel •Maroeska M.Rovers •Diederick E.GrobbeeReceived:30July 2010/Accepted:4February 2011/Published online:23February 2011ÓThe Author(s)2011.This article is published with open access at Abstract Measures of interaction on an additive scale (relative excess risk due to interaction [RERI],attributable proportion [AP],synergy index [S]),were developed for risk factors rather than preventive factors.It has been suggested that preventive factors should be recoded to risk factors before calculating these measures.We aimed to show that these measures are problematic with preventive factors prior to recoding,and to clarify the recoding method to be used to circumvent these problems.Recoding of preventive factors should be done such that the stratum with the lowest risk becomes the reference category when both factors are considered jointly (rather than one at a time).We used data from a case-control study on the interaction between ACE inhibitors and the ACE gene on incident e of ACE inhibitors was a preventive factor and DD ACE genotype was a risk factor.Before recoding,the RERI,AP and S showed inconsistent results (RERI =0.26[95%CI:-0.30;0.82],AP =0.30[95%CI:-0.28;0.88],S =0.35[95%CI:0.02;7.38]),with the first two measures suggesting positive interaction and the thirdnegative interaction.After recoding the use of ACE inhibitors,they showed consistent results (RERI =-0.37[95%CI:-1.23;0.49],AP =-0.29[95%CI:-0.98;0.40],S =0.43[95%CI:0.07; 2.60]),all indicating negative interaction.Preventive factors should not be used to cal-culate measures of interaction on an additive scale without recoding.Keywords Interaction ÁPreventive factors ÁRelative excess risk due to interaction ÁSynergy indexIntroductionInteraction refers to the situation where the effect of one exposure on a certain outcome is different across strata of another exposure.This means that if interaction between two exposures is present,these exposures are not inde-pendent in causing a certain outcome.A classical example is the interaction between smoking and asbestos on the risk of lung cancer [1].The presence and direction of interac-tion depends on the scale,e.g.additive or multiplicative,that is used.Interaction on an additive scale means that the combined effect of two exposures is larger (or smaller)than the sum of the individual effects of the two exposures,whereas interaction on a multiplicative scale means that the combined effect is larger (or smaller)than the product of the individual effects.A number of epidemiologists have argued that biologic interaction should be assessed on an additive scale rather than a multiplicative scale [1–6].Interaction on an additive scale can be calculated using relative risks and different measures quantifying this interaction have been described,such as the relative excess risk due to interaction (RERI),the proportion attributable to interaction (AP),and the synergy index (S)[7].ProvidedM.J.Knol (&)ÁR.H.H.Groenwold ÁM.M.Rovers ÁD.E.GrobbeeJulius Center for Health Sciences and Primary Care,University Medical Center Utrecht,PO Box 85500,3508GA Utrecht,The Netherlands e-mail:m.j.knol@umcutrecht.nlT.J.VanderWeeleDepartments of Epidemiology and Biostatistics,Harvard School of Public Health,Boston,MA,USA e-mail:tvanderw@O.H.KlungelDivision of Pharmacoepidemiology and Pharmacotherapy,Utrecht Institute for Pharmaceutical Sciences,Utrecht University,Utrecht,The NetherlandsEur J Epidemiol (2011)26:433–438DOI 10.1007/s10654-011-9554-9that the odds ratio approximates the relative risk,these measures can be used to assess interaction on an additive scale even with case-control data.Moreover,methods to calculate confidence intervals around these measures have been developed[8–10],and methods to quantify interaction on an additive scale in the case of continuous determinants have been presented[11].The measures quantifying interaction on an additive scale were developed to use with exposures that are risk factors rather than preventive factors.Risk factors meaning that the relative risk of the factor with the outcome is larger than1,and preventive factors meaning that the relative risk of the factor with the outcome is smaller than1.It is not commonly known that these measures should only be applied to risk factors(see for example[12–15]).Rothman proposed,in case of preventive factors,to choose the high-risk category of each exposure to be the exposed category [1].This method turns the preventive factor into a risk factor by considering absence of the preventive to be the cause.Empirical examples of this method,however,are lacking.Moreover,it is unclear from Rothman’s descrip-tion and similar description that have followed his[16] whether this recoding should be done one factor at a time or by selecting a reference category when both factors considered jointly.Our objectives were to show what happens if estimates of measures of interaction on an additive scale are calcu-lated with preventive factors instead of risk factors using an example dataset,and to clarify the method of recoding of preventive factors.MethodsExample datasetThe empirical dataset that we used for illustration com-prised a nested case-control study including205cases of incident diabetes and2,050controls[17].One of the aims of the study was to examine whether the ACE insertion/ deletion gene modified the effect of the use of ACE inhibitors on the risk of incident diabetes.For simplicity, we combined past and current use of ACE inhibitors. Homozygous for the deletion gene in the ACE gene will be referred to as the DD genotype of the ACE gene,and homozygous or heterozygous for the insertion gene of the ACE gene will be referred to as the II or ID genotype of the ACE gene.Measures of interaction on an additive scaleFor two dichotomous factors A and B:RR A?B?is the relative risk of disease if both factors A and B are present,RR A?B-is the relative risk of disease if factor A is present but factor B is absent,RR A-B?is the relative risk of disease if factor A is absent but factor B is present.1.Relative excess risk due to interaction(part of the totaleffect that is due to interaction):RERI¼RR AþBþÀRR AþBÀÀRR AÀBþþ1RERI=0means no interaction or exactly additivity; RERI[0means positive interaction or more than addi-tivity;RERI\0means negative interaction or less than additivity;RERI can go from-infinity to?infinity. 2.Proportion attributable to interaction(proportion of thecombined effect that is due to interaction):AP¼RERIRR AþBþAP=0means no interaction or exactly additivity;AP[0 means positive interaction or more than additivity;AP\0 means negative interaction or less than additivity;AP can go from-1to?1.3.Synergy index(ratio between combined effect andindividual effects):S¼RR AþBþÀ1RR AþBÀÀ1ðÞþRR AÀBþÀ1ðÞS=1means no interaction or exactly additivity;S[1 means positive interaction or more than additivity;S\1 means negative interaction or less than additivity;S can go from0to infinity.Method of recodingWe show in the‘‘Appendix’’that if the category with the lowest risk when both factors are considered together is selected as the reference category then all three measures of additive interaction will always agree.We also given a numerical example in the‘‘Appendix’’that shows that if decisions about recoding are made one factor at a time by selecting the category with the lowest risk as the reference group then the three measures of additive interaction may diverge and one may calculate a negative value of the synergy index.AnalysesFirst,we calculated the odds ratio of the use of ACE inhibitors on the risk of diabetes,and the odds ratio of the DD genotype of the ACE gene on the risk of diabetes. These odds ratios represent the effect of one of the expo-sures analyzed without conditioning on the other exposure. We refer to these effects as‘single effects’.Subsequently, we calculated joint effects of the use of ACE inhibitors and434M.J.Knol et al.the DD genotype of the ACE gene using one reference category.Second,we calculated the three measures of interaction on an additive scale(RERI,AP,and S)and their95% confidence intervals using the delta method[9],assuming that the odds ratios calculated in the example dataset approximated relative risks.We also calculated95%con-fidence intervals using the method described by Zou[18], which resulted in similar confidence intervals.Third,we recoded the variables in such a way that the stratum with the lowest risk,when both factors are con-sidered jointly,became the reference category.We calcu-lated the measures of additive interaction again and compared the results with the original results.Because we used the data for illustration purposes only, we did not take into account the matching of cases and controls,and we did not adjust for potential confounders. ResultsBefore recoding use of ACE inhibitors or DD genotypeof ACE geneTable1presents the effect of the use of ACE inhibitors on the risk of diabetes irrespective of the value of the ACE gene,and the effect of the DD genotype of the ACE gene on the risk of diabetes irrespective of the value of the use of ACE inhibitors.Furthermore,the joint effects of the use of ACE inhibitors and the DD genotype of the ACE gene using one reference category(no use of ACE inhibitors and II or ID genotype of the ACE gene)are e of ACE inhibitors was a preventive factor for diabetes (OR=0.76[95%CI:0.57–1.03]),while the DD genotype of the ACE gene was a small risk factor for diabetes (OR=1.03[95%CI:0.75–1.41]).However,when both factors were considered jointly,then in the absence of use of ACE inhibitors,the DD genotype of the ACE gene was a preventive factor for diabetes(OR=0.90[95%CI: 0.61–1.34]).The relative excess risk due to interaction on an additive scale is0.26(95%CI:-0.30;0.82),meaning that the combined effect is0.26more than the sum of the individual effects.One arrives at this0.26by calculating the differ-ence between the expected combined effect(30%plus10% risk reduction would suggest40%risk reduction when both exposures are present)and the observed combined effect (14%risk reduction).The synergy index is below1indi-cating negative interaction,while the relative excess risk due to interaction and the proportion attributable to the interaction are both above0indicating positive interaction. So,the different measures give inconsistent results indi-cating that this is not the proper way to calculate these measures.Recoding use of ACE inhibitorsThe OR was lowest in the stratum of‘use of ACE inhibi-tors and ACE gene II or ID’(Table1;OR=0.70[95%CI: 0.49–1.00]).To make this stratum the reference category, we recoded the variable‘use of ACE inhibitors’,so‘no use of ACE inhibitors’was coded as1and‘use of ACE inhibitors’as0.Table2presents the results after recoding the use of ACE inhibitors and shows that both individualTable1Use of ACE inhibitors and DD genotype of ACE gene as preventive and risk factor for diabetes:effects of both exposures irrespective of the value of the other exposure,joint effects of both exposures using one reference category,and measures of interaction on additive scaleN cases N controls Estimate95%confidence intervalLower limit Upper limitOdds ratios representing single effectsNo use of ACE inhibitors1291,167 1.00(reference)Use of ACE inhibitors748770.760.57 1.03ACE gene II or ID1441,462 1.00(reference)ACE gene DD59582 1.030.75 1.41Odds ratios representing joint effectsNo use of ACE inhibitors and ACE gene II or ID90788 1.00(reference)Use of ACE inhibitors and ACE gene II or ID546740.700.49 1.00No use of ACE inhibitors and ACE gene DD393790.900.61 1.34Use of ACE inhibitors and ACE gene DD202030.860.52 1.43 Measures of interaction on additive scaleRERI0.26-0.300.82AP0.30-0.280.88S0.350.027.36 Estimating measures of interaction on an additive scale for preventive exposures435effects are indicating risks of diabetes(OR=1.43for no use of ACE inhibitors;OR=1.23for DD genotype of ACE gene).The RERI,AP and synergy index now give consistent results as they all indicate negative interaction on an additive scale,meaning that the combined effect is less than the sum of the effects of not using ACE inhibitors and having the DD genotype of the ACE gene.Note that not only the sign of the RERI and AP changed,but also the estimate itself.Explaining the differencesThe reason why using preventive factors gives wrong and inconsistent results in the measures of interaction on an additive scale is because a relative risk is restricted between0and1for a preventive factor while it can go from1to infinity for a risk factor.For example,a relative risk of0.60means a relative risk reduction of40%, whereas the inverse(1/0.60=1.67)means a relative increase in risk of67%.Clearly,this could lead to different results if these numbers are used in calculating the mea-sures of additive interaction(e.g.the denominator in the synergy index S could be negative).DiscussionIn this study we showed that calculating measures of interaction on an additive scale using preventive factors can give inconsistent results.Researchers should therefore be aware to not use preventive factors to calculate these measures unless they have been recoded.After recoding exposures,careful thought about the interpretation of the measure of interaction is needed as the exposure is changed to its opposite,e.g.,physical in activity rather than physical activity,or continued smoking instead of smoking cessa-tion,and this of course has to be taken into account in the interpretation of the interaction.Recoding of preventive factors is a pragmatic solution to calculate the correct measures of interaction on an additive scale.When measures of additive interaction are of inter-est,this recoding of the variables should be done in such a way that the stratum with the lowest risk when both factors are considered jointly becomes the reference category.The result of this recoding is that the individual effects(the effect of one of the exposures in the absence of the other exposure)become risk factors for the outcome.This is important because these individual effect estimates are used in the formulas for calculating interaction on an additive scale.In particular,by choosing the stratum with the lowest risk(when both factors are considered jointly)as the reference category it is ensured that after recoding the presence of each factor will have a non-negative effect in the absence of the other so that all of the measures of interaction can be appropriately interpreted.If factors are recoded one at a time(rather than jointly as we suggest), this can again result in inconsistent effect measures.It was unclear in prior literature whether factors should be reco-ded one at a time or when considered jointly;the previous descriptions[1,16]are ambiguous and if anything read as though the recoding should be done one factor at a time. We have shown that recoding should be done by consid-ering both factors jointly.The focus of the recoding method we have described here has been to ensure that all three measures of additive interaction(RERI,AP and S)give consistent results withTable2No use of ACE inhibitors and DD genotype of ACE gene as risk factors for diabetes after recoding use of ACE inhibitors:single effects of both exposures,joint effects when using one reference category,and measures of interaction on additive scaleEstimate95%confidence intervalLower limit Upper limitOdds ratios representing single effectsUse of ACE inhibitors 1.00(reference)No use of ACE inhibitors 1.310.97 1.77ACE gene II or ID 1.00(reference)ACE gene DD 1.030.75 1.41Odds ratios representing joint effectsNo use of ACE inhibitors and ACE gene II or ID 1.43 1.00 2.03Use of ACE inhibitors and ACE gene II or ID 1.00(reference)No use of ACE inhibitors and ACE gene DD 1.280.84 1.98Use of ACE inhibitors and ACE gene DD 1.230.72 2.10 Measures of interaction on additive scaleRERI-0.37-1.230.49AP-0.29-0.980.40S0.430.07 2.60436M.J.Knol et al.regard to indicating positive or negative interaction on the additive scale.When inference about certain forms of antagonism are in view,alternative recoding schemes will be of interest[19].The recoding described here can also be motivated by considerations of the interpretation of the interaction measures themselves.The acronym RERI stands for the ‘‘Relative Excess Risk due to Interaction.’’This may be seen as a reasonable description of this measure because the measure itself can be rewritten as:RERI¼RR AþBþÀRR AþBÀÀRR AÀBþþ1and thus indicates the extent to which the relative excess risk(the extent to which the risk exceeds1)when both factors are present is greater than the sum of the relative excess risks for each of the factors individually in the absence.This difference in the relative excess risks is‘‘due to interaction.’’If,however,one of the factors is preventive in the absence of the other(i.e.if one of RR A?B-or RR A-B?are less than1)then it is no longer clear in what sense the description‘‘relative excess risk due to interaction’’is reasonable.It may be that RR A?B?=1and that the measure RERI¼RR AþBþÀRR AþBÀÀRR AÀBþþ1is greater than0simply because one of the factors is preventive.The measure RERI only merits an interpretation as a‘‘relative excess risk due to interaction’’when neither factor is preventive.Some authors now thus refer to the measure as the Interaction Contrast Ratio[20].Likewise the synergy index for additivity S¼RR AþBþÀ1RR AþBÀÀ1ðÞþRR AÀBþÀ1ðÞonly merits the interpretation as a ratio measure for assessing relative excess risk if neither factor is preventive.The method of recoding we have described here ensures that RERI and S will always carry the interpretation of relative excess measures. Acknowledgments We want to thank Prof.K.J.Rothman for helpful comments on an earlier version of this paper.This study was performed in the context of the Escher project(T6-202),a project of the Dutch Top Institute Pharma.Tyler VanderWeele was supported by NIH grant R01ES017876.Open Access This article is distributed under the terms of the Creative Commons Attribution Noncommercial License which per-mits any noncommercial use,distribution,and reproduction in any medium,provided the original author(s)and source are credited.AppendixProof that choosing the category with the lowest risk when both factors are considered jointly as the reference category will give consistent results among the three measures of additive interaction.Clearly,RERI[0if and only if AP[0since AP¼RERIRR AþBþand likewise RERI\0if and only if AP\0.If the factors are recoded so that the category with the lowest risk when both factors are considered jointly is selected as the reference category then we will have that RR A?B-C0and RR A-B?C0.When RR A?B-C0and RR A-B?C0,we havethat S[1if and only if RR AþBþÀ1ðRR AþBÀÀ1ÞþðRR AÀBþÀ1Þ[1which holds if and only if RR AþBþÀ1[ðRR AþBÀÀ1ÞþðRR AÀBþÀ1Þwhich holds if and only if RERI¼RR AþBþÀRR AþBÀÀRR AÀBþþ1[0.And similarly, with RR A?B-C0and RR A-B?C0,we have that S\1if and only if RERI\0.Example demonstrating that if recoding is done one factor at a time rather than jointly,the three measures of additive interaction may disagree and S may be negative.Consider a case control study with two dichotomous factors(G and E)with600individuals with E=0,G=1, 600with E=0,G=1,200with E=1,G=0and200 with E=1,G=1with the number of cases and controls in each category reported below.N cases N controls OROdds ratios representing joint effectsE=0,G=048552 1.00(reference) E=0,G=166534 1.42E=1,G=0121880.73E=1,G=161940.36Odds ratios representing single effectsE=01141,086 1.00(reference) E=1183820.45G=060540 1.00(reference) G=172528 1.23If the factors were recoded one at a time then we would choose E=1as the reference category for E as the OR for E=1is0.45and we would choose G=0as the reference category for G since the OR for G=1is1.23.If the factors are recoded jointly then we see that E=1,G=1 is the category with the lowest odds and so E=1would be chosen as the reference category for E and G=1would be chosen as the reference category for G.If we proceeded by recoding the factors one at a time so that the reference category A-was E=1and theEstimating measures of interaction on an additive scale for preventive exposures437reference category B-was G=0,we would obtain the following odds ratios:N cases N controls OROdds ratios representing joint effectsA-B-(E=1,G=0)12188 1.00(reference) A-B?(E=1,G=1)61940.48A?B-(E=0,G=0)48552 1.36A?B?(E=0,G=1)66534 1.94Here we would obtain a synergy index of:RR AþBþÀ1ðRR AþBÀÀ1ÞþðRR AÀBþÀ1Þ¼1:94À1ð1:36À1Þþð0:48À1Þ¼À5:86.The syn-ergy index is negative.With the coding in the Table above RERI=1.1and AP=0.57.If instead we proceed by recoding the factors jointly by choosing the combined category with the lowest risk as the reference so that the reference category A-was E=1and the reference category B-was G=1,we would obtain the following odds ratios:N cases N controls OROdds ratios representing joint effectsA-B-(E=1,G=1)6194 1.00(reference) A-B?(E=1,G=0)12188 2.06A?B-(E=0,G=1)66534 3.93A?B?(E=0,G=0)48552 2.81Now we obtain a value of the synergy index within the range from0to infinity:RR AþBþÀ1ðRR AþBÀÀ1ÞþðRR AÀBþÀ1Þ¼2:81À1ð3:93À1Þþð2:06À1Þ¼0:45.Thevalue of S\1indicates a negative interaction which is in agreement with what is indicated by RERI=-2.18\0 and AP=-0.76\0.References1.Rothman KJ.Measuring interactions.Epidemiology:an intro-duction.Oxford:University Press;2002.p.168–80.2.Andersson T,Alfredsson L,Kallberg H,Zdravkovic S,AhlbomA.Calculating measures of biological interaction.Eur J Epi-demiol.2005;20:575–9.3.Greenland S,Rothman KJ.Concepts of interaction.Modernepidemiology.Philadelphia:Lippincott-Raven Publishers;1998.p.329–42.4.Hallqvist J,Ahlbom A,Diderichsen F,Reuterwall C.How toevaluate interaction between causes:a review of practices in cardiovascular epidemiology.J Intern Med.1996;239:377–82.5.Rothman KJ.The estimation of synergy or antagonism.Am JEpidemiol.1976;103:506–11.6.Vanderweele TJ,Robins JM.The identification of synergism inthe sufficient-component-cause framework.Epidemiology.2007;18:329–39.7.Rothman KJ.Interactions between causes.Mod Epidemiol.1986;311–326.8.Assmann SF,Hosmer DW,Lemeshow S,Mundt KA.Confidenceintervals for measures of interaction.Epidemiology.1996;7:286–90.9.Hosmer DW,Lemeshow S.Confidence interval estimation ofinteraction.Epidemiology.1992;3:452–6.10.Richardson DB,Kaufman JS.Estimation of the relative excessrisk due to interaction and associated confidence bounds.Am J Epidemiol.2009;169:756–60.11.Knol MJ,Tweel IV,Grobbee DE,Numans ME,Geerlings MI.Estimating interaction on an additive scale between continuous determinants in a logistic regression model.Int J Epidemiol.2007.12.Hallan S,de Mutsert R,Carlsen S,Dekker FW,Aasarod K,Holmen J.Obesity,smoking,and physical inactivity as risk factors for CKD:are men more vulnerable?Am J Kidney Dis.2006;47:396–405.13.Marenholz I,Kerscher T,Bauerfeind A,et al.An interactionbetweenfilaggrin mutations and early food sensitization improves the prediction of childhood asthma.J Allergy Clin Immunol.2009;123:911–6.14.Yang X,So WY,Ma RC,et al.Low LDL cholesterol,albu-minuria,and statins for the risk of cancer in type2diabetes:the Hong Kong diabetes registry.Diabetes Care.2009;32:1826–32.15.Yang X,Ma RC,So WY,et al.White blood cell count and renin-angiotensin system inhibitors for the risk of cancer in type2 diabetes.Diabetes Res Clin Pract.2010;87:117–25.16.de Mutsert R,Jager KJ,Zoccali C,Dekker FW.The effect ofjoint exposures:examining the presence of interaction.Kidney Int.2009;75:677–81.17.Bozkurt O,Verschuren WM,van Wieren-de Wijer BM,et al.Genetic variation in the renin-angiotensin system modifies the beneficial effects of ACE inhibitors on the risk of diabetes mel-litus among hypertensives.J Hum Hypertens.2008;22:774–80.18.Zou GY.On the estimation of additive interaction by use of thefour-by-two table and beyond.Am J Epidemiol.2008;168: 212–24.19.Vanderweele TJ,Knol MJ.Remarks on antagonism.Am JEpidemiol.(accepted for publication).20.Greenland S,Lash TL,Rothman KJ.Concepts of interaction.Modern epidemiology.Philadelphia:Lippincott Williams& Wilkins;2008.p.71–83.438M.J.Knol et al.。