雅思常见饼图的整理分类
- 格式:ppt
- 大小:1.03 MB
- 文档页数:10
图表作文讲解2:柱状图和饼状图学生面授老师时间本次课时雅思写作第二课时教学思路1.作文简介、写作技巧2.实例讲解3.分析总结4.课后作业教学目标柱状图、饼状图知识点讲解基本特征和写作方法实例分析讲解重点写作技巧讲解范文学习柱状图和饼状图写作方法备考资料剑桥IELTS4-8教学详细内容:一、写作技巧详解1.柱状图特点柱状图是动态图表,切入点是描述趋势。
柱状图写作注重“比较”(找出similarity)和“对比”(找出difference),也就是说需要横向总结所有柱状图表的共性特征,也要分别描写各个柱子的个性特征。
两种写作方式:其一是对不同时间段内的数据进行比较,适合于数据代表的物体较少且时间界限明确的情况。
另外是对单独数据的全程描述,适合于描述数据对象很多且时间划定不清晰的情况。
2.饼状图特点饼形图与柱形图或者线形图所截然不同的是它没有了横轴与纵轴,而以饼形的分割来表示百分比,可以依照三步审题分析法来进行观察:观察共有几张饼状图,以及它们之间的关系是什么(一般说来,雅思图表题中极少见到单饼图);观察每张饼状图中有哪几个区域,以及各个区域分别代表什么;观察单个饼状图中各区域间的百分比差异,以及相同区域在各个饼状图间的百分比的比较或发展。
饼状图是所有图表题中最好写的一种,唯一值得注意的地方在于如何丰富百分比的表达和“占”的表达,要采取多样性的表达,如25%=a quarter of, 50%=half of, >50%=a/themajority of.描写饼状图中的比例构成就是饼状图图表作文的重点,但也应注意,这种描述并不是对图形的简单重复,对各项数据比例的描述应建立在归纳整理的基础上有条理地进行。
学生不仅要善于找数据,更重要的是要善于从数据或比例中升华出来,找到规律和本质。
常用词汇、句型及模板1.柱状图1)倍数的表达今年的产量是去年产量的两倍The output this year is two times(twice) more than last year’s.As much as 不可数名词 as many as 可数The books of this semester are two times as many as that of last semester.A is two times the amount of B不可数A is two times the number of B可数2) 常用套句There was …in the number of A from …to … (over next years), which was followed by … and then… until…when there was … for the next … years.From…onwards, there was … in the number of A which then increased / decreased … at …% in …In …, the number reached (was) …%, but (30) years later there was …The number of A increased rapidly from … to … during the (five-year) period.In the (three years) from … through…, the percentage of A was slightly larger / smaller than that of B.The graphs show a threefold increase in the number of A.Here is an upward trend in the number of A.… (year) witnessed / saw a sharp rise in A.2.饼状图1)常用词:percentage, proportion, make up, constitute, account for, take up, ..isdivided into…parts, consume the largest/smallest portion.2)例句:The graph, presented in a pie chart, shows the general trend in…..The percentage of A in … is more than twice tha n that of B.The biggest loss was to A area.There is not a great deal of difference between A and B.In general positions, females outnumber males.A much greater percentage of men than women are found in managerial positions.The profit of company A doubled from May to September.3)模板:The two pie charts describe ………………………The first point to note is …………………………Comparing the graphs, …………………………….The graphs also suggest that ………………………In conclusion, it can be seen from the data that …………………..4)饼状图作文模型The two pie charts illustrate the significant changes in people’s ways of communication from 1970 to 1995.The first graph shows that in 1975, the most popular way to communicate was letterwriting, with the percentage of 50%. Others ___________________________, the figures are 32% and 18% respectively.It can be seen from the second graph that ways of communication changed a lot intwo decades. By 1995, ______________________________. By contrast,________________________________.Comparing the two pie charts, we can see that the use of the phones and computersduring the same period had both risen considerably. However, letter writing became less popular among the people.In general, people inclined to use more modernized mediums to communicate withothers, while the traditional way became less employed.The pie chart depicts the proportion of ___________________________. It consistsof six segments, the largest one representing _________, which account for 26% ofthe total. _____________ takes up 21%, becoming the second largest.__________________________________. The rest proportions, 15% of all, constituting 5% and 10% respectively.From the chart it can be seen clearly that ________________________.二、实例分析分析思路:1.第一幅柱状图的描述单位是百万,即人数;第二幅则是百分比。

雅思小作文饼图写法全解析雅思小作文饼图写法全解析无论是身处学校还是步入社会,大家都写过作文吧,作文根据体裁的不同可以分为记叙文、说明文、应用文、议论文。
你知道作文怎样写才规范吗?以下是店铺为大家收集的雅思小作文饼图写法全解析,仅供参考,希望能够帮助到大家。
雅思小作文饼图写法全解析在雅思的学术类小作文中我们经常会遇到饼状图写作,不要看着一张一张的图,就退缩了,但是相对来说,这个题型还是比较容易写的一种图形,不过学生们也一定不要当做这是一件简单的事情,想要拿高分还是需要努力的,千万不能掉以轻心,否则不要就是因为这部分得分的不达标而影响到最后的综合得分。
那么下面的文章中,朗阁雅思考试研究中心写作组的专家将要探讨的是饼图中静态数据和动态数据写法中的一些区别,并且将会从高分的角度来对各种写法作一汇总,希望对大家考试的准备有一定的帮助。
首先我们必须搞清楚什么是静态什么是动态数据的饼图:当我们在考试中看到这个图示上的数据都是固定的,没有发生任何变化的时候,那么就能够认定这属于静态数据,搞清楚之后我们就能够开始写作了。
图二:不要以为这里有很多的数据就属于动态的,其实这个图示还是表示是静态的,因为我们看到在途中的各项比重相对来说也是比较稳定的,因此这个饼图的数据也是属于静态的,那么究竟哪种数据属于动态的呢?图三:这个就是动态的图示,为什么这么说呢,因为两张图种的占比数据上出现了很大的差异,这是两个年份的数据,但是各自的所占比重有所不同,所以是动态的数据。
由此,我们可以得出结论,如果我们看到的是一张饼图,而且描述的是一段时间之内比较稳定的数据,那么我们就能基本上断定那就是静态的数据,但是我们如果看到的时候两张饼图,在两个时间段时间的对比,数据出现了明显的变化,那么就能够基本上断定这张图表示的就是动态的题型。
一、静态数据饼图的'主体段写作理论朗阁雅思考试研究中心建议考生可先按照扇形面积大小从大到小排列数据,若遇到饼图中有总数的描述,宜在开头先写。
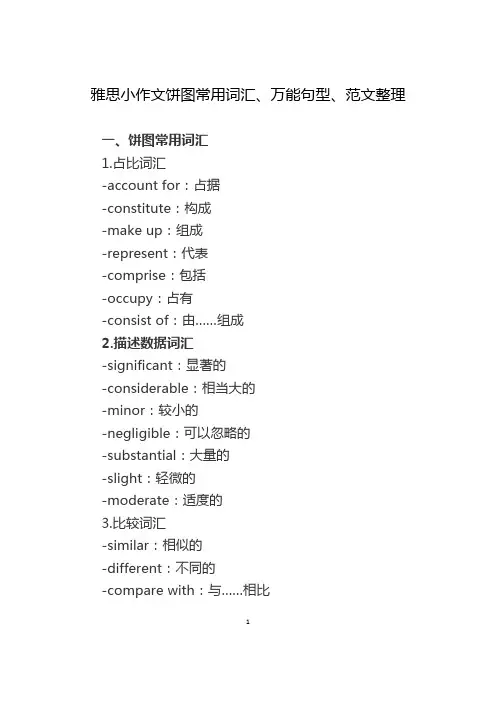
雅思小作文饼图常用词汇、万能句型、范文整理一、饼图常用词汇1.占比词汇-account for:占据-constitute:构成-make up:组成-represent:代表-comprise:包括-occupy:占有-consist of:由……组成2.描述数据词汇-significant:显著的-considerable:相当大的-minor:较小的-negligible:可以忽略的-substantial:大量的-slight:轻微的-moderate:适度的3.比较词汇-similar:相似的-different:不同的-compare with:与……相比1-in contrast to:与……形成对比-while:然而-whereas:然而-on the other hand:另一方面4.其他常用词汇-proportion:比例-segment:部分-percentage:百分比-distribution:分布-category:类别-sector:扇形二、饼图万能句型1.开头句型-The pie chart illustrates the proportion of categories in a specific field.-The pie chart provides information about the distribution of various segments.-The pie chart depicts the percentage of different categories in a given context.2.数据描述句型-Category A accounts for a significant proportion of the total, reaching XX%.-XX%of the total is occupied by CategoryB.emiring it the largest segment.2-Category C constitutes a considerable part, comprising XX%of the pie chart.-The proportion of Category D is relatively minor, only accounting for XX%.3.比较句型-In comparison with Category A, Category B has a higher percentage of XX%.-While Category A occupies XX%,Category B represents a larger proportion of XX%.-The distribution of Category C is similar to that of Category D, both comprising XX%.-In contrast to Category A, the percentage of Category B is significantly lower, at XX%.4.总结句型-Overall, the pie chart reveals a clear distribution of categories in the given field.-In summary, the majority of the pie chart is occupied by Category A, followed by Category B.-It can be concluded that Category C and Category D play minor roles in the overall distribution.三、实战演练题目:The pie chart below shows the main reasons for traffic accidents in a particular area. Summarise the3information by selecting and reporting the main features, and make comparisons where relevant.答案:The pie chart illustrates the main reasons for traffic accidents in a specific area. Upon analysis, several key points can be identified.First and foremost, the largest proportion of traffic accidents is caused by driver error, accounting for 45%of the total. This is followed by poor weather conditions, which constitute 25%of the accidents. Vehicle defects and road conditions each occupy 10%of the pie chart, while the remaining 10%is attributed to other factors.In comparison, driver error is the most significant factor, nearly doubling the percentage of poor weather conditions. Meanwhile, vehicle defects and road conditions share the same proportion, both comprising a minor part of the total.Overall, the pie chart reveals that driver error is the primary cause of traffic accidents in the given area, with poor weather conditions being the second most common factor. Other factors, such as vehicle defects and road conditions, play relatively minor roles in the overall distribution.4。


雅思小作文 T A S K 1 图表题规律注意事项:1 . Task1 是客观写作,要求客观真实。
2 . 客观性:不应该有任何图里没有而靠自己主观想象加入的成分。
结尾段针对图形做出的总结性结论也应该是根据图表的实际内容做出的符合逻辑的总结。
准确性:图表里面的数据介绍要力求精确,不能抄错数字。
但当一个特征点没有落在一个准确的坐标值上时,允许进行合理的目测或估计一个大概数值。
详尽性:要有层次感,并不需要把所有的数字都推到文章里。
3 . 类型Table 表格题Line Graph 线图Bar Chart 柱状图Pie Chart 饼状图Process Chart 流程图4 . 看图要注意单位,标题和图例。
5 . 对于多数小作文题,题中给出了几个图就对应的写出几个主体段。
题目里只给出一个图,根据图中包含几类图形元素写几个主体段。
图中只给了一个图,但图中所含图形元素很多,则分类。
题目中出现多线多柱多饼,用“对应提取法“,把每组里的对应元素提出来组织主体段。
6 . 时态和发生时间意义对应。
陈述永恒事实的句型,其主句的谓语动词必定用一般现在时。
若题目里没有出现时间,则全文都使用一般现在时。
7 . 结构开头段(1~2句)改写原题主体段1 总体概括具体介绍数字主体段N 总体概括具体介绍数字结尾段(1~2句)介绍总数(若图里并没有明确的给出总数,则省略)结论(根据图里的数据得出有一定合理性的结论)8 . 开头段的改写题目中ShowProportion InformationThe number/amount of FamilyMalesFemaleInfluence改写成illustrate /compare percentagedatathe figure for householdmenwomenaffect/effectCategories kinds/typesSubway system Storeunderground railway/train system shop9 . 介绍数据或描述变化趋势的常用词。

雅思小作文饼图写作结构解析雅思小作文饼图写作结构许多考生觉得饼图十分简单,也就是一些百分比及数字的列举,对该类图表不太重视,准备并不充分。
笔者根据学生的日常作业来看,很多学生并没能准确把握这一图表的特征。
在实际考试中,真题大多是多个饼图结合出现,如果一味地罗列数据照搬词组,不但文章读起来枯燥无味,句式和词汇也缺少变化,是无法得到理想的分数的。
本文中,写作组的专家将对饼图的分析方法、词汇句型和写作套路进行总结和分类,以帮助考生理清写作思路,更准确地回应题目的要求。
1. 分析思路在实际考试中,一般以三到四个饼图出现为主,最多曾出现过六个饼图的组合,但无论如何变化,多饼图一般可分为以下两种模式,笔者将举出一些实例进行分析:1)无关型饼图三个饼图它们分别介绍了世界上的不同花费比例,世界人口分布及资源消耗的去向,三个饼图涉及的内容和划分标准不尽相同,不可能将三者结合起来一起论述。
对于这种图表,我们的文章框架架构如下:Introduction:分别概述三个饼图所说明的信息如:The three pie charts respectively illustrate some data regarding the distribution in world spending, global population and consumption of resources.Body:分别说明各饼图的内容,辅以数据(段落层次按照个数划分即可,本题就可以分成三个段落)分别进行排序,稍后详细分析。
Conclusion(选用):说明三个饼图的相关含义,如无,可提炼一下每个饼图最典型的特征(如果已达到要求字数且充分说明内容,结尾段可以略去)详细来看,世界花费主要支出在食物方面,交通、房产和穿着次之,其他项目合计占到总数的40%;亚洲是世界人口的主要来源地,欧洲、美洲和非洲均占到10%以上,其他地区人口较少。
这两个饼图都可以用“排序”的方式来列举数据,具体的写法我们会在下面详细说明。