外文翻译---供给与需求的市场力量
- 格式:docx
- 大小:33.10 KB
- 文档页数:12
英语六级考试翻译练习(4)【原文】中国经济被称为发展中的市场经济。
发展中的市场经济是指经济的重点放在劳动力、商品和服务领域,并由供需关系决定。
中国经济在过去几年中一直呈增长态势,每年平均增长率约为10%。
因为经济的持续发展,中国的贫困率已经降低。
在过去30年里,人均收入(per capita income)增长超过了8%。
由于2008年的经济变迁,许多私营企业被迫倒闭。
正是由于这个原因,国有经济必须要发展。
【解析】1.发展中的市场经济是指经济的重点放在劳动力、商品和服务领域,并由供需关系决定:该句可使用定语从句进行翻译,其中重点放在可译为put emphasis on sth.;供需关系即供应和需求,可翻译为supply and demand。
2.因为经济的持续发展,中国的贫困率已经降低:经济的持续发展可译为economy continues to develop; 贫困率可用the poverty rate来表达。
3.由于2008年的经济变迁,许多私营企业被迫倒闭:2008年的经济变迁可用economic changes in 2008来表达;私营企业可译为private enterprises。
【参考答案】The economy of China is known as a developing market economy.Adeveloping market economy refers to one that puts emphasis on the areas of labor, goods and services, which is set by supply and demand. The economic growth in China has been increasing over the last few years. The average annual growth rate is about 10%. Because its economy continues to develop, the poverty rate in China has decreased. Per capita income has increased over the last three decades by more than 8%.Because of economic changes in 2008, many of the private enterprises were forced to close. It was due to this problem that the national economy had to expand.【原文】改革开放以来,中国的投资环境发生了翻天覆地的变化。

2023版《普通高中经济课程标准》供求解读英汉互译Introduction本文将对2023版《普通高中经济课程标准》中关于供求解读的内容进行英汉互译,并进行简要介绍。
该课程标准旨在培养普通高中学生的经济学素养和实践能力,为他们未来的研究和职业发展奠定基础。
英文解读1. Definition and Understanding of Supply and Demand供求的定义和理解- Supply: The quantity of goods or services that producers are willing and able to provide in the market at a given price and period of time.供给:生产者在市场上某一特定的价格和时间段内愿意提供的货物或服务的数量。
- Demand: The quantity of goods or services that consumers are willing and able to purchase in the market at a given price and period of time.需求:消费者在市场上某一特定的价格和时间段内愿意购买的货物或服务的数量。
2. Factors Affecting Supply and Demand影响供求的因素- Supply Factors: Factors that affect the quantity of goods or services supplied in the market, such as production costs, technology, and government policies.供给因素:影响市场上供应数量的因素,比如生产成本、技术和政府政策等。
需求因素:影响市场上需求数量的因素,如消费者收入、偏好和人口等。

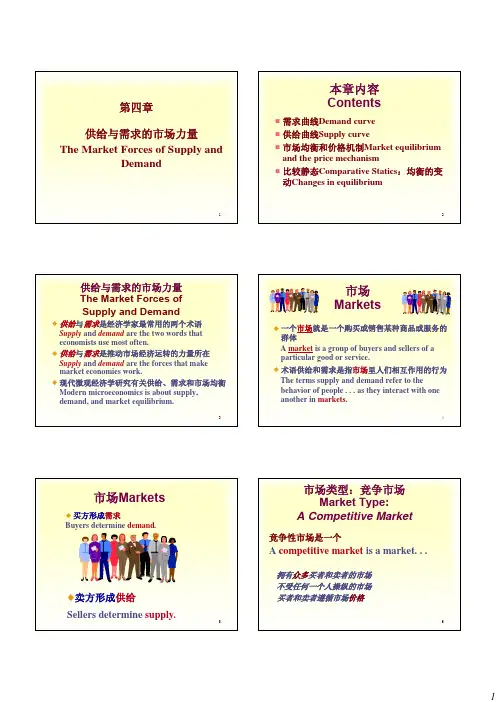
附录AA.1 THE MARKET FORCES OF SUPPLY AND DEMANDWhen a cold snap hits Florida,the price of orange juice rises in supermarkets throughout the country.When the weather turns warm in New England every summer,the price of hotel rooms in the Caribbean plummets.When a war breaks out in the Middle East,the price of gasoline in the United States rises,and the price of a used Cadillac falls.What do these events have in common? They all show the workings of supply and demand.Supply and demand are the two words that economists use most often—and for good reason.Supply and demand are the forces that make market economies work.They determine the quantity of each good produced and the price at which it is sold.If you want to know how any event or policy will affect the economy,you must think first about how it will affect supply and demand.This chapter introduces the theory of supply and demand.It considers how buyers and sellers behave and how they interact with one another.It shows how supply and demand determine prices in a market economy and how prices,in turn,allocate the economy's scarce resources.A.1.1 MARKETS AND COMPETITIONThe terms supply and demand refer to the behavior of people as they interact with one another in markets.A market is a group of buyers and sellers of a particular good or service.The buyers as a group determine the demand for the product,and the sellers as a group determine the supply of the product.Before discussing how buyers and sellers behave,let's first consider more fully w hat we mean by a “market” and the various types of markets we observe in the economy.A.1.1.1 COMPETITIVE MARKETSMarkets take many forms.Sometimes markets are highly organized,such as the markets for many agricultural commodities.In these markets,buyers and sellers meet at a specific time and place,where an auctioneer helps set prices and arrange sales.More often,markets are less organized.For example,consider the market for ice cream in a particular town.Buyers of ice cream do not meet together at any one time.The sellers of ice cream are in different locations and offer somewhat different products.There is no auctioneer calling out the price of ice cream.Each seller posts a price for an ice-cream cone,and each buyer decides how much ice cream to buy at each store.Even though it is not organized,the group of ice-cream buyers and ice-cream sellers forms a market.Each buyer knows that there are several sellers from which to choose,and each seller is aware that his product is similar to that offered by other sellers.The price of ice cream and the quantity of ice cream sold are not determined by any single buyer or seller.Rather,price and quantity are determined by all buyers and sellers as they interact in the marketplace.The market for ice cream,like most markets in the economy,is highly competitive.A competitive market is a market in which there are many buyers and many sellers so that each has a negligible impact on the market price.Each seller of ice cream has limited control over the price because other sellers are offering similar products.A seller has little reason to charge less than the going price,and if he or she charges more,buyers will make their purchases elsewhere.Similarly,no single buyer of ice cream can influence the price of ice cream because each buyer purchases only a small amount.In this chapter we examine how buyers and sellers interact in competitive markets.We see how the forces of supply and demand determine both the quantity of the good sold and its price.A.1.1.2 COMPETITION:PERFECT AND OTHERWISEWe assume in this chapter that markets are perfectly competitive.Perfectly competitive markets are defined by two primary characteristics:(1) the goods being offered for sale are all the same,and (2) the buyers and sellers are so numerous that no single buyer or seller caninfluence the market price.Because buyers and sellers in perfectly competitive markets must accept the price the market determines,they are said to be price takers.There are some markets in which the assumption of perfect competition applies perfectly.In the wheat market,for example,there are thousands of farmers who sell wheat and millions of consumers who use wheat and wheat products.Because no single buyer or seller can influence the price of wheat,each takes the price as given.Not all goods and services,however,are sold in perfectly competitive markets.Some markets have only one seller,and this seller sets the price.Such a seller is called a monopoly.Your local cable television company,for instance,may be a monopoly.Residents of your town probably have only one cable company fromwhich to buy this service.Some markets fall between the extremes of perfect competition and monopoly.One such market,called an oligopoly,has a few sellers that do not always compete aggressively.Airline routes are an example.If a route between two cities is serviced by only two or three carriers,the carriers may avoid rigorous competition to keep prices high.Another type of market is monopolistically competitive;it contains many sellers,each offering a slightly different product.Because the products are not exactly the same,each seller has some ability to set the price for its own product.An example is the software industry.Many word processing programs compete with one another for users,but every program is different from every other and has its own price.Despite the diversity of market types we find in the world,we begin by studying perfect competition.Perfectly competitive markets are the easiest to analyze.Moreover,because some degree of competition is present in most markets,many of the lessons that we learn by studying supply and demand under perfect competition apply in more complicated markets as well.A.1.2 DEMANDWe begin our study of markets by examining the behavior of buyers.Here we consider what determines the quantity demanded of any good,which is the amount of the good thatbuyers are willing and able to purchase.To focus our thinking,let's keep in mind a particular good—ice cream.A.1.2.1 WHAT DETERMINES THE QUANTITY AN INDIVIDUAL DEMANDSConsider your own demand for ice cream.How do you decide how much ice cream to buy each month,and what factors affect your decision? Here are some of the answers you might give.Price:If the price of ice cream rose to $20 per scoop,you would buy less ice cream.You might buy frozen yogurt instead.If the price of ice cream fell to $0.20per scoop,you would buy more.Because the quantity demanded falls as the price rises and rises as the price falls,we say that the quantity demanded is negatively related to the price.This relationship between price and quantity demanded is true for most goods in the economy and,in fact,is so pervasive that economists call it the law of demand:Other things equal,when the price of a good rises,the quantity demanded of the good falls.Income:What would happen to your demand for ice cream if you lost your job one summer? Most likely,it would fall.A lower income means that you have less to spend in total,so you would have to spend less on some—and probably most—goods.If the demand for a good falls when income falls,the good is called a normal good.Not all goods are normal goods.If the demand for a good rises when income falls,the good is called an inferior good.An example of an inferior good might be bus rides.As your income falls,you are less likely to buy a car or take a cab,and more likely to ride the bus.Prices of Related Goods Suppose:that the price of frozen yogurt falls.The law of demand says that you will buy more frozen yogurt.At the same time,you will probably buy less ice cream.Because ice cream and frozen yogurt are both cold,sweet,creamy desserts,they satisfy similar desires.When a fall in the price of one good reduces the demand for another good,the two goods are called substitutes.Substitutes are often pairs of goods that are used in place of each other,such as hot dogs and hamburgers,sweaters and sweatshirts,and movie ticketsand video rentals.Now suppose that the price of hot fudge falls.According to the law of demand,you will buy more hot fudge.Yet,in this case,you will buy more ice cream as well,because ice creamand hot fudge are often used together.When a fall in the price of one good raises the demand for another good,the two goods are called complements.Complements are often pairs of goods that are used together,such as gasoline and automobiles,computers and software,and skis and ski lift tickets.Tastes:The most obvious determinant of your demand is your tastes.If you like ice cream,you buy more of it.Economists normally do not try to explain people's tastes because tastes are based on historical and psychological forces that are beyond the realm of economics.Economists do,however,examine what happens when tastes change.Expectations:Your expectations about the future may affect your demand for a good or service today.For example,if you expect to earn a higher income next month,you may be more willing to spend some of your current savings buying ice cream.As another example,if you expect the price of ice cream to fall tomorrow,you may be less willing to buy an ice-cream cone at today's price.A.1.2.2 THE DEMAND SCHEDULE AND THE DEMAND CURVEWe have seen that many variables determine the quantity of ice cream a person demands.Imagine that we hold all these variables constant except one—the price.Let's consider how the price affects the quantity of ice cream demanded.Table A1 shows how many ice-cream cones Catherine buys each month at different prices of ice cream.If ice cream is free,Catherine eats 12 cones.At $0.50 per cone,Catherine buys 10 cones.As the price rises further,she buys fewer and fewer cones.When the price reaches $3.00,Catherine doesn't buy any ice cream at all.TableA1 is a demand schedule,a table that shows the relationship between the price of a good and the quantity demanded.附录BB.1供给与需求的市场力量当寒流袭击佛罗里达时,全国超市的桔子汁价格都上升了。
Copyright © 2010 Pearson Education, Inc. Publishing as Prentice Hall. Ec on o m ics:P r inc ipl es ,App l icat ion s ,a n d To o l sO’S u l liva n ,Sh e f f rin,Pe r ez6/e .1of 40Copyright © 2010 Pearson Education, Inc. Publishing as Prentice Hall. Ec on o m ics:P r inc ipl es ,App l icat ion s ,a n d T o o l sO’S u l liva n , Sh e f f rin,Pe r ez6/e.2of 40Copyright © 2010 Pearson Education, Inc. Publishing as Prentice Hall. E Demand, Supply, andMarket Equilibriumc on o m ic s:P r inc ipl es ,App l icat ion s ,a n d T o o l sO’S u l liva n , Sh e f f rin, P e r ez6/e.3of 40F ERNANDO Q UIJANO, Y VONN Q UIJANO, AND X IAO X UAN X UP R E P A R E D B Y The price of vanilla is bouncing.Copyright © 2010 Pearson Education, Inc. Publishing as Prentice Hall. Ec on o m ics:P r inc ip l es ,App l ica t ion s ,a n d T o o l sO’S u l liv a n ,Sh e f f rin ,Pe r ez6/e . C H A P T E R 4Demand, Supply , andMarket Equilibrium4of 40A P P L Y I N G T H E C O N C E P T S 12How do changes in demand affect prices?Hurricane Katrina and Baton Rouge Housing Prices How do changes in supply in one market affect other markets?Honey Bees and the Price of Ice Cream How does the adoption of new technology affect prices?Electricity from the WindHow do changes in supply affect prices?The Bouncing Price of Vanilla BeansHow do producers respond to higher prices?Drought in Australia and the Price of Rice345Copyright © 2010 Pearson Education, Inc. Publishing as Prentice Hall. Ec on o m ics:P r inc ipl es ,App l icat ion s ,a n d T o o l sO’S u l liv a n , Sh e f f rin,Pe r ez6/e. C H A P T E R 4Demand, Supply , and Market Equilibrium DEMAND, SUPPLY, AND MARKET EQUILIBRIUM 5of 40●perfectly competitive market A market with so many buyers and sellers that no single buyer or seller can affect the market price.Copyright © 2010 Pearson Education, Inc. Publishing as Prentice Hall. E c o n o m i cs:P r inc ipl es ,App l icat ion s ,a n d T o o l sO’S u l l iva n ,Sh e f f rin, Pe r ez6/e. C H A P T E R 4Demand, Supply , andMarket Equilibrium 6of 40THE DEMAND CURVE 4.1●quantity demanded The amount of a product that consumers are willing and able to buy.●demand schedule A table that shows the relationship between the price of a product and the quantity demanded, ceteris paribus.Copyright © 2010 Pearson Education, Inc. Publishing as Prentice Hall. Ec on o m ics:P r inc ip l es ,Ap p l ica t ion s ,a n d To o l sO ’S u l liva n ,Sh e f f rin ,Pe r ez6/e . C H A P T E R 4Demand, Supply , andMarket Equilibrium 7of 40THE DEMAND CURVE 4.1Here is a list of the variables that affect an individual consumer’sdecision, using the pizza market as an example:•The price of the product (for example, the price of a pizza)•The consumer’s income•The price of substitute goods (for example, the prices of tacos or sandwiches or other goods that can be consumed instead of pizza)•The price of complementary goods (for example, the price of lemonade or other goods consumed with pizza)•The consumer’s preferences or tastes and advertising that may influence preferences•The consumer’s expectations about future prices Copyright © 2010 Pearson Education, Inc. Publishing as Prentice Hall. Ec on o m ics :P r inc i pl es ,Ap p l icat io n s ,a n d T o o l sO ’S u l liva n , S h e f f rin,Pe r ez6/e. C H A P T E R 4Demand, Supply , andMarket Equilibrium 8of 40THE DEMAND CURVE 4.1The Individual Demand Curve and the Law of Demand ●law of demand There is a negative relationship between price and quantity demanded, ceteris paribus .●change in quantity demanded A change in the quantity consumers are willing and able to buy when the price changes; represented graphically by movement along the demand curve.●individual demand curve A curve that shows the relationship between the price of a good and quantity demanded by an individual consumer, ceteris paribus .Copyright © 2010 Pearson Education, Inc. Publishing as Prentice Hall. E c o n o m i c s : P r i n c i p l e s ,App l icat ion s , a n d T o o l sO’S u l liva n ,S h e f f rin, Pe r ez6/e. C H A P T E R 4Demand, Supply , andMarket Equilibrium 9of 40THE DEMAND CURVE 4.1The Individual Demand Curve and the Law of Demand FIGURE 4.1The Individual Demand Curve According to the law of demand, the higher the price, the smaller the quantity demanded, everything else being equal. Therefore, the demandcurve is negatively sloped: Whenthe price increases from $6 to $8, the quantity demanded decreases from seven pizzas per month (point c ) to four pizzas per month (point b ).Copyright © 2010 Pearson Education, Inc. Publishing as Prentice Hall. E c on o m ic s:P r in c ip l es ,Ap p l i cat ion s ,a n d To o l sO ’S u l liv a n ,Sh e f f rin ,P e r e z6/e . C H A P T E R 4Demand, Supply , andMarket Equilibrium 10of 40THE DEMAND CURVE 4.1From Individual Demand to Market Demand●market demand curve A curve showing the relationship between price and quantity demanded by all consumers, ceteris paribus .FIGURE 4.2From Individual toMarket DemandThe market demand equals the sum of the demands of all consumers. In this case, there are only two consumers, so at each pricethe market quantity demanded equals the quantity demanded by Al plus the quantity demanded by Bea. At a price of $8, Al’s quantity is four pizzas (point a ) andBea’s quantity is two pizzas(point b ), so the market quantity demanded is sixpizzas (point c ).Each consumer obeys thelaw of demand, so the marketdemand curve is negatively sloped.Copyright © 2010 Pearson Education, Inc. Publishing as Prentice Hall. Ec on o m ic s:P r in c ipl es ,App l icat io n s ,a n d T o o l sO’S u l li va n , S h e f f r in,P e r ez6/e. C H A P T E R 4Demand, Supply , and Market Equilibrium 11of 40THE SUPPLY CURVE 4.2Suppose you ask the manager of a firm, “How much of your product are you willing to produce and sell?” The manager’s decision about how much to produce depends on many variables, including the following, using pizza as an example:•The price of the product (for example, the price per pizza)•The wage paid to workers •The price of materials (for example, the price of dough and cheese)•The cost of capital (for example, the cost of a pizza oven)•The state of production technology (for example, the knowledge used in making pizza)•Producers’ expectations about future prices•T axes paid to the government or subsidies (payments from thegovernment to firms to produce a product)Copyright © 2010 Pearson Education, Inc. Publishing as Prentice Hall. Ec on o m ics :P r i nc ip l es ,App l icat ion s ,a n d T o o l sO’S u l liv a n ,Sh e f f rin, Pe r ez6/e. C H A P T E R 4Demand, Supply , andMarket Equilibrium 12of 40THE SUPPLY CURVE 4.2The Individual Supply Curve and the Law of Supply ●supply schedule A table that shows the relationship between the price of a product and quantity supplied,ceteris paribus.●individual supply curve A curve showing the relationshipbetween price and quantity supplied by asingle firm,ceteris paribus.●quantity supplied The amount of a product that firms are willing and able to sell.Copyright © 2010 Pearson Education, Inc. Publishing as Prentice Hall. Ec on o m ics:P r inc ipl es ,App l ic at io n s , a n d T o o l sO’S u l liva n ,S h e f f rin,Pe r ez6/e . C H A P T E R 4Demand, Supply , andMarket Equilibrium 13of 40THE SUPPLY CURVE 4.2The Individual Supply Curve and the Law of Supply FIGURE 4.3The Individual Supply Curve The supply curve of an individual supplier is positively sloped, reflecting the law of supply. As shown by point a , the quantitysupplied is zero at a price of $2, indicating that the minimum supply price is just above $2. An increase in price increases the quantity supplied to 100 pizzas ata price of $4, to 200 pizzas at aprice of $6, and so on.Copyright © 2010 Pearson Education, Inc. Publishing as Prentice Hall. Ec on o m ic s:P r inc ipl es ,App l i cat io n s , a n d T o o l sO’S u l liv a n , Sh e f f rin,Pe r ez6/e. C H A P T E R 4Demand, Supply , andMarket Equilibrium 14of 40THE SUPPLY CURVE 4.2The Individual Supply Curve and the Law of Supply ●law of supply There is a positive relationship between price and quantity supplied,ceteris paribus.●change in quantity supplied A change in the quantity firms are willing and able to sell when the price changes; represented graphically by movement along the supply curve.●minimum supply price The lowest price at which a product will be supplied.Copyright © 2010 Pearson Education, Inc. Publishing as Prentice Hall. Ec on o m ics:P r inc ipl es ,Ap p l ic at io n s ,a n d T o o l sO’S u l liva n ,Sh e f f rin , Pe r ez6/e. C H A P T E R 4Demand, Supply , andMarket Equilibrium 15of 40THE SUPPLY CURVE 4.2Why Is the Individual Supply Curve Positively Sloped?From Individual Supply to Market Supply ●market supply curveA curve showing the relationshipbetween the market price and quantitysupplied by all firms, ceteris paribus.M A R G I N A L P R I N C I P L EIncrease the level of an activity as long as its marginal benefit exceeds its marginal cost. Choose the level at which the marginal benefit equals the marginal cost.Copyright © 2010 Pearson Education, Inc. Publishing as Prentice Hall. Ec on o m ics:P r inc ipl es ,App l icat ion s ,a n d To o l sO ’S u l liv a n ,Sh e f f r in,P e r ez6/e . C H A P T E R 4Demand, Supply , andMarket Equilibrium 16of 40THE SUPPLY CURVE 4.2From Individual Supply to Market Supply ②FIGURE 4.4From Individual to Market SupplyThe market supply is the sum of the supplies of all firms. In Panel A, Lola is a low-costproducer who produces the first pizza once the price rises above $2 (shown by point a ).In Panel B, Hiram is a high-cost producer who doesn’t produce pizza until the price rises above $6 (shown by point f ).To draw the market supply curve, we sum the individual supply curves horizontally. At a price of $8, market supply is 400 pizzas (point m ), equal to 300 from Lola (point d ) plus 100from Hiram (point g ).Copyright © 2010 Pearson Education, Inc. Publishing as Prentice Hall. Ec on o m ics:P r inc ipl es , Ap p l ic at io n s ,a n d T o o l sO ’S u l liva n , S h e f f rin,Pe r ez6/e. C H A P T E R 4Demand, Supply , andMarket Equilibrium 17of 40THE SUPPLY CURVE 4.2From Individual Supply to Market Supply ④FIGURE 4.5The Market Supply Curve with Many Firms The market supply is the sum of the supplies of all firms. The minimum supply price is $2 (point a ), and the quantity supplied increases by 10,000 for each $2 increase in price to 10,000 at a price of $4(point b ), to 20,000 at aprice of $6 (point c ), and soon.Copyright © 2010 Pearson Education, Inc. Publishing as Prentice Hall. Ec on o m ics:P r inc ipl es ,App l ica t ion s ,a n d T o o l sO’S u l liva n ,Sh e f f rin, Pe r ez6/e. C H A P T E R 4Demand, Supply , andMarket Equilibrium 18of 40THE SUPPLY CURVE 4.2Why Is the Market Supply Curve Positively Sloped?T o explain the positive slope, consider the two responses by firms to an increase in price:•Individual firm.As we saw earlier, a higher price encourages a firm to increase its output by purchasing more materials and hiring more workers.•New firms.In the long run, new firms can enter the market and existing firms can expand their production facilities to produce more output.Copyright © 2010 Pearson Education, Inc. Publishing as Prentice Hall. Ec on o m ics :P r inc i pl es ,App l ica t ion s ,a n d T o o l sO’S u l liv a n ,Sh e f f rin,Pe r ez6/e . C H A P T E R 4Demand, Supply , andMarket Equilibrium 19of 40MARKET EQUILIBRIUM: BRINGING DEMAND AND SUPPLY TOGETHER 4.3Excess Demand Causes the Price to Rise●excess demand (shortage)A situation in which, at the prevailing price, the quantity demanded exceedsthe quantity supplied.Excess Supply Causes the Price to Drop●excess supply (surplus)A situation in which the quantity suppliedexceeds the quantity demanded at the prevailing price.●market equilibrium A situation in which the quantity demanded equals the quantity supplied at the prevailing market price.Copyright © 2010 Pearson Education, Inc. Publishing as Prentice Hall. Ec on o m ics:P r inc ipl es , Ap p l ic at io n s , a n d T o o l sO’S u l liva n , S h e f f rin,Pe r ez6/e. C H A P T E R 4Demand, Supply , andMarket Equilibrium 20of 40MARKET EQUILIBRIUM: BRINGING DEMAND AND SUPPLY TOGETHER 4.3 FIGURE 4.6Market Equilibrium At the market equilibrium (point a , with price = $8 and quantity = 30,000), the quantity supplied equals the quantity demanded.At a price below the equilibrium price ($6), there is excess demand —the quantity demanded at point c exceeds the quantity supplied at point b .At a price above the equilibriumprice ($12), there is excesssupply —the quantity supplied atpoint e exceeds the quantitydemanded at point d .Copyright © 2010 Pearson Education, Inc. Publishing as Prentice Hall. E c o n o m i c s : P r i n c i p l e s ,Ap p l ic at i on s ,a n d T o o l sO ’S u l liv a n ,Sh e f f rin , P e r ez6/e. C H A P T E R 4Demand, Supply , andMarket Equilibrium 21of 40MARKET EFFECTS OF CHANGES IN DEMAND 4.4Change in Quantity Demanded versus Change in Demand FIGURE 4.7Change in Quantity Demanded versus Change in Demand●change in demandA shift of the demand curve caused by a change ina variable other than the price of the product.(A) A change in price causes a change in quantity demanded, amovement along a single demand curve.For example, a decrease in price causes a move from point a to point b , increasing the quantity demanded.(B) A change in demandcaused by changes in avariable other than the price of the good shiftsthe entire demandcurve. For example, an increase in demandshifts the demand curve from D to D .Copyright © 2010 Pearson Education, Inc. Publishing as Prentice Hall. Ec on o m ic s:P r inc ipl es ,Ap p l i cat i on s , a n d To o l sO ’S u l liva n ,S h e f f rin,Pe r ez6/e . C H A P T E R 4Demand, Supply , andMarket Equilibrium 22of 40MARKET EFFECTS OF CHANGES IN DEMAND 4.4Increases in Demand Shift the Demand Curve ●normal good A good for which an increase in income increases demand.●inferior goodA good for which an increase in incomedecreases demand.●substitutesTwo goods for which an increase in theprice of one good increases the demandfor the other good.●complements Two goods for which a decrease in the price of one good increases the demandfor the other good.Copyright © 2010 Pearson Education, Inc. Publishing as Prentice Hall. Ec on o m ics:P r inc ipl es ,App l icat ion s ,a n d T o o l sO’S u l liva n , Sh e f f rin,Pe r ez6/e. C H A P T E R 4Demand, Supply , and Market Equilibrium 23of 40MARKET EFFECTS OF CHANGES IN DEMAND 4.4Increases in Demand Shift the Demand Curve Copyright © 2010 Pearson Education, Inc. Publishing as Prentice Hall. E c o n o m i c s : P r i n c i p l e s ,Ap p l i cat ion s ,a n d T o o l sO ’S u l liv a n ,S h e f f rin, Pe r ez6/e. C H A P T E R 4Demand, Supply , andMarket Equilibrium 24of 40MARKET EFFECTS OF CHANGES IN DEMAND 4.4Increases in Demand Shift the Demand Curve FIGURE 4.8An Increase in Demand Increases the Equilibrium PriceAn increase in demand shifts thedemand curve to the right: At each price, the quantitydemanded increases.At the initial price ($8), there is excess demand, with the quantity demanded (point b ) exceeding the quantity supplied (point a ).The excess demand causes the price to rise, and equilibrium isrestored at point c .To summarize, the increase in demand increases the equilibriumprice to $10 and increases theequilibrium quantity to 40,000pizzas.Copyright © 2010 Pearson Education, Inc. Publishing as Prentice Hall. Ec on o m ic s:P r in c ipl es , Ap p l ic at io n s ,a n d T o o l sO ’S u l liva n ,S h e f f rin,Pe r ez6/e . C H A P T E R 4Demand, Supply , andMarket Equilibrium 25of 40MARKET EFFECTS OF CHANGES IN DEMAND 4.4Decreases in Demand Shift the Demand Curve ④FIGURE 4.9A Decrease in Demand Decreases the Equilibrium PriceA decrease in demand shifts the demand curve to the left: At each price, the quantitydemanded decreases. At the initial price ($8), there is excess supply, with the quantitysupplied (point a ) exceeding the quantity demanded (point b ).The excess supply causes theprice to drop, and equilibrium isrestored at point c .To summarize, the decrease in demand decreases theequilibrium price to $6 and decreases the equilibriumquantity to 20,000 pizzas.Copyright © 2010 Pearson Education, Inc. Publishing as Prentice Hall. Ec on o m ics:P r inc ipl es ,App l icat ion s ,a n d T o o l sO’S u l liva n , Sh e f f r i n , P e r e z6/e. C H A P T E R 4Demand, Supply , andMarket Equilibrium 26of 40MARKET EFFECTS OF CHANGES IN DEMAND 4.4Decreases in Demand Shift the Demand Curve Copyright © 2010 Pearson Education, Inc. Publishing as Prentice Hall. E c o n o m i c s : P r i n c i p l e s ,App l icat ion s ,a n d T o o l sO ’S u l liva n , Sh e f f rin, Pe r ez6/e. C H A P T E R 4Demand, Supply , andMarket Equilibrium 27of 40MARKET EFFECTS OF CHANGES IN SUPPLY 4.5Change in Quantity Supplied versus Change in Supply ②FIGURE 4.10Change in Quantity Supplied versus Change in Supply (A) A change in price causes a change in quantity supplied, a movement along a single supplycurve. For example, an increase in price causes a move from point a to point b .(B) A change in supply (caused by a change in something other than the price of the product) shifts the entire supply curve. For example, an increase in supply shifts the supply curve from Sto S. For any given price (for example, $6), a larger quantity is supplied (25,000 pizzas at point c instead of 20,000 at point a ). The price required to generate any given quantity decreases. For example, the price required to generate 20,000 pizzas drops from $6 (point a ) to $5 (point d ).Copyright © 2010 Pearson Education, Inc. Publishing as Prentice Hall. Ec on o m ics:P r inc ipl es ,App l icat ion s ,a n d To o l sO’S u l liva n ,Sh e f f rin,Pe r ez6/e . C H A P T E R 4Demand, Supply , andMarket Equilibrium 28of 40MARKET EFFECTS OF CHANGES IN SUPPLY 4.5Increases in Supply Shift the Supply Curve Copyright © 2010 Pearson Education, Inc. Publishing as Prentice Hall. Ec on o m ic s:P r in c ipl es , Ap p l ic at io n s ,a n d T o o l sO ’S u l liva n , S h e f f rin,Pe r ez6/e. C H A P T E R 4Demand, Supply , andMarket Equilibrium 29of 40MARKET EFFECTS OF CHANGES IN SUPPLY 4.5An Increase in Supply Decreases the Equilibrium Price FIGURE 4.11An Increase in Supply Decreases the Equilibrium Price An increase in supply shifts the supply curve to the right: At each price, the quantity supplied increases. At the initial price ($8), there is excess supply, with the quantity supplied (point b ) exceeding the quantity demanded (point a ). The excess supply causesthe price to drop, andequilibrium is restored at pointc .To summarize, the increase in supply decreases theequilibrium price to $6 and increases the equilibriumquantity to 36,000 pizzas.Copyright © 2010 Pearson Education, Inc. Publishing as Prentice Hall. Ec on o m ics:P r inc ipl es ,App l icat ion s ,a n d T o o l sO’S u l liva n ,Sh e f f rin, Pe r ez6/e. C H A P T E R 4Demand, Supply , andMarket Equilibrium 30of 40MARKET EFFECTS OF CHANGES IN SUPPLY 4.5Decreases in Supply Shift the Supply CurveCopyright © 2010 Pearson Education, Inc. Publishing as Prentice Hall. Ec on o m ic s:P r in c ipl es , Ap p l ic at io n s ,a n d T o o l sO ’S u l liva n ,S h e f f rin,Pe r ez6/e . C H A P T E R 4Demand, Supply , andMarket Equilibrium 31of 40MARKET EFFECTS OF CHANGES IN SUPPLY 4.5A Decrease in Supply Increases the Equilibrium Price ④FIGURE 4.12A Decrease in Supply Increases the Equilibrium Price A decrease in supply shifts the supply curve to the left. At each price, the quantity supplied decreases. At the initial price ($8), there is excess demand, with the quantity demanded (point a ) exceeding the quantity supplied (point b ). The excess demandcauses the price to rise, andequilibrium is restored at pointc .To summarize, the decrease in supply increases theequilibrium price to $8 and decreases the equilibrium quantity to 24,000 pizzas.Copyright © 2010 Pearson Education, Inc. Publishing as Prentice Hall. Ec on o m ics:P r inc ipl es ,App l icat ion s ,a n d T o o l sO’S u l liv a n , Sh e f f rin,Pe r ez6/e. C H A P T E R 4Demand, Supply , andMarket Equilibrium 32of 40MARKET EFFECTS OF CHANGES IN SUPPLY 4.5Simultaneous Changes in Demand and Supply ②FIGURE 4.13Market Effects of Simultaneous Changes in Demand and Supply (A) Larger increase in demand. If the increase in demand is larger than the increase in supply (if the shift of the demand curve is larger than the shift of the supply curve), both the equilibrium price and the equilibrium quantity will increase.(B) Larger increase in supply. If the increase in supply is larger than the increase in demand (if the shift of the supply curve is larger than the shift of the demand curve), the equilibrium price willdecrease and the equilibrium quantity will increase.Copyright © 2010 Pearson Education, Inc. Publishing as Prentice Hall. Ec on o m ics:P r inc ipl es ,App l icat ion s ,a n d T o o l sO’S u l liva n ,Sh e f f rin, Pe r ez6/e. C H A P T E R 4Demand, Supply , andMarket Equilibrium 33of 40PREDICTING AND EXPLAINING MARKET CHANGES 4.6Copyright © 2010 Pearson Education, Inc. Publishing as Prentice Hall. Ec on o m ics:P r inc ipl es ,App l icat ion s ,a n d To o l sO’S u l liv a n , Sh e f f rin,Pe r ez6/e . C H A P T E R 4Demand, Supply , andMarket Equilibrium 34of 40APPLICATIONS OF DEMAND AND SUPPLY 4.7We can apply what we’ve learned about demand and supply to realmarkets. We can use the model of demand and supply to predictthe effects of various events on equilibrium prices and quantities. We can also explain some observed changes in equilibrium prices and quantities. Copyright © 2010 Pearson Education, Inc. Publishing as Prentice Hall. Ec on o m ics:P r inc ipl es ,App l ica t ion s ,a n d T o o l sO’S u l liva n , S h e f f rin, Pe r ez6/e. C H A P T E R 4Demand, Supply , andMarket Equilibrium 35of 40HURRICANE KA TRINA AND BA TON ROUGE HOUSING PRICES APPLYING THE CONCEPTS #1: How do changes in demand affect prices?④FIGURE 4.14Hurricane Katrina and Housing in Baton Rouge An increase in the population of Baton Rouge increases thedemand for housing, shifting the demand curve to right.The equilibrium price increases from $130,000 (point a ) to $156,000 (point b ) A P P L I C A T I O N 1Copyright © 2010 Pearson Education, Inc. Publishing as Prentice Hall. E c o n o m i c s : P r i nc ipl es ,Ap p l ica t ion s ,a n d T o o l sO’S u l liva n ,Sh e f f rin, P e r e z6/e. C H A P T E R 4Demand, Supply , andMarket Equilibrium 36of 40②FIGURE 4.15Honeybees and the Price of Ice Cream HONEYBEES AND THE PRICE OF ICE CREAMAPPLYING THE CONCEPTS #2: How do changes in supply inone market affect other markets?A decrease in pollination by bees decreases the output of fruit andnuts, increasing the prices of some ingredients for ice cream. The resulting increase in the cost of producing ice cream shifts the supply curve upward, increasingthe equilibrium price and decreasing the equilibrium quantity.A P P L I C A T I O N 2。
外文翻译---供给与需求的市场力量附录AA.1 THE MARKET FORCES OF SUPPLY AND DEMANDWhen a cold snap hits Florida,the price of orange juice rises in supermarkets throughout the country.When the weather turns warm in New England every summer,the price of hotel rooms in the Caribbean plummets.When a war breaks out in the Middle East,the price of gasoline in the United States rises,and the price of a used Cadillac falls.What do these events have in common? They all show the workings of supply and demand.Supply and demand are the two words that economists use most often—and for good reason.Supply and demand are the forces that make market economies work.They determine the quantity of each good produced and the price at which it is sold.If you want to know how any event or policy will affect the economy,you must think first about how it will affect supply and demand.This chapter introduces the theory of supply and demand.It considers how buyers and sellers behave and how they interact with one another.It shows how supply and demand determine prices in a market economy and how prices,in turn,allocate the economy's scarce resources.A.1.1 MARKETS AND COMPETITIONThe terms supply and demand refer to the behavior of people as they interact with one another in markets.A market is a group of buyers and sellers of a particular good or service.The buyers as a group determine the demand for the product,and the sellers as a group determine the supply of the product.Before discussing how buyers and sellers behave,let's first consider more fully what we mean by a “market” and the various types of markets we observe in the economy.A.1.1.1 COMPETITIVE MARKETSMarkets take many forms.Sometimes markets are highly organized,such as the markets for many agricultural commodities.In these markets,buyers and sellers meet at a specific time and place,where an auctioneer helps set prices and arrange sales.More often,markets are less organized.For example,consider the market for ice cream in a particular town.Buyers of ice cream do not meet together at any one time.The sellers of ice cream are in different locations and offer somewhat different products.There is no auctioneer calling out the price of ice cream.Each seller posts a price for an ice-cream cone,and each buyer decides how much ice cream to buy at each store.Even though it is not organized,the group of ice-cream buyers and ice-cream sellers forms a market.Each buyer knows that there are several sellers from which to choose,and each seller is aware that his product is similar to that offered by other sellers.The price of ice cream and the quantity of ice cream sold are not determined by any single buyer or seller.Rather,price and quantity are determined by all buyers and sellers as they interact in the marketplace.The market for ice cream,like most markets in the economy,is highly competitive.A competitive market is a market in which there are many buyers and many sellers so that each has a negligible impact on the market price.Each seller of ice cream has limited control over the price because other sellers are offering similar products.A seller has little reason to charge less than the going price,and if he or she charges more,buyers will make their purchases elsewhere.Similarly,no single buyer of ice cream can influence the price of ice cream because each buyer purchases only a small amount.In this chapter we examine how buyers and sellers interact in competitive markets.We see how the forces of supply and demand determine both the quantity of the good sold and its price.A.1.1.2 COMPETITION:PERFECT AND OTHERWISEWe assume in this chapter that markets are perfectly competitive.Perfectly competitive markets are defined by two primary characteristics:(1) the goods being offered for sale are all the same,and (2) the buyers and sellers are so numerous that no single buyer or seller can influence the market price.Because buyers and sellers in perfectly competitive markets must accept the price the market determines,they are said to be price takers.There are some markets in which the assumption of perfect competition applies perfectly.In the wheat market,for example,there are thousands of farmers who sell wheat and millions of consumers who use wheat and wheat products.Because no single buyer or seller can influence the price of wheat,each takes the price as given.Not all goods and services,however,are sold in perfectly competitive markets.Some markets have only one seller,and this seller sets the price.Such a seller is called a monopoly.Your local cable television company,for instance,may be a monopoly.Residents of your town probably have only one cable company fromwhich to buy this service.Some markets fall between the extremes of perfect competition and monopoly.One such market,called an oligopoly,has a few sellers that do not always compete aggressively.Airline routes are an example.If a route between two cities is serviced by only two or three carriers,the carriers may avoid rigorous competition to keep prices high.Another type of market is monopolistically competitive;it contains many sellers,each offering a slightly different product.Because the products are not exactly the same,each seller has some ability to set the price for its own product.An example is the software industry.Many word processing programs compete with one another for users,but every program is different from every other and has its own price.Despite the diversity of market types we find in the world,we begin by studying perfect competition.Perfectly competitive markets are the easiest to analyze.Moreover,because some degree of competition is present in most markets,many of the lessons thatwe learn by studying supply and demand under perfect competition apply in more complicated markets as well.A.1.2 DEMANDWe begin our study of markets by examining the behavior of buyers.Here we consider what determines the quantity demanded of any good,which is the amount of the good that buyers are willing and able to purchase.To focus our thinking,let's keep in mind a particular good—ice cream.A.1.2.1 WHAT DETERMINES THE QUANTITY AN INDIVIDUAL DEMANDSConsider your own demand for ice cream.How do you decide how much ice cream to buy each month,and what factors affect your decision? Here are some of the answers you might give.Price:If the price of ice cream rose to $20 per scoop,you would buy less ice cream.You might buy frozen yogurt instead.If the price of ice cream fell to $0.20per scoop,you would buy more.Because the quantity demanded falls as the price rises and rises as the price falls,we say that the quantity demanded is negatively related to the price.This relationship between price and quantity demanded is true for most goods in the economy and,in fact,is so pervasive that economists call it the law of demand:Other things equal,when the price of a good rises,the quantity demanded of the good falls.Income:What would happen to your demand for ice cream if you lost your job one summer? Most likely,it would fall.A lower income means that you have less to spend in total,so you would have to spend less on some—and probably most—goods.If the demand for a good falls when income falls,the good is called a normal good.Not all goods are normal goods.If the demand for a good rises when income falls,the good is called an inferior good.An example of an inferior good might be bus rides.As your income falls,you are less likely to buy a car or take a cab,and more likely to ride the bus.Prices of Related Goods Suppose:that the price of frozen yogurt falls.The law of demand says that you will buy more frozen yogurt.At the same time,you will probably buy less ice cream.Because ice cream and frozen yogurt are both cold,sweet,creamy desserts,they satisfy similar desires.When a fall in the price of one good reduces the demand for another good,the two goods are called substitutes.Substitutes are often pairs of goods that are used in place of each other,such as hot dogs and hamburgers,sweaters and sweatshirts,and movie ticketsand video rentals.Now suppose that the price of hot fudge falls.According to the law of demand,you will buy more hot fudge.Yet,in this case,you will buy more ice cream as well,because ice cream and hot fudge are often used together.When a fall in the price of one good raises the demand for another good,the two goods are called complements.Complements are often pairs of goods that are used together,such as gasoline and automobiles,computers and software,and skis and ski lift tickets.Tastes:The most obvious determinant of your demand is your tastes.If you like ice cream,you buy more of it.Economists normally do not try to explain people's tastes because tastes are based on historical and psychological forces that are beyond the realm of economics.Economists do,however,examine what happens when tastes change.Expectations:Your expectations about the future may affect your demand for a good or service today.For example,if you expect to earn a higher income next month,you may be more willing to spend some of your current savings buying ice cream.As another example,if you expect the price of ice cream to fall tomorrow,you may be less willing to buy an ice-cream cone at today's price.A.1.2.2 THE DEMAND SCHEDULE AND THE DEMAND CURVEWe have seen that many variables determine the quantity of ice cream a person demands.Imagine that we hold all these variables constant except one—the price.Let'sconsider how the price affects the quantity of ice cream demanded.Table A1 shows how many ice-cream cones Catherine buys each month at different prices of ice cream.If ice cream is free,Catherine eats 12 cones.At $0.50 per cone,Catherine buys 10 cones.As the price rises further,she buys fewer and fewer cones.When the price reaches $3.00,Catherine doesn't buy any ice cream at all.TableA1 is a demand schedule,a table that shows the relationship between the price of a good and the quantity demanded.TABLEA1 CATHERINE'S DEMANDPRICEOFICE-CREAM CONE QUANTITY OF CONES DEMANDED0 12 0.5 10 1 8 1.5 6 2 4 2.5 2 3 0附录BB.1供给与需求的市场力量当寒流袭击佛罗里达时,全国超市的桔子汁价格都上升了。