红外谱图分析方法总结
- 格式:docx
- 大小:11.37 KB
- 文档页数:2
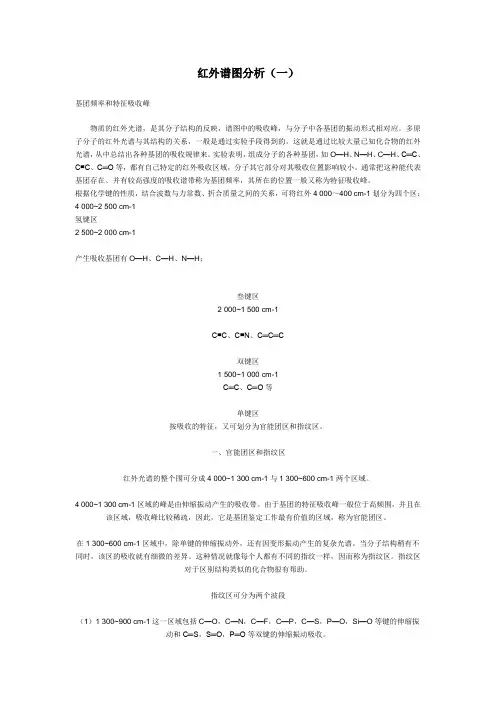
红外谱图分析(一)基团频率和特征吸收峰物质的红外光谱,是其分子结构的反映,谱图中的吸收峰,与分子中各基团的振动形式相对应。
多原子分子的红外光谱与其结构的关系,一般是通过实验手段得到的。
这就是通过比较大量已知化合物的红外光谱,从中总结出各种基团的吸收规律来。
实验表明,组成分子的各种基团,如O—H、N—H、C—H、C═C、C≡C、C═O等,都有自己特定的红外吸收区域,分子其它部分对其吸收位置影响较小。
通常把这种能代表基团存在、并有较高强度的吸收谱带称为基团频率,其所在的位置一般又称为特征吸收峰。
根据化学键的性质,结合波数与力常数、折合质量之间的关系,可将红外4 000~400 cm-1划分为四个区:4 000~2 500 cm-1氢键区2 500~2 000 cm-1产生吸收基团有O—H、C—H、N—H;叁键区2 000~1 500 cm-1C≡C、C≡N、C═C═C双键区1 500~1 000 cm-1C═C、C═O等单键区按吸收的特征,又可划分为官能团区和指纹区。
一、官能团区和指纹区红外光谱的整个围可分成4 000~1 300 cm-1与1 300~600 cm-1两个区域。
4 000~1 300 cm-1区域的峰是由伸缩振动产生的吸收带。
由于基团的特征吸收峰一般位于高频围,并且在该区域,吸收峰比较稀疏,因此,它是基团鉴定工作最有价值的区域,称为官能团区。
在1 300~600 cm-1区域中,除单键的伸缩振动外,还有因变形振动产生的复杂光谱。
当分子结构稍有不同时,该区的吸收就有细微的差异。
这种情况就像每个人都有不同的指纹一样,因而称为指纹区。
指纹区对于区别结构类似的化合物很有帮助。
指纹区可分为两个波段(1)1 300~900 cm-1这一区域包括C—O,C—N,C—F,C—P,C—S,P—O,Si—O等键的伸缩振动和C═S,S═O,P═O等双键的伸缩振动吸收。
(2)900~600 cm-1这一区域的吸收峰是很有用的。
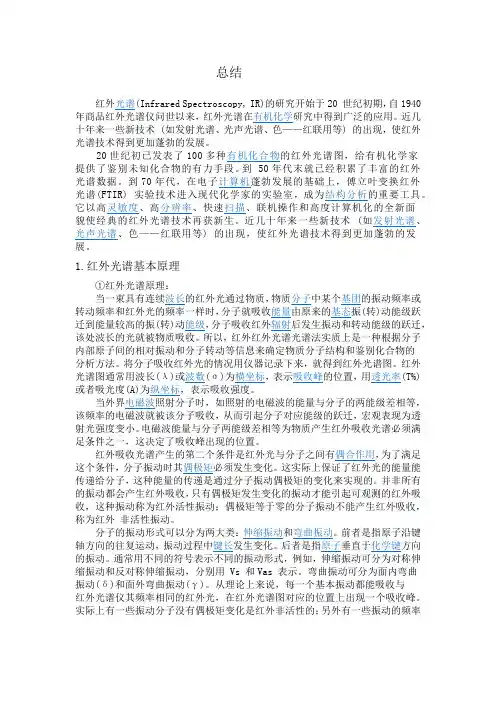
总结当一束具有连续波长的红外光通过物质,物质分子中某个基团的振动频率或转动频率和红外光的频率一样时,分子就吸收能量由原来的基态振(转)动能级跃迁到能量较高的振(转)动能级,分子吸收红外辐射后发生振动和转动能级的跃迁,该处波长的光就被物质吸收。
所以,红外红外光谱光谱法实质上是一种根据分子内部原子间的相对振动和分子转动等信息来确定物质分子结构和鉴别化合物的分析方法。
将分子吸收红外光的情况用仪器记录下来,就得到红外光谱图。
红外光谱图通常用波长(λ)或波数(σ)为横坐标,表示吸收峰的位置,用透光率(T%)或者吸光度(A)为纵坐标,表示吸收强度。
当外界电磁波照射分子时,如照射的电磁波的能量与分子的两能级差相等,该频率的电磁波就被该分子吸收,从而引起分子对应能级的跃迁,宏观表现为透射光强度变小。
电磁波能量与分子两能级差相等为物质产生红外吸收光谱必须满足条件之一,这决定了吸收峰出现的位置。
红外吸收光谱产生的第二个条件是红外光与分子之间有偶合作用,为了满足这个条件,分子振动时其偶极矩必须发生变化。
这实际上保证了红外光的能量能传递给分子,这种能量的传递是通过分子振动偶极矩的变化来实现的。
并非所有的振动都会产生红外吸收,只有偶极矩发生变化的振动才能引起可观测的红外吸收,这种振动称为红外活性振动;偶极矩等于零的分子振动不能产生红外吸收,称为红外非活性振动。
分子的振动形式可以分为两大类:伸缩振动和弯曲振动。
前者是指原子沿键轴方向的往复运动,振动过程中键长发生变化。
后者是指原子垂直于化学键方向的振动。
通常用不同的符号表示不同的振动形式,例如,伸缩振动可分为对称伸缩振动和反对称伸缩振动,分别用 Vs 和Vas 表示。
弯曲振动可分为面内弯曲振动(δ)和面外弯曲振动(γ)。
从理论上来说,每一个基本振动都能吸收与红外光谱仪其频率相同的红外光,在红外光谱图对应的位置上出现一个吸收峰。
实际上有一些振动分子没有偶极矩变化是红外非活性的;另外有一些振动的频率相同,发生简并;还有一些振动频率超出了仪器可以检测的范围,这些都使得实际红外谱图中的吸收峰数目大大低于理论值。
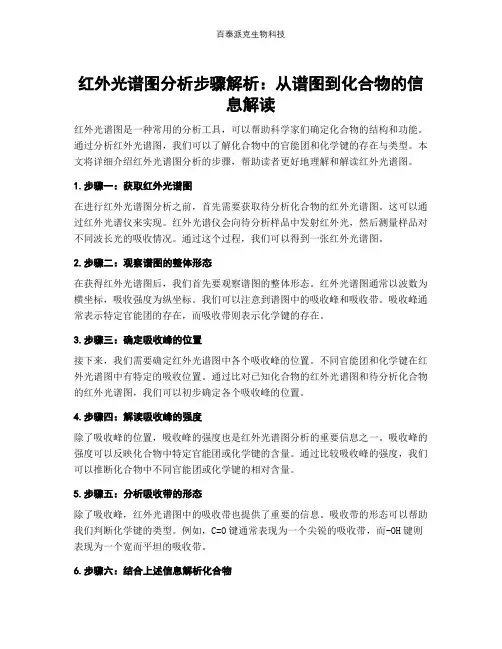
红外光谱图分析步骤解析:从谱图到化合物的信息解读红外光谱图是一种常用的分析工具,可以帮助科学家们确定化合物的结构和功能。
通过分析红外光谱图,我们可以了解化合物中的官能团和化学键的存在与类型。
本文将详细介绍红外光谱图分析的步骤,帮助读者更好地理解和解读红外光谱图。
1.步骤一:获取红外光谱图在进行红外光谱图分析之前,首先需要获取待分析化合物的红外光谱图。
这可以通过红外光谱仪来实现。
红外光谱仪会向待分析样品中发射红外光,然后测量样品对不同波长光的吸收情况。
通过这个过程,我们可以得到一张红外光谱图。
2.步骤二:观察谱图的整体形态在获得红外光谱图后,我们首先要观察谱图的整体形态。
红外光谱图通常以波数为横坐标,吸收强度为纵坐标。
我们可以注意到谱图中的吸收峰和吸收带。
吸收峰通常表示特定官能团的存在,而吸收带则表示化学键的存在。
3.步骤三:确定吸收峰的位置接下来,我们需要确定红外光谱图中各个吸收峰的位置。
不同官能团和化学键在红外光谱图中有特定的吸收位置。
通过比对已知化合物的红外光谱图和待分析化合物的红外光谱图,我们可以初步确定各个吸收峰的位置。
4.步骤四:解读吸收峰的强度除了吸收峰的位置,吸收峰的强度也是红外光谱图分析的重要信息之一。
吸收峰的强度可以反映化合物中特定官能团或化学键的含量。
通过比较吸收峰的强度,我们可以推断化合物中不同官能团或化学键的相对含量。
5.步骤五:分析吸收带的形态除了吸收峰,红外光谱图中的吸收带也提供了重要的信息。
吸收带的形态可以帮助我们判断化学键的类型。
例如,C=O键通常表现为一个尖锐的吸收带,而-OH键则表现为一个宽而平坦的吸收带。
6.步骤六:结合上述信息解析化合物通过观察红外光谱图中吸收峰和吸收带的位置、强度和形态,我们可以逐步解析化合物的结构和功能。
我们可以根据已知的红外光谱图数据库,对比待分析化合物的红外光谱图,找到相似的谱图,从而确定化合物的结构和功能。
7.结论红外光谱图分析是一种重要的化学分析方法,可以帮助科学家们确定化合物的结构和功能。
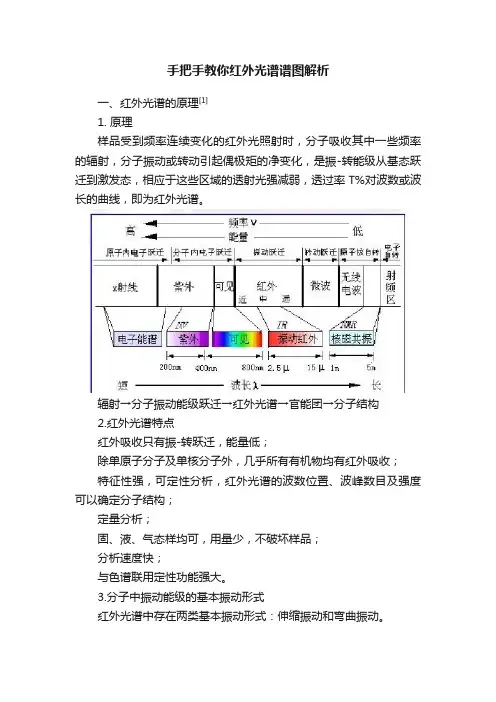
手把手教你红外光谱谱图解析一、红外光谱的原理[1]1. 原理样品受到频率连续变化的红外光照射时,分子吸收其中一些频率的辐射,分子振动或转动引起偶极矩的净变化,是振-转能级从基态跃迁到激发态,相应于这些区域的透射光强减弱,透过率T%对波数或波长的曲线,即为红外光谱。
辐射→分子振动能级跃迁→红外光谱→官能团→分子结构2.红外光谱特点红外吸收只有振-转跃迁,能量低;除单原子分子及单核分子外,几乎所有有机物均有红外吸收;特征性强,可定性分析,红外光谱的波数位置、波峰数目及强度可以确定分子结构;定量分析;固、液、气态样均可,用量少,不破坏样品;分析速度快;与色谱联用定性功能强大。
3.分子中振动能级的基本振动形式红外光谱中存在两类基本振动形式:伸缩振动和弯曲振动。
图一伸缩振动图二弯曲振动二、解析红外光谱图1.振动自由度振动自由度是分子独立的振动数目。
N个原子组成分子,每个原子在空间上具有三个自由度,分子振动自由度F=3N-6(非线性分子);F=3N-5(线性分子)。
为什么计算振动自由度很重要,因为它反映了吸收峰的数量,谱带简并或发生红外非活性振动使吸收峰的数量会少于振动自由度。
U=0→无双键或环状结构U=1→一个双键或一个环状结构U=2→两个双键,两个换,双键+环,一个三键U=4→分子中可能含有苯环U=5→分子中可能含一个苯环+一个双键2.红外光谱峰的类型基频峰:分子吸收一定频率红外线,振动能级从基态跃迁至第一振动激发态产生的吸收峰,基频峰的峰位等于分子或者基团的振动频率,强度大,是红外的主要吸收峰。
泛频峰:分子的振动能级从基态跃迁至第二振动激发态、第三振动激发态等高能态时产生的吸收峰,此类峰强度弱,难辨认,却增加了光谱的特征性。
特征峰和指纹峰:特征峰是可用于鉴别官能团存在的吸收峰,对应于分子中某化学键或基团的振动形式,同一基团的振动频率总是出现在一定区域;而指纹区吸收峰特征性强,对分子结构的变化高度敏感,能够区分不同化合物结构上的微小差异。
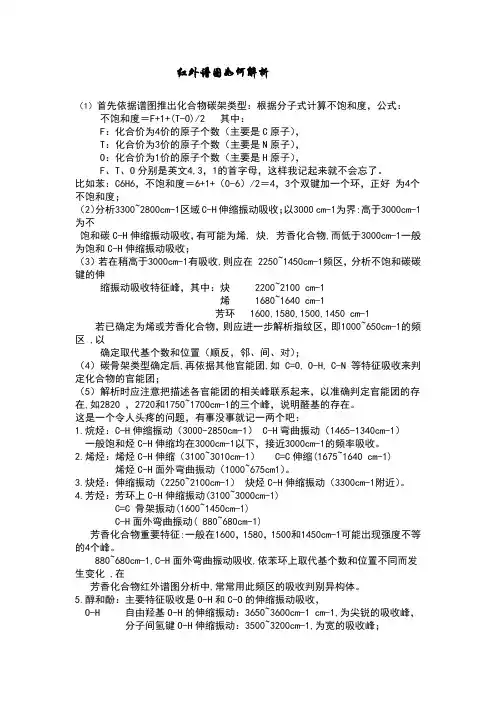
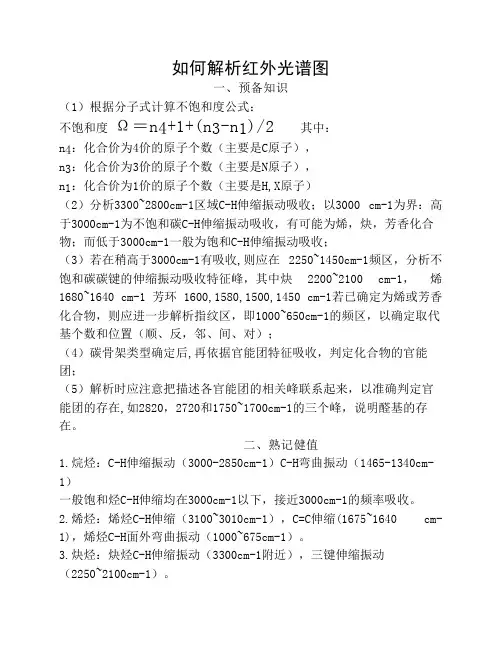
红外谱图如何解析(1)首先依据谱图推出化合物碳架类型:根据分子式计算不饱和度,公式:不饱和度=F+1+(T-O)/2 其中:F:化合价为4价的原子个数(主要是C原子),T:化合价为3价的原子个数(主要是N原子),O:化合价为1价的原子个数(主要是H原子),F、T、O分别是英文4,3,1的首字母,这样我记起来就不会忘了。
比如苯:C6H6,不饱和度=6+1+(0-6)/2=4,3个双键加一个环,正好为4个不饱和度;(2)分析3300~2800cm-1区域C-H伸缩振动吸收;以3000 cm-1为界:高于3000cm-1为不饱和碳C-H伸缩振动吸收,有可能为烯, 炔, 芳香化合物,而低于3000cm-1一般为饱和C-H伸缩振动吸收;(3)若在稍高于3000cm-1有吸收,则应在 2250~1450cm-1频区,分析不饱和碳碳键的伸缩振动吸收特征峰,其中:炔 2200~2100 cm-1烯 1680~1640 cm-1芳环 1600,1580,1500,1450 cm-1若已确定为烯或芳香化合物,则应进一步解析指纹区,即1000~650cm-1的频区 ,以确定取代基个数和位置(顺反,邻、间、对);(4)碳骨架类型确定后,再依据其他官能团,如 C=O, O-H, C-N 等特征吸收来判定化合物的官能团;(5)解析时应注意把描述各官能团的相关峰联系起来,以准确判定官能团的存在,如2820 ,2720和1750~1700cm-1的三个峰,说明醛基的存在。
这是一个令人头疼的问题,有事没事就记一两个吧:1.烷烃:C-H伸缩振动(3000-2850cm-1) C-H弯曲振动(1465-1340cm-1)一般饱和烃C-H伸缩均在3000cm-1以下,接近3000cm-1的频率吸收。
2.烯烃:烯烃C-H伸缩(3100~3010cm-1) C=C伸缩(1675~1640 cm-1)烯烃C-H面外弯曲振动(1000~675cm1)。

使用红外光谱仪进行材料分析的技巧和方法红外光谱仪是一种常见的实验室工具,广泛应用于材料科学领域。
借助红外光谱仪,研究人员可以通过材料与红外辐射的相互作用来分析样品的结构和组成。
本文将介绍使用红外光谱仪进行材料分析的一些基本技巧和方法。
一、样品准备在进行红外光谱分析之前,首要任务是准备样品。
样品制备的质量将直接影响到分析结果的准确性和可靠性。
以下是样品准备的一些建议:1. 确保样品的纯度:在准备样品之前,确保所选材料的纯度是高的。
杂质的存在可能干扰谱图的读取和解释,影响结果的准确性。
2. 选择合适的样品形式:根据分析的需要,选择合适的样品形式。
常见的样品形式包括固体、液体和气体。
每种形式都有不同的样品处理和测试方法。
3. 适当的样品量:确定合适的样品量以保证测试结果的准确性。
过少的样品可能导致信号弱,无法给出明确的结果;而过多的样品则可能在光路中引起散射或吸收,干扰分析。
二、仪器操作1. 样品加载:根据红外光谱仪的要求,正确将样品加载到样品区域。
对于固体样品,通常需要将其制备成适当的片剂或粉末形式,并正确安装到对应的样品夹中。
2. 选择合适的检测模式:红外光谱仪通常提供多种检测模式,如透射模式、反射模式和全反射-衍射模式。
根据样品性质选择适当的检测模式,并按照仪器操作手册进行操作。
3. 优化实验条件:在进行样品测试之前,应根据具体的实验需要进行优化实验条件。
优化参数包括光源强度、光路调整和测试时间等。
三、数据分析与解读1. 谱图解读:分析获得的红外光谱图,注意以下几个方面:a. 峰的位置:观察峰的位置,可以根据红外光谱图的频率与吸收峰的位置来确定功能团的存在。
每种具有特定振动的化学键都将在谱图上显示为吸收峰。
b. 峰的形状:峰的形状可以提供样品的结构信息。
对于小组分质量少的化合物,其红外光谱呈现出尖锐的吸收峰;而有机大分子的光谱则往往具有较宽的吸收峰。
c. 峰的强度:吸收峰的强度与化合物的浓度和吸收的变化有关。
红外图谱分析方法大全(Atlas of infrared spectrometry)Resolution of infrared spectrogramAnalysis of infrared spectra(1) firstly, according to the spectra, the type of compound carbon framework is deduced, and the unsaturation is calculated according to the molecular formula.Formula: non saturation = F+1+ (T-O) /2Among them:F: valence atomic number 4 valence (C atoms);T: valence atomic number 3 valence (N atoms);O: the number of atoms of 1 valence valence (H atoms).F, T, and O are the initials of English 4,3 1, so you won't forget itFor example, for example, benzene (C6H6), unsaturation = 6+1+ (0-6), /2 = 4, 3 double bonds, plus a ring, exactly 4Degree of unsaturation.(2) analyzing the 3300~2800cm^-1 regionRegional regionRegional C-H extensionStretchStretching vibration absorptionShrinkage vibration absorption absorption vibration absorptionContraction vibration absorption,,,In order to.In order toTake 3000 cm^-1 as the boundaryBoundedFor the world,,,Higher thanHigher thanHigher than 3000cm^-1Unsaturated carbonUnsaturated carbon is unsaturated carbonStretching vibration absorption of unsaturated carbon C-HTelescopic vibration, absorption, expansion, vibration absorptionStretching vibration absorption,,,There may be eneIt is possible that ene is possibleIt could be ene,,,And alkynesAlkyne alkyneAlkyne,,,Aromatic compoundsAromatic compoundsAromatic compounds?Do youYou,,,And belowBelow but belowBelow 3000cm^-1General generalcommonlySaturationSaturation is saturationSaturable vibration absorption for saturated C-HTelescopic vibration, absorption, expansion, vibration absorptionStretching vibration absorption....(3) if it is slightly higher thanAt a slightly higher than, if slightly aboveIf absorbed at slightly higher than 3000cm^-1Absorption and absorptionAbsorption,,,It should beShould be in, should be inIt should be in the 2250~1450cm^-1 frequency band Frequency regionFrequency domain analysis of unsaturated carbon carbon bondsStretching vibration absorption characteristic peaks, among which:AlkyneAlkyne alkyneAlkyne--- 2200~2100 cm^-1EneTricycleneAlkene--- 1680~1640 cm^-1 Aromatic ring Huanfang aromatic ring Aromatic ring--- 1600,,,1580,,,1500,,,1450 cm^-1If it has been identified as an alkene or an aromatic compound, the fingerprint region should be further resolvedcry of wild geeseThat is, the frequency range of the 1000~650cm^-1The frequency region of a frequency domainThe frequency band is used to determineNumber and location of substituents (CIS, trans, ortho, inter, pair).(4) carbon skeleton type determination, and then according to other functional groups, such as C=O, O-H, C-N and other characteristics of absorption to determine combinationFunctional groups of matter.(5) we should pay attention to the correlation peaks describing each functional group when analyzing, so as to accuratelydetermine the existence of functional groups, such asUltimate RealitySuch as 2820,,,,2720 andAndAnd the three peaks of 1750~1700cm^-1The three peaks of the three peaksThe three peaks,,,,Indicating the existence of an aldehyde groupIndicating the existence of an aldehyde group indicating the existence of an aldehyde groupIndicating the existence of an aldehyde group. The process of analysis is basically like this, as regards the systemAnd the use of infrared spectroscopy software, general organic experiment books have a more detailed introduction.Two, remember the commonly used health values1. alkanes3000-2850 cm-1 C-HTelescopicTelescopicStretching vibrationVibration and vibrationVibration1465-1340 cm-1 C-Hbending vibrationBending vibrationbending vibrationGenerally, saturated hydrocarbons C-H stretch at 3000 cm-1Below, close to 3000 cm-1 frequency absorption.2. olefins3100~3010 cm-1olefinOlefinOlefin C-H stretchingTelescopicTelescopic1675~1640 cm-1 C=CTelescopicTelescopicTelescopicOut of plane flexural vibration of olefin C-H (1000~675cm^1).3. Alkynes2250~2100 cm-1C= CCite= C stretching vibration Telescopic vibrationStretching vibration3300 cm-1nearbyNearbyNear the alkyneAlkyne alkyneAlkyne C-H stretching vibration Telescopic vibrationStretching vibration4. aromatics3100~3000 cm-1Aromatic ringAromatic ringC-H stretching vibration on aromatic ringTelescopic vibrationStretching vibration1600~1450 cm-1 C=CSkeleton vibrationSkeleton vibrationSkeleton vibration880~680 cm-1 C-HOut of plane bending vibrationOut of plane bending vibrationOut of plane bending vibrationImportant characteristics of aromatic compoundsImportant characteristics of aromatic compounds; important characteristics of aromatic compoundsImportant characteristics of aromatic compounds: ::Generally speakingUsually in generalUsually at 1600,,,1580,,,1500 andAndAnd 1450 cm-1May occurPossible occurrenceMay vary in intensityUnequal intensityUnequal intensityTheThe 4 peaks.880~680 cm-1The absorption of C-H bending vibration outside the surface varies with the number and location of substituents on the benzene ring,In the analysis of infrared spectra of aromatic compounds, the absorption of this frequency band is often used to identify isomers.5. alcohols and phenolsAlcohols and phenols, alcohols and phenolsAlcohols and phenolsThe main characteristic absorption is O-H andAndAnd C-O stretching vibration absorption.3650~3600 cm-1Free hydroxyl radicalFree hydroxyl radicalStretching vibration of free hydroxyl O-HThe stretching vibration of a telescopic vibration Stretching vibration,,,A sharp absorption peakA sharp absorption peak for the sharp absorption peak For sharp absorption peaks3500~3200 cm-1Intermolecular hydrogen bondingIntermolecular hydrogen bondingIntermolecular hydrogen bond, O-H, stretching vibration Telescopic vibrationStretching vibration,,,For,As forFor a broad absorption peakAbsorption peaks with wide absorption peak width Broad absorption peak1300~1000 cm-1 C-OStretching vibrationTelescopic vibrationStretching vibration769-659 cm-1 O-HOut of plane bendingOut of plane bendingOut of plane bending6. etherEther etherether1300~1000 cm-1Stretching vibration (characteristic absorption)1150~1060 cm-1A strong absorption peak fatty ether1270~1230 cm-1(flex for Ar-O);1050~1000 cm-1(stretching for R-O) -- two C-O stretching vibrational absorption of aromatic ethers7. aldehydes and ketonesAldehydes and ketones, aldehydes and ketonesAldehydes and ketones1750~1700 cm-1Aldehyde group C=O stretching (characteristic absorption) - aldehyde28202720 cm-1Aldehyde group C-H telescopic aldehyde1715 cm-1(strongly peaked) keto C=O stretching vibrations - aliphatic ketones, if carbonyl or olefinic bonds or aromatic ringsConjugation causes a decrease in absorption frequency8. carboxylic acidCarboxylic acidcarboxylic acid3300~2500 cm-1(wide and strong) O-H telescopic absorption1720~1706 cm-1 C=Oabsorb1320~1210 cm-1 C-OTelescopic920 cm-1Out of plane flexural vibrations of bonded O-H bonds - carboxylic two polymers9. ester1750~1735 cm-1C=O absorption band of saturated aliphatic ester (except formic acid)1210~1163 cm-1Saturated ester C-C (=O) -O band (for strong absorption)10. amines:3500~3100 cm-1 N-HStretching vibration absorption1350~1000 cm-1 C-NStretching vibration absorption, N-H deformation vibration equivalent to CH2 shear vibration mode,The absorption band is in1640~1560 cm-1Out of plane bending vibration at 900~650 cm-1.11. nitriles; spectral characteristics of nitrilesThe triple bond stretching region, with weak to moderate absorption.2260-2240 cm-1Aliphatic nitrile2240-2222 cm-1Aromatic nitrile12. amide3500-3100 cm-1 N-HStretching vibration1680-1630 cm-1 C=OStretching vibration1655-1590 cm-1 N-Hbending vibration1420-1400 cm-1 C-NTelescopic13. organic halidesC-X, retractable, aliphatic1400-730 cm-1: C-F; 850-550 cm-1:C-Cl; 690-515 cm-1:C-Br; 600-500 cm-1:C-I Characteristic Infrared Absorption Frequencies (characteristic infrared absorption frequency)Characteristic infrared absorption frequency characteristic infrared absorption frequencyCharacteristic infrared absorption frequency)Bond, Compound, Type, Frequency, range / cm-1C-H Alkanes 2960-2850 (s) stretch1470-1350 (V) scissoring and bendingCH3 Umbrella Deformation 1380 (M-W) - Doublet - isopropyl, t-butylC-H Alkenes 3080-3020 (m) stretch1000-675 (s) bendC-H Aromatic Rings 3100-3000 (m) stretchPhenyl Ring Substitution Bands870-675(S)弯曲苯环上取代的色彩2000-1600(W)-指纹区3333-3267 C-H炔烃(S)拉伸700-610(B)弯曲C = C烯烃1680-1640(M,W)拉伸C≡C炔烃2260-2100(W,SH)拉伸c芳环1600, 1500(w)拉伸C-O醇类、醚类、Carboxylic酸、酯1260-1000(S)拉伸醛,酮,Carboxylic酸、酯1760-1670(S)拉伸羟基单体--醇类、酚类3640-3160(S,BR)拉伸氢键-醇,酚类化合物3600-3200(b)拉伸Carboxylic酸3000-2500(B)拉伸3500-3300 N-H胺(M)拉伸1650-1580(M)弯曲1340-1020 C-N胺(M)拉伸C≡n腈2260-2220(V)拉伸二硝基化合物1660-1500(S)非对称拉伸1390-1260(S)对称拉伸如何解析红外光谱图如何解析红外光谱图如何解析红外光谱图如何解析红外光谱图一一一一、、、、预备知识Prepare knowledge; prepare knowledgePreliminary knowledge(1) the formula of unsaturation is calculated according to the molecular formula:Saturation OmegaOmega OmegaOmega == == nNNN4Forty-four4+1+ (n+1+ (n+1+ (n)+1+ (N3Thirty-three3---nNNN1Eleven1) /2/2)) /2/2) where: N4: valence atomic number 4 valence (C atoms),N3: valence atomic number 3 valence (mainly N atoms), N1: the number of atoms of 1 valence valence (mainly H, X atoms) (2) analysis of the 3300~2800cm-1 region of C-H stretching vibration absorption; in 3000 cm-1 was higher than3000cm-1 for unsaturated carbon C-H stretching vibration absorption, it may be alkene, alkyne, aromatic compounds; and lowThe 3000cm-1 is generally saturated with C-H stretching vibration absorption;(3) if the absorption is slightly higher than 3000cm-1, the unsaturated carbon should be analyzed in the 2250~1450cm-1 frequency regionThe stretching vibration absorption characteristic peaks of carbon bonds, in which alkyne 2200~2100, cm-1, ene, 1680~1640, cm-1, FangIf the ring 1600158015001450 cm-1 has been identified as an alkene or an aromatic compound, further analysis should be takenThe area of the stria, i.e., the frequency region of the 1000~650cm-1, determines the number and location of the substituent (CIS, trans, adjacent, and inter),Yes.);(4) after determination of carbon skeleton type, the functional groups of compounds can be determined according to the absorption characteristics of functional groups;(5) the correlation peaks describing each functional groupshould be paid attention to in the analysis, so as to determine the existence of functional groups accuratelyIn, for example, 2820,Three peaks of 2720 and 1750~1700cm-1, indicating the existence of aldehyde groups.Two22Two,,,Remember the value of healthRemember your values and memorize your valuesMemorize health values1. alkanes: C-H stretching vibrations (3000-2850cm-1), C-H flexural vibrations (1465-1340cm-1)Generally saturated hydrocarbons C-H stretching below 3000cm-1, close to the frequency absorption of 3000cm-1.2. olefins: olefins C-H stretching (3100~3010cm-1), C=C stretching (1675~1640, cm-1), olefins, C-HOut of plane bending vibration (1000~675cm-1).3.: C-H stretching alkyne alkyne (near 3300cm-1), triple bond stretching vibration (2250~2100cm-1).4. aromatic hydrocarbon: C-H stretching vibration on aromatic ring, 3100~3000cm-1, C=C, skeleton vibration 1600~1450cm-1, C-HOut of plane bending vibration 880~680cm-1.Important characteristics of aromatic hydrocarbons: 4 peaks may occur at 160015801500 and 1450cm-1 intensities.C-H bending vibration absorbs 880~680cm-1 and varies with the number and location of substituents on the benzene ringIn the analysis of infrared spectra of aromatic compounds, the commonly used isomers are identified.5. alcohols and phenols: the main characteristic absorption is the stretching vibration absorption of O-H and C-O,Stretching vibration of free hydroxyl O-H: 3650~3600cm3650~3600cm3650~3600cm3650~3600cm---1,1,1,1, for sharp absorption peaksA sharp absorption peak for the sharp absorption peakFor sharp absorption peaks,,,,O-H stretching vibration of intermolecular hydrogen bonds: 3500~3200cm3500~3200cm3500~3200cm3500~3200cm---1Eleven1, for the broad absorption peak;C-O stretching vibration: 1300~10001300~10001300~10001300~1000cm-1, O-H out of plane bending: 769-659cm-1 6.6. 6.Characteristic absorption of 6. ethersEther characteristic absorption ether characteristic absorptionCharacteristic absorption of ether:::: 1300~1000cm1300~1000cm1300~1000cm1300~1000cm---1111 stretching vibrationThe stretching vibration of a telescopic vibrationStretching vibration,Aliphatic ether: 1150~1060cm-1 a strong absorption peakAromatic ether: 1270~1230cm-1 (Ar-O) and 1050~1000cm-1 (R-O)Seven7.7.7. aldehydes and ketonesAldehydes and ketones, aldehydes and ketonesAldehydes and ketones::::Characteristic absorption of aldehydes: 1750~1700cm-1 (C=O) and 28202720cm-1 (aldehyde group C-H)Aliphatic ketone: 1715cm-1, a strong C=O stretching vibration absorption, if the carbonyl group with olefinic bonds or aromatic ring conjugate will attractFrequency reduction8. carboxylic acid: carboxylic acid two polymerCarboxylic acid, two, carboxylic acid, two polymer Carboxylic acid two dimer:::: 3300~2500cm3300~2500cm3300~2500cm3300~2500cm---1111 broad and strongWide and strong; wide and strongA wide and strong OOOO---HHHH telescopic absorptionTelescopic absorptionTelescopic absorption1720~1706cm-1 C=O telescopic absorption1320~1210cm-1 C-O telescopic absorption,920cm-1 is the bonding of the O-H bond to the out of plane bending vibration9. ester: C=O absorption band of saturated fatty acid ester (except formic acid): 1750~1735cm-1 regionSaturated ester C-O band: 1210~1163cm-1 region is strongly absorbed10. amines: NNNN---HH HH stretching vibration absorptionTelescopic vibration, absorption, expansion, vibration absorptionStretching vibration absorption 3500~3100 cm3500~3100 cm3500~3100 cm3500~3100 cm---1Eleven1; CCCC---NN NN stretching vibration absorptionTelescopic vibration, absorption, expansion, vibration absorptionStretching vibration absorption 1350~1000 cm1350~1000 cm1350~1000 cm1350~1000 cm---1Eleven1;N-H deformation vibration is equivalent to the shear vibration absorption of CH2: 1640~1560cm-1; flexural vibration absorption outside900~650cm-1.11.: three nitrile stretching region, with weak to moderate absorptionAliphatic nitrile 2260-2240cm-1 aromatic nitrile2240-2222cm-112. amide: 3500-3100cm-1, N-H, stretching vibration, 1680-1630cm-1, C=O, stretching vibration1655-1590cm-1 N-H bending vibration 1420-1400cm-1 C-N telescopic13. organic halidesOrganic halidesOrganic halide:::AliphaticAliphatic aliphaticAliphatic CCCC---XX XX telescopicTelescopicTelescopic:C-F, 1400-730, cm-1, C-Cl, 850-550, cm-1, C-Br, 690-515, cm-1, C-I 600-500, cm-1Three33Three,,,Infrared spectrum songInfrared spectrum songInfrared spectrum songInfrared can be divided into far, middle, near, middle red characteristic fingerprint area, 1300 to demarcation, pay attention to cross axis division.Look at the infrared instrument and make sure the state is solid and liquid. Sample origin, sample preparation, physical and chemical properties are related.Learn to map before learning saturated hydrocarbonsLearn the map first, learn the saturated hydrocarbon map, learn the saturated hydrocarbon firstLearn to map before learning saturated hydrocarbons,,,Three thousand, see the following formThree thousand see below three thousand at peak peakThree thousand see the following form. Two thousand nine hundred and sixtyTwenty-nine million six hundred and two thousand nine hundred and sixty2960,,,2870Twenty-eight million seven hundred and two thousand eight hundred and seventy2870 is methylMethyl is methylMethyl,,,2930Twenty-nine million three hundred and two thousand nine hundred and thirty2930,,,2850Twenty-eight million five hundred and two thousand eight hundred and fifty2850 methylene peakMethylene peakMethylene peak.1470 hydrocarbon bend, 1380 methyl. Two methyl, one carbonTwo methyl, one carbon, two methyl, one carbonTwo methyl, one carbon,1380Thirteen million eight hundred and one thousand three hundred and eighty1380 secondHalf is divided into two partsTwo points.In plane swing 720, long chain armour can also distinguish.Hydrogen stretches three thousandThe alkene extends three thousand, and the hydrogen extends three thousandThe alkene extends over three thousand, eliminating frequency doubling and halogenated hydrocarbons. The terminal alkene, this peak is strong, only one hydrogen is not obvious.Compound, and bond bias, ~ 1650 will appear. It is easy to deform the surface of alkeneIt is easy to deform the surface of hydrogen and hydrogen, and the surface of hydrogen is easy to deform outsideIt is easy to deform the surface of alkene,,,1000Ten million and one thousandStrong peaks below 1000There are strong peaks below strong peaksThere are strong peaks below.910 terminal hydrogen, another hydrogen 990. CIS two, hydrogen 690, trans to 970;Single hydrogen peak 820, interference type is difficult to determine.Alkyne hydrogen stretching three thousand and three hundredAlkyne hydrogen extends three thousand and three hundred alkyne and hydrogen extends three thousand and three hundredAcetylenic hydrogen stretching three thousand and three hundred, peak intensity peakThe peak intensity of peak peak intensity peakThe peak intensity and peakLarge and largeLarge and pointedSharpTip. Triple bond stretchingThree three stretch stretchTriple extension 2200Twenty-two million two thousand and two hundred2200,,,Alkyne hydrogen wobbleAcetylene, hydrogen, wobble, hydrogen, wobbleAlkyne hydrogen wobble 680Six hundred and eighty thousand six hundred and eighty 680.Aromatics breathe very muchAromatic hydrocarbons breathe very aromatic hydrocarbons andbreathe very muchAromatic respiration is very specialDon't stopDon't,,,1600Sixteen million one thousand and six hundred1600 ~~ ~~ 1430Fourteen million three hundred and one thousand four hundred and thirty1430,,,1650Sixteen million five hundred and one thousand six hundred and fifty1650 ~~ ~~ 2000Twenty million and two thousand2000, the way of substitution is distinct.Nine hundredNine hundred thousand and nine hundred900 ~~ ~~ 650Six hundred and fifty thousand six hundred and fifty 650,,,Surface deflection of fixed hydrogenOut of plane bending, determination of aromatic hydrogen, external bending, determination of hydrogenOut of plane bend determination of hydrogen....Five hydrogen absorption has two peaksFive hydrogen absorption has two peaks, and five hydrogen absorption has two peaksFive hydrogen absorption has two peaks,,,700.Seven hundred thousand and seven hundred700 andAndAnd 750Seven hundred and fifty thousand seven hundred and fifty750;;;;Four hydrogen onlyFour hydrogen is only four hydrogen onlyFour hydrogen is only 750Seven hundred and fifty thousand seven hundred and fifty750,,,Two hydrogen adjacentTwo hydrogen is adjacent to two hydrogenTwo hydrogen adjacent 830Eight hundred and thirty thousand eight hundred and thirty830; between two replaced the three peaksSubstitution between three peaks and two peaks instead of two out of three peaksSubstitution of two between three peaks,,,700.Seven hundred thousand and seven hundred700,,,780Seven hundred and eighty thousand seven hundred and eighty 780,,,880.Eight hundred and eighty thousand eight hundred and eighty 880 isolated hydrogenIsolated hydrogen at isolated hydrogenIsolated hydrogenAlcohol, phenol and hydroxyl groups are easy to associate withAlcohols, phenols and hydroxyl groups are easy to associate with alcohol and hydroxyl groups are easy to associate withAlcohol, phenol and hydroxyl groups are easy to associate with,,,There are strong peaks in three thousand and three hundred placesThree thousand and three hundred strong peaks, three thousand and three hundred strong peaksThere are strong peaks in three thousand and three hundred places. C O stretching absorption, easy to distinguish between brothers based.One thousand and fiftyTen million five hundred and one thousand and fifty1050 primary alcohol significantPrimary alcoholTertiary alcohol,,,1100Eleven million one thousand and one hundred1100 is ZhongBut Zhong Zhong ZhongZhong Zhong he,,,,One thousand one hundred and fiftyEleven million five hundred and one thousand one hundred and fifty1150 tertiary alcohol inTertiary alcohols in tertiary alcoholsTertiary alcohol in,,,1230Twelve million three hundred and one thousand two hundred and thirty1230 is phenolPhenols are phenolsIt's phenol.1110 ether chain extension, note the removal of ester acid alcohol. If it is closely linked to the pi bond, the two absorption must be observed,1050 symmetric peaks, 1250 antisymmetric. Benzene ring if methoxy groupIf the benzene ring has a methoxy benzene ring, if there is methoxy groupBenzene ring if methoxy group,,,Hydrocarbon stretchingHydrocarbon stretchingHydrocarbon stretching 2820Twenty-eight million two hundred and two thousand eight hundred and twenty2820....。
红外光谱解析方法红外光谱解析方法是一种常用的分析化学方法,可以用于对化合物的结构进行研究和鉴定。
红外光谱解析方法主要利用化合物在红外光的作用下,不同官能团的振动与转动引起红外光吸收的特性来分析化合物的结构。
本文将介绍一些常用的红外光谱解析方法,并给出一些结构分析实例。
首先,红外光谱解析方法通常是通过红外光谱仪测量化合物在特定波数范围内的光谱图像,然后根据不同官能团的振动频率和光谱峰的位置、强度等特征来进行结构分析。
以下是一些常用的红外光谱解析方法:1. 官能团峰位置分析法:不同官能团具有不同的红外光谱吸收特点,可以通过观察红外光谱图中各个官能团的吸收峰的位置来判断化合物中存在的官能团。
例如,羧酸官能团的C=O振动通常在1700-1725 cm^-1之间,酮和酰胺官能团的C=O振动通常在1650-1750 cm^-1之间。
2.官能团峰强度分析法:通过观察红外光谱图中各个官能团的吸收峰的强度可以推测化合物中该官能团的相对含量。
例如,苯环的C-H伸缩振动通常表现为较强的峰,而取代基的C-H伸缩振动通常较弱。
3.官能团复合分析法:化合物通常由多个官能团组成,各个官能团的振动频率和位置可以相互影响。
通过综合分析化合物中多个官能团的吸收峰的位置、强度等特征,可以进一步确定化合物的结构。
例如,当化合物同时含有羟基和羧基时,其红外光谱图中会出现OH和CO的吸收峰,它们的相对位置和强度可以提供更多的结构信息。
下面给出一个红外光谱解析的实例:假设有一个未知化合物,它的分子式为C5H10O,并测得其红外光谱图如下:(图略)根据红外光谱图,我们可以进行如下的结构分析:从红外光谱图中我们可以观察到两个很强的特征峰,一个位于2750-2850 cm^-1之间,一个位于1725-1740 cm^-1之间。
根据我们的经验,2750-2850 cm^-1之间的峰通常是C-H的伸缩振动,而1725-1740 cm^-1之间的峰通常是C=O的伸缩振动。
红外光图谱分析(1)首先依据谱图推出化合物碳架类型:根据分子式计算不饱和度,公式:不饱和度=F+1+(T-O)/2其中:F:化合价为4价的原子个数(主要是C原子),T:化合价为3价的原子个数(主要是N原子),O:化合价为1价的原子个数(主要是H原子),例如:比如苯:C6H6,不饱和度=6+1+(0-6)/2=4,3个双键加一个环,正好为4个不饱和度;(2)分析3300-2800cm-1区域C-H伸缩振动吸收;以3000cm-1为界:高于3000cm-1为不饱和碳C-H伸缩振动吸收,有可能为烯、炔、芳香化合物,而低于3000cm-1一般为饱和C-H伸缩振动吸收;(3)若在稍高于3000cm-1有吸收,则应在2250-1450cm-1频区,分析不饱和碳碳键的伸缩振动吸收特征峰,其中:炔2200-2100cm-1、烯1680-1640cm-1、芳环1600,1580,1500,1450cm-1。
若已确定为烯或芳香化合物,则应进一步解析指纹区,即1000-650cm-1的频区,以确定取代基个数和位置(顺反,邻、间、对);(4)碳骨架类型确定后,再依据其他官能团,如C=O,O-H,C-N等特征吸收来判定化合物的官能团;(5)解析时应注意把描述各官能团的相关峰联系起来,以准确判定官能团的存在,如2820,2720和1750-1700cm-1的三个峰,说明醛基的存在。
至此,分析基本搞定,剩下的就是背一些常见常用的健值了!1.烷烃:C-H伸缩振动(3000-2850cm-1)C-H弯曲振动(1465-1340cm-1)一般饱和烃C-H伸缩均在3000cm-1以下,接近3000cm-1的频率吸收。
2.烯烃:烯烃C-H伸缩(3100-3010cm-1)C=C伸缩(1675-1640cm-1)烯烃C-H面外弯曲振动(1000-675cm1)。
3.炔烃:伸缩振动(2250-2100cm-1)炔烃C-H伸缩振动(3300cm-1附近)。
红外谱图解析各官能团的特征吸收是解析谱图的基础(1)首先依据谱图推出化合物碳架类型33002800C H (2)分析3300 ~ 2800 cm 1区域C-H 伸缩振动吸收以3000 cm-1为界:高于3000 cm为不饱和碳C H 伸缩振动吸收3000cm-1C-H可能为烯, 炔, 芳香化合物低于3000 cm-1 一般为饱和C-H 伸缩振动吸收(3) 若在稍高于3000 cm-1有吸收,则应在频区2250 ~ 1450 cm-1分析不饱和碳碳键的伸缩振动吸收特征峰炔2200 ~ 2100 cm-1烯1680 ~ 1640 cm-1芳环1600,1580,1500,1450 cm-1烯或芳香化合物则应解析指纹区1000 ~ 650 cm-1频区以确定取代基个数和位置(4) 碳骨架类型确定后, 再依据其他官能团,如C O, O H, C N 等特征吸收来判定C=O,O-H,C-N化合物的官能团(5) 解析时应注意把描述各官能团的相关峰联系起来,以准确判定官能团的存在如2820,2720 和1750~1700 cm 1的三个峰说明醛基的存在例3 C7H8O1) 不饱和度:(7⨯2+2-8)÷2=4 可能含有苯环2) 3000 cm-1 以上,以及1600,1500 cm-1 表明含有苯环(-C6H5)770,700 cm-1 表明苯环取代为单取代3) 分子式为C7H8O,除去苯环(-C6H5),取代基为CH3O,(?)苯甲醚(?) 苯甲醇(?)3300 cm-1(⨯),1250,1040 cm-1(∨) 芳香脂肪醚C-O的吸收表明此化合物为苯甲醚例4:1)不:12)3000,O H;酸930,O H,O-H O-H,CH3CH2COOH3) 1700, C=O4) 1230,C-O。
红外图谱分析是光谱分析技术中的一种,它利用红外光作为光源,检测样品的吸收、反射、散射等特性,从而得到样品的分子结构和化学组成。
下面是红外图谱分析方法的详细步骤:一、准备工作在进行红外图谱分析之前,需要准备好相应的仪器和样品。
红外光谱仪通常由光源、光阑、干涉仪、样品室、检测器等部分组成。
在采集样品红外光谱时,需要使用专门的样品制备技术,如样品压制、样品溶液制备等。
二、样品制备样品制备是红外图谱分析中非常重要的一步,因为只有样品中的分子在红外光的作用下产生吸收、反射、散射等特性,才能得到样品的分子结构和化学组成。
样品制备需要根据样品的性质和所用光谱仪的类型来选择不同的制备方法,如固体样品需要进行研磨和压片,液体样品需要进行溶液制备等。
三、谱图解析在采集到样品的红外光谱后,需要通过谱图解析来得到样品的分子结构和化学组成。
谱图解析需要掌握一定的方法技巧,例如:1. 确定光谱类型:根据光谱中出现的特征峰,确定光谱的类型。
例如,如果是伸缩振动,则可以判断出样品的分子结构中存在这种键。
2. 确定基团:根据特征峰的位置和形状,确定样品中存在的基团。
例如,如果出现了苯环的振动吸收峰,则可以判断出样品中含有苯环结构。
3. 确定分子结构:通过确定基团和键的类型,可以得到样品的分子结构。
例如,如果一个化合物的红外光谱中出现了C-H键的振动吸收峰,则可以判断出这个化合物的分子结构中存在C-H键。
四、定量分析除了定性分析外,红外光谱还可以用于定量分析。
通过测量特征峰的强度和宽度等参数,可以计算出样品中某种物质的含量。
例如,可以利用红外光谱技术测定高聚物中某种单体的含量。
五、应用领域红外光谱在多个领域都有广泛的应用,例如:1. 化学领域:用于研究有机化合物、无机化合物的分子结构和化学反应机理等。
2. 材料科学领域:用于研究高聚物、无机非金属材料、金属材料的结构和化学组成等。
3. 环境科学领域:用于监测大气、水体、土壤等环境中的有害物质和污染物的含量等。
红外光谱图解析一、分析红外谱图(1)首先依据谱图推出化合物碳架类型,根据分子式计算不饱和度。
公式:不饱和度=F+1+(T-O)/2其中:F:化合价为4价的原子个数(主要是C原子);T:化合价为3价的原子个数(主要是N原子);O:化合价为1价的原子个数(主要是H原子)。
F、T、O分别是英文4,3 1的首字母,这样记起来就不会忘了举个例子:例如苯(C6H6),不饱和度=6+1+(0-6)/2=4,3个双键加一个环,正好为4个不饱和度。
(2)分析3300~2800cm^-1区域C-H伸缩振动吸收,以3000 cm^-1为界,高于3000cm^-1为不饱和碳C-H伸缩振动吸收,有可能为烯、炔、芳香化合物吗,而低于3000cm^-1一般为饱和C-H伸缩振动吸收。
(3)若在稍高于3000cm^-1有吸收,则应在2250~1450cm^-1频区,分析不饱和碳碳键的伸缩振动吸收特征峰,其中:炔—2200~2100 cm^-1烯—1680~1640 cm^-1芳环—1600、1580、1500、1450 cm^-1若已确定为烯或芳香化合物,则应进一步解析指纹区,即1000~650cm^-1的频区,以确定取代基个数和位置(顺反,邻、间、对)。
(4)碳骨架类型确定后,再依据其他官能团,如C=O,O-H,C-N 等特征吸收来判定化合物的官能团。
(5)解析时应注意把描述各官能团的相关峰联系起来,以准确判定官能团的存在,如2820、2720和1750~1700cm^-1的三个峰,说明醛基的存在。
解析的过程基本就是这样吧,至于制样以及红外谱图软件的使用,一般的有机实验书上都有比较详细的介绍的。
二、记住常见常用的健值1.烷烃3000-2850 cm-1C-H伸缩振动1465-1340 cm-1C-H弯曲振动一般饱和烃C-H伸缩均在3000 cm-1以下,接近3000 cm-1的频率吸收。
2.烯烃3100~3010 cm-1烯烃C-H伸缩1675~1640 cm-1C=C伸缩烯烃C-H面外弯曲振动(1000~675cm^1)。
红外谱图分析方法总结
1. 简介
红外(Infrared)分析技术是一种非常重要的分析测试方法,它可以用来研究
物质的结构、组成、性质及相互作用等方面的信息。
红外谱图分析方法通过测量物质对红外辐射的吸收和散射,并结合相关的理论和数据库,得出样品的红外光谱图。
本文将总结常用的红外谱图分析方法。
2. 样品制备
在进行红外谱图分析之前,首先需要将待测的样品制备成适合红外光谱测量的
形式。
常见的样品制备方法包括固体试样法、液体试样法和气相试样法。
•固体试样法:将固体样品粉碎并与适量的无水氯化钾或氯化钠混合,制成样品块。
也可以使用压片法,将粉末样品压制成片。
•液体试样法:将液体样品滴在透明基片上,使其干燥后形成薄膜。
也可以将液体样品放入适合的红外吸收池中进行测量。
•气相试样法:将气体样品填充到气室中,通过红外吸收池进行测量。
3. 红外光谱测量仪器
进行红外谱图分析需要使用红外光谱测量仪器。
常见的红外光谱测量仪器有红
外光谱仪和红外光谱仪。
红外光谱仪主要由光源、干涉仪、样品室、探测器和数据采集系统等组成。
它
通过生成红外光源并使其通过样品,然后测量样品对不同波长的红外光的吸收情况。
常用的红外光谱仪有傅立叶红外光谱仪(FTIR)和分散式红外光谱仪。
红外光谱仪是一种通过获取光谱仪的光栅分散红外光的仪器。
它通过将红外光
分散为不同的波长,并通过探测器检测各个波长的红外光强度,得到红外光谱图。
4. 红外谱图解释
红外谱图是指样品在红外区域内的吸收峰和吸收强度的图谱。
通过研究红外谱图,可以得到样品的结构和组成等信息。
红外谱图的解释可以从以下几个方面进行:
•吸收峰的位置:吸收峰的位置与样品中存在的化学键相关。
不同化学键对应着不同波数的吸收峰。
•吸收峰的强度:吸收峰的强度与样品中某种化学键的含量相关。
吸收峰的强度越高,表示样品中该化学键的含量越多。
•布拉格方程:通过使用布拉格方程可以计算吸收峰的波数。
•参考谱库:借助谱库中的红外光谱标准数据,可以将待测样品的红外光谱与已知物质进行比对和鉴定。
5. 红外谱图分析方法
红外谱图分析方法可分为定性分析和定量分析。
5.1 定性分析
定性分析主要通过对红外谱图中的吸收峰位置和形状进行解释和比较,识别样
品中存在的化学键和官能团。
常用的定性分析方法包括:
•主峰法:根据红外谱图中吸收峰的位置、形状和强度,确定样品中的主要化学键,并参考谱库进行比对和鉴定。
•差傅里叶变换(Different Fourier Transform,DFT)法:对红外谱图进行傅里叶变换,得到样品的核磁共振谱。
利用核磁共振谱进行鉴定。
5.2 定量分析
定量分析主要通过测量红外谱图中吸收峰的强度或面积,来计算样品中某种化
学键或官能团的含量。
常用的定量分析方法包括:
•直接读数法:通过测量吸收峰的吸光度或吸收面积,根据标准曲线得到样品中某种化学键的含量。
•峰高法:通过测量吸收峰的峰高和吸收光程来计算含量。
•峰面积法:通过测量吸收峰的峰面积,根据标准曲线得到样品中某种化学键的含量。
6. 结论
红外谱图分析方法是一种非常重要的分析测试方法,它可以研究物质的结构、
组成、性质及相互作用等方面的信息。
在红外谱图分析过程中,需要进行样品制备、使用红外光谱测量仪器进行测量,然后对红外谱图进行解释和分析。
常见的红外谱图分析方法包括定性分析和定量分析。
定性分析通过解读红外谱图中的吸收峰位置和形状来识别样品中存在的化学键和官能团。
定量分析通过测量吸收峰的强度或面积来计算样品中某种化学键或官能团的含量。
注意:本文讨论的红外谱图分析方法仅作为参考,具体实验和分析方法应根据具体问题和需
求进行选择和设计。