针片状含量对微表处混合料轮辙变形率的影响
- 格式:pdf
- 大小:102.69 KB
- 文档页数:3

针片状颗粒含量对沥青混合料路用性能的影响
余志凯;黄刚;胥吉
【期刊名称】《北方交通》
【年(卷),期】2010(000)006
【摘要】采用石灰岩碎石,选取5%、15%、25%、35%、45% 5种不同粗集料针片状颗粒含量对AC-20进行试验研究.通过马歇尔试验得到最佳油石比分别
为:4.25%、4.30%、4.40%、4.45%、4.55%.在最佳油石比条件下成型试件并测试其高温稳定性、水稳定性及动态劲度模量.试验结果表明:随着针片状颗粒含量的增加,沥青混合料高温稳定性和水稳定性变差,劲度模量减小.
【总页数】3页(P14-16)
【作者】余志凯;黄刚;胥吉
【作者单位】重庆市交通工程监理咨询有限责任公司,重庆,400060;重庆交通大学土木建筑学院,重庆,400074;广东省长大公路工程有限公司三分公司,广州,510620【正文语种】中文
【中图分类】U416.217
【相关文献】
1.凝灰岩集料针片状颗粒含量对沥青混合料力学性能的影响研究 [J], 胡满意
2.集料针片状含量对SMA 沥青混合料路用性能的影响 [J], 闫桓硕;
3.针片状颗粒对沥青混合料路用性能影响研究 [J], 刘学鹏; 秦仁杰; 张认; 王武魁
4.针片状颗粒含量对沥青混合料路用性能的影响研究 [J], 张孝胜;金光来
5.针片状含量对排水沥青混合料路用性能的影响 [J], 边建民;任亚伟
因版权原因,仅展示原文概要,查看原文内容请购买。

微表处和稀浆封层技术指南细则总则1.0.1为指导微表处和稀浆封层的设计、试验、施工、质量控制与竣工验收,保证工程质量,制定本指南。
1.0.2微表处可以用于:(1)高速公路,一、二级公路的沥青路面、水泥路面的预防性养护罩面和沥青路面的车辙修复,以及水泥混凝土桥面、水泥混凝土隧道道面罩面;(2)新建或改扩建高速公路,一、二级公路的沥青路面、水泥混凝土桥面的表面磨耗层。
1.0.3稀浆封层可以用于:(1)二、三、四级公路沥青路面的预防性养护罩面;(2)新建或改扩建各等级公路(包括高速公路)的下封层。
1.0.4微表处和稀浆封层应与原路面粘结牢固,坚实、平整、耐久、有良好的封水效果。
微表处和用于罩面的稀浆封层还应有良好的抗滑性能。
1.0.5微表处和稀浆封层施工,应遵守国家环保法规,注意保护环境。
1.0.6微表处和稀浆封层施工应保证安全,有良好的劳动保护。
1.0.7微表处和稀浆封层的设计、施工除遵照本指南外,还应符合现行国家及行业颁布的有关标准、规范和法规。
各地可根据实际情况,制订相应的技术指南。
说明:1.0.2和1.0.3条规定了微表处和稀浆封层的用途。
微表处在国外既用于沥青路面,也用于水泥混凝土路面的罩面。
在我国,微表处目前大多用于沥青路面和水泥混凝土桥面、隧道道面等,也有少量在水泥混凝土路面上使用的实例,但经验不多。
建议大家在水泥路面上应用微表处时要十分注意对原路面病害的处理,脱空、断角、断板等病害必须彻底修补,接缝必须重新灌缝,保证水泥板平整、坚实、稳定,下卧层支撑均匀。
1.0.4原路面状况会对微表处和稀浆封层的使用效果和使用寿命产生显著影响,为此要求原路面有充足的结构强度,原路面的裂缝、坑槽等病害事先进行处理。
1.0.7我国幅员辽阔,各地情况千差万别,建议各地根据各自的实际情况,在本指南的基础上制订各自的技术指南,但各项技术要求不宜低于本指南的规定。
2 术语2.0.1 微表处(Micro-Surfacing)采用专用机械设备将聚合物改性乳化沥青、粗细集料、填料、水和添加剂等按照设计配比拌和成稀浆混合料摊铺到原路面上,并很快开放交通的薄层。


粗集料针片状对多孔沥青混合料性能的影响王晓威;顾兴宇;董侨;吴江涛【摘要】研究了4种粗集料针片状颗粒含量(0%,原状,30%,40%)对多孔沥青混合料骨架结构和性能的影响.分别采用二维数字图像处理、飞散试验、混合料破碎试验以及渗透试验,评价针片状对多孔沥青混合料的体积指标、骨架接触特性、耐久性、骨架稳定性和渗透性能的影响.试验结果表明:针片状含量对多孔沥青混合料的空隙率、骨架接触线长度、骨架接触点个数、集料破碎率和渗透系数具有显著的影响.由于粗集料针片状的破碎,多孔沥青混合料的有效空隙率、高温性能、长期耐久性以及骨架稳定性随着针片状含量的增大而衰减.与传统密级配沥青混合料相比,由于多孔沥青混合料具有开级配骨架,从而对针片状含量更加敏感,多孔沥青混合料应采用更严格的针片状含量要求.%Four flat and elongated (F&E) contents (0%, original, 30%, and 40%) were investigated to evaluate the effects of F&E particles on the performance of porous asphalt mixture ( PA). Laboratory tests including volumetric determination, two-dimensional image analysis, Cantabro loss tests, breakdown tests, and permeability tests were conducted to evaluate the volumetric properties, the state of stone-on-stone contact, durability, skeleton stability and permeability of PA, respectively. The test results indicate that the F&E content was a significant factor for total air voids, aggregate skeleton break down, and permeability. The functionality, rutting resistance, long-term durability, and skeleton stability decrease with the increase of F&E content since F&E aggregates in porous asphalt mixtures have a tendency to breakdown. Compared with traditional dense graded mixtures, PA is more sensitive to the F&E contentdue to an open graded aggregate structure. Therefore, the stricter requirement for F&E content should be met for porous asphalt mixtures than the one for traditional dense graded mixture.【期刊名称】《东南大学学报(英文版)》【年(卷),期】2018(034)001【总页数】8页(P87-94)【关键词】多孔沥青混合料;针片状;骨架稳定性;耐久性;渗透性【作者】王晓威;顾兴宇;董侨;吴江涛【作者单位】东南大学交通学院,南京210096;东南大学交通学院,南京210096;东南大学交通学院,南京210096;东南大学交通学院,南京210096【正文语种】中文【中图分类】U416.217Porous asphalt mixture (PA)is an open graded mixture.It has a high air void (AV)(18% to 23%)and a coarse aggregate skeleton with stone-on-stone contact[1].PA was designed to infiltrate storm water, reduce the risk of hydroplaning and wet skidding, decrease splash and spray, and lower noise[2].High AV and a coarse granular skeleton bring these advantages, but result in some disadvantages, such as reduced performance, high construction costs, and low durability[3].Aggregate properties play the most important role in the performance of PA since it consists of morethan 80% coarse aggregates (retain on the 2.36 mm)[4].Fine aggregate angularity and coarse aggregate shape are the two of the aggregate properties which have the most important influence on mixture performance[5].According to the ratio of the length to the minimum thickness or width, coarse aggregates can be classified into flat, elongated, flat and elongated (F&E), and neither flat nor elongated (non-F&E)particles[6].In this study,F&E particles include flat, elongated, flat and elongatedparticles.Superpave mix design system specifies that an aggregate is determined to be F&E particles if the ratio is greater than five and requires that the F&E content in the aggregate shall not exceed 10% formixture[7].The standard of F&E particles with the ratio of 5∶1 cannot distinguish different aggregates, and most coarse aggregate sources satisfy the current specification of a maximum limit of 10% content of F&E with the ratio of 5∶1.Therefore, many researchers recommend that F&E particles should be changed from the ratio of 5∶1 to 3∶1[8-9].In China, specifications have the same requirement that the F&E content must not exceed 15% for all types of mixtures, even though PA has larger coarse aggregate proportion.Huber et al.[5] found that the dense graded mixtures with 19.4% and 9.0% F&E (ratio 3∶1)contents have no significant difference in volumetric properties.Other studies conducted by Buchanan[9] revealed that F&E (ratio is 3∶1)contents of 29.5%, 21.8% and 16.2% show no significant differences in volumetric properties, rutting resistance, fatigue resistance,and breakdown for traditional dense graded mixture.However, regarding granite with F&E contents of 57%, 14.4%, and 2.1%, significant changes were found in the voids in mineral aggregate (VMA)and gradation.Brown et al.[8] evaluated various F&E contents (0%, 25%, 50%, 75% and 100%)for stone matrix asphalt (SMA)mixtures.The results also indicated that the change in percent passing the 4.75 mm sieve shows an increase with the increase in F&E content.Airey et al.[10] stated that gap graded asphalt mixtures have a greater amount of aggregate degradation after compaction compared with dense graded asphalt mixtures.PA has a larger proportion of coarse aggregates and higher requirements on the quality of coarse aggregates than that of dense graded mixture.The skeleton of coarse aggregate of PA is potentially more sensitive to the F&E content.However, most agencies required the same F&E content limitation for both dense and open graded mixtures.Only limited research was conducted to evaluate the effects of F&E aggregates on the performance of PA.Therefore, it is of great significance to investigate the effects of F&E contents on the physical and mechanical properties of PA.The role of F&E particles can be evaluated by evaluating the effects of different F&E contents on the performance of PA through laboratory tests.The laboratory tests including volumetric determination, two-dimensional image analysis, Cantabro tests, breakdown tests, and permeability tests, were conducted to evaluate the volumetric properties, the state of stone-on-stone contact, durability, skeleton stability and permeability of PA, respectively.1 Objectives and ScopeThe main objective of this paper is to investigate the influence of the F&E content on the volumetric properties, stone-on-stone contact, durability, aggregate breakdown and permeability of PA.Since every F&E particle was manually picked from different groups of coarse aggregates, four F&E contents (0% (control), original, 30%, and 40%)were considered.Statistical analysis was then conducted to determine whether the F&E content has a significant influence on the performance of PA.In the statistical analysis, the null hypothesis H0: F&E aggregates will not have a significant influence on the volumetric properties, durability, stability and permeability of PA.2 Materials and Mixture Design2.1 MaterialsHigh viscosity polymer-modified asphalt is commonly used in Asian countries to improve the anti-ravelling and high-and-low temperature pared with traditional modified asphalt, high viscosity polymer-modified asphalt has an extremely high dynamic viscosity and soft point.The dynamic viscosity at 60 ℃ is 143 202 Pa·s, and the soft point is 90 ℃Basalt coarse aggregate is used in the mixture.The properties of aggregate are summarized in Tab.1.In this paper, an aggregate is determined to beF&E particles if the ratio of the length to the minimum thickness or width is greater than 3.In order to design a mixture with different F&E contents, F&E and non-F&E particles were manually picked up from the original aggregates one by one, as shown in Fig.1.The original aggregates weredivided into F&E and non-F&E particles by comparing the ratio of the length to minimum thickness or width.Two groups of original 10-15 mm and 5-10 mm coarse aggregates were prepared.As shown in Tab.1, theF&E content of original 10-15 mm and 5-10 mm are 11.2% and 14.0%, respectively.A large amount of aggregates was processed in this study to fabricate a total of 64 specimens.Tab.1 Summary of the properties of original aggregatesPropertyAggregatetype10⁃15mm5⁃10mmBulkspecificgravity2.8482.785Apparentspecificgravity2.9482.971PercentageofF&Eparticles( 3∶1)/%14.011.2LAabrasionloss(Cgrading)/%10.78Crushingvalue/%10.5(a)(b)Fig.1 Different particle shapes of two groups of coarse aggregates.(a)10-15 mm; (b)5-10 mm2.2 Mixture designPA with 13.2 mm nominal aggregate size, mostly used in the drainage pavement wearing course, was used as the control mixture.The mixture design process contains aggregate gradation selection and asphalt content determination.The selection of the PA gradation was mainly based on an evaluation of AV combined with the evaluation of stone-on-stone contact[1].AV should satisfy the minimum requirement of 18% to ensureadequate functionality[11].The state of stone-on-stone contact is required to provide sufficient resistance to permanent deformation and is determined by comparing the AV in the coarse aggregate (VCA)evaluated in the dry-rodded condition (VCADRC)and the compacted PA mixture (VCAmix).The breaking-sieve size is 2.36 mm and the stone-on-stone contact was verified by using a maximum VCAmix/VCADRC ratio (VCA ratio)of 1.0[12].The selected gradation of PA is shown in Tab.2.The mass percent of four aggregate groups of 10-15 mm, 5-10 mm, 0-3 mm, and filler in a specimen are 39%, 43%, 13%, and 5%, respectively.The asphalt content is 4.8% and the VCA ratio is 0.989.A superpave gyratory compactor (SGC)with 50 gyrations was used to fabricate two groups of cylindrical samples with a diameter of 100 mm and approximate height of 63.5 mm, and a diameter of 100 mm and approximate height of 100 mm.Specimens with a length of 300 mm, width of 300 mm, and height of 50mm were fabricated for the permeability test with the same gradation.All of the specimens produced and studied in this paper had the same gradation and asphalt content regardless of the F&E content.Tab.2 The selected gradation ofPASieve/mm1613.29.54.752.361.180.60.075Percentagepassing/ %10090.364.319.314.011.09.14.62.3 F&E content design for mixtureTo evaluate the influence of different F&E contents on the performance of PA, four different F&E contents (0%, original, 30% and 40%)reference to the selected gradation were considered.Each F&E content mix was madeby blending original aggregates, non F&E and F&E particles in various proportions.Assuming that one specimen contains a total mass of 1 100 g aggregates, the composition of each specimen is shown in Tab.3.Tab.3 Composition of mixtures with different F&EcontentsF&EcontentMassof10⁃15mmgroup/gMassof5⁃10mmgroup/gOrigi nalNon⁃F&EF&EOriginalNon⁃F&EF&EMassof0⁃3mmgroup/gMassoffiller/g 0%0429.000473.0014355Original429.000473.0001435530%349.207 9.8372.90100.11435540%299.30129.7319.60153.4143553 Laboratory Tests3.1 Volumetric determinationVolumetric parameters depend on the bulk specific gravity (Gmb)and the theoretical maximum specific gravity of the mixtures (Gmm).Total AV (Atotal)and water-accessible AV (Awater-accessible)are calculated as[13](1)(2)%(3)%(4)where m is the mass of the specimen in air, g; V is the total volume of the specimen which is calcula ted by average height and diameter; ρω is the density of water, g/cm3; Pb is the asphalt content based on mass ofmixture; Gse is the average effective specific gravity of the aggregate; mw is the saturated sample mass in water, g.3.2 Two-dimensional (2-D)image analysisVolumetric and gradation information can be processed using 2-D image analysis to characterize the internal structure of asphaltmixtures[14].Furthermore, aggregate interaction information, such as the number of aggregate contacts, contact length, normal to contact plane orientation, can also be captured from 2-D image analysis to define the state of stone-on-stone contact[15].The influence of F&E contents on the state of stone-on-stone contact was evaluated using 2-D image analysis.2-D image analysis was conducted on MATLAB software by programming a series of algorithms.Adjacent aggregates are defined as contacted if the distance of two aggregates is less than 0.2 mm for PA[16], and the contact length can be obtained.Testing specimens with a diameter of 100 mm and height of 100 mm were fabricated at 50 gyrations of SGC.The specimens were cut into three sections to attain six 2-D images, with one cutting section at the middle of the specimen and two in a distance of 2.5 cm from the middle section (see Fig.2)[15].Image analysis processes are shown in Fig.3.Fig.2 Cutting sections (unit: cm)(a)(b)(c)(d)Fig.3 Image analysis processes.(a)Scanned images of mixtures; (b)Coarse aggregates; (c)Thresholding; (d)Aggregate contact line3.3 Cantabro loss testThe Cantabro loss test can provide an indirect evaluation of mixture cohesion and adhesion.Alvarez et al.[17] compared the Cantabro loss test, Hamburg wheel-tracking test, and overlay test to evaluate the durability of the permeable friction course, and the result recommended the Cantabro loss test as the most appropriate for durability evaluation.The Cantabroloss test was performed by placing a compacted specimen into the Los Angeles (LA)abrasion machine and used the percent of weight loss (Cantabro loss)to evaluate the durability of mixtures.Three different conditioning scenarios (dry, wet, and 7 d aging)were prepared to evaluate the moisture susceptibility and long-term durability of PA.The dry conditioning was performed at room temperature (25 ℃).The wet conditioning involves soaking the specimen in a water bath for 48 h at 60 ℃ and then drying the specimen for 24 h using a fan at room temperature.7d aging was used to investigate the long-term durability of PA which involved aging the specime ns at 60 ℃ in an oven for 7 d and then cooling them at room temperature for 24 h.Cantabro loss was obtained after applying 300 revolutions in the LA abrasion machine and was calculated by %(5)where m is the initial weight; m1 is the retained weight; S is the Cantabro loss, %.For wet specimens, the Cantabro loss was calculated by%(6)where md is the weight after drying to eliminate the water trapped during immersion in water.3.4 Breakdown testIt is believed that mixtures which contain high F&E content have a tendency to break down during compaction.According to Jiang et al.[18], changes in geometrical parameters of aggregate will affect the transmission of load in the asphalt mixture.F&E particles have a tendency to break down during compaction and will affect the overall stress-strain distribution in the asphalt mixture.Aggregate breakdown was tested after compaction with SGC.Each specimen was put into the oven at (538±5)℃ until the mass was fixed.Gradation after ignition oven burn was determined by a sieve analysis, then compared to the design gradation and the percent breakdown calculated[19].3.5 Permeability testA permeability test[20] was performed to evaluate the influence of F&E contents on the permeability of PA.The permeameter was placed on the specimen, and the bottom of the permeameter was sealed with putty to ensure that no water would drain around the outer edges of the specimen (see Fig.4).The test result was reported as the amount of water(mL)penetrating into the specimen within 15 s on average[21].Fig.4 Permeability test4 Results and DiscussionThis section presents the results of four groups (the control, original, 30% F&E content, and 40% F&E content)in terms of volumetric properties, the state of stone-on-stone contact, durability, skeleton stability and permeability.Test results are compared by statistical analysis with a 5% level of significance.4.1 Volumetric propertiesThe volumetric properties of the four groups (the control, original, 30%F&E content, and 40% F&E content)are evaluated in this study and shown in Fig.5.Fig.5(a)shows the total AV of PA versus different F&E contents, and Fig.5(b)shows the water-accessible AV versus the four F&E contents.The total AV with four F&E contents all satisfied the requirement of 18% minimum total AV.Statistical analysis results as shown in Tab.4 indicate that no significant difference was found in total AV values among the control, original, and 30% groups.Meanwhile, no significant differences in water-accessible AV were found for all of the four groups.However, significantly different total AV can be found while F&E content changes up to 40%.This is different from the traditional dense gradedmixtures.Mahboub et al.[22] conducted research to evaluate three groups (0%, 15% F&E content and 40% F&E content)on the volumetric properties of traditional dense graded mixtures.No significant difference was found in volumetric properties of 40% F&E content.In this study, the 40% F&E group has the largest total AV and water-accessible AV.However, previousresearch concluded that the increased AV is false AV created by the fracture of coarse aggregate[23].This can be verified by the later permeability test.(a)(b)Fig.5 Volumetric properties versus change in F&E contents.(a)Total AV; (b)Water-accessible AVTab.4 Statistical analysis of various F&E contents(α=0.05)F&Econtent/%TotalAVWater⁃accessibleAV0Original30400Original 30400NSNSSNSNSNSOriginalNSNSSNSNSNS30NSNSSNSNSNS40SSSNSN SNSNote:Srepresentssignificantdifference;NSrepresentsnosignificantdifference.4.2 Stone-on-stone contactThe number of contact points (NCP)and total contact length (TCL)were chosen to define the state of stone-on-stone contact[15].The area of the analytical image for all specimen sections is 6 500 mm2.The average values of two replicate images for each F&E content are shown in Fig.6.NCP represents the connectivity of the internal aggregate structure.Higher NCP can lead to a better stress distribution with fewer stress concentrations.Longer contact length can increase the friction and interlocking between aggregates[15].TCL and NCP show a good susceptibility to the change of F&E contents.The original group has thelargest value of NCP and TCL, while 40% F&E content mixture is the smallest.The PA of 40% F&E content has the weakest resistance to permanent deformation.Statistical analysis results are presented in Tab.5 and a significant difference was observed in NCP among the four F&E groups.Oduroh et al.[24] concluded that up to 40% of F&E (3∶1)particles could be permitted in a mixture without negative effects on its performance.Apparently, the PA does not agree with this conclusion. Fig.6 Average image analysis results versus change in F&E content Tab.5 Statistical analysis of image analysis results(α=0.05)F&Econtent/%Totalcontactlengt hNumberofcontactpoints0Original 30400Original30400SNSSSSSOriginalSNSNSSSS30NSNSNSSSNS40SNSNSS SNS4.3 DurabilityThe Cantabro loss test results at different conditions and F&E contents are presented in Fig.7.To guarantee the durability of PA, it is recommended that Cantabro loss should not exceed 20% for unaged specimen and 30% for aged specimen[17].Fig.7 indicates that the four F&E groups all satisfied this requirement.Statistical analysis presented in Tab.6 indicates that there are no significant differences in Cantabro loss for dry, wet, and 7 d aging conditions among the control, original, and 30% groups.When the F&E content is up to 40%, significant difference is found under wet and 7 d aging pared with the control group, the Cantabro loss of the 40% group is increased by 77.9%, 128.2% and 97.8% under wet, 7 d aging, and dry conditions, respectively.Therefore, the long-term durabilityand moisture susceptibility of PA will be deteriorated when the F&E content is high.Fig.7 Average cantabro loss for different F&E contentsTab.6 Statistical analysis of various F&E contents(α=0.05)F&Econtent/%DryconditionWetcondition7dagingcondition0Origin al30400Original30400Original30400NSNSNSNSNSSNSNSSOriginalNSNSN SNSNSNSNSNSNS30NSNSNSNSNSNSNSNSNS40NSNSNSSNSNSSNSNS 4.4 BreakdownThe results of the breakdown test are presented in Fig.8, in which strong linear relationships between F&E contents and percent breakdown are observed on the 2.36 mm sieve and 4.75 mm for the PA mixture.The percent breakdown increased significantly with the increase of the F&E content and this trend was reported in previous research[9].As reported by previous research, the percent of aggregate breakdown was 3.0% on the 4.75 mm sieve for dense graded mixture with 30% F&E content[9].In this research, the percent of aggregate breakdown is 6.8% with the same F&E content for the PA mixture.Greater breakdown of 9.1% and 6.3% on 4.75 mm and 2.36 mm are observed for 40% F&E content.Therefore, PA mixture has greater risk of breakdown than dense graded mixture because it has an open graded aggregate structure.High F&E content has a significant influence on the percent breakdown, and this may induce the failure of the aggregate structure.Based on previous studies, F&E contents did not have significant influence on the performance of traditional dense graded mixtures even though they are up to 40%[22, 24].However, the F&Econtents have a significant influence on the performance of the PA, and 40% F&E content seriously reduced the performance of the PA.It can be concluded that the PA is more sensitive to the F&E content than traditional dense graded mixtures.Fig.8 Aggregates percent breakdown versus change in F&E content4.5 PermeabilityThe permeability of PA for the four F&E contents of 0%, original, 30%, and 40% is 74.9, 81.8, 68.6, and 62.3 mL/s, respectively.The lowest permeability satisfies the requirements of minimum 60 mL/s[21].Fig.5 (a)shows that the 40% F&E group has the largest total AV and water-accessible AV.Based on the previous research, permeability increased with the increase of total AV and water-accessible AV[4].However, the 40% F&E group had the lowest permeability in this study.Permeability decreased with the increase of theF&E content because the breakdown greatly increased false voids.As shown in Tab.7, a significant difference can be found for the four F&E groups.F&E content has a significant influence on the permeability, and permeability may constantly deteriorate during long-term operations. Tab.7 Statistical analysis with diff erent F&E contents (α=0.05)F&Econtent/%0Original30400SSSOriginalSSS30SSS40SSS5 Conclusions1)A significant difference in total AV is found as the F&E content reachesup to 40% and the F&E content has no significant influence on the water-accessible AV.However, a significant difference in permeability is found among the four F&E groups.The 40% F&E group has the lowestpermeability even though total AV and water-accessible AV are the largest.This phenomenon can be attributed to the fact that the increased AV created by breakdown is false AV.Therefore, the F&E content has a significant influence on the functionality of the PA.2)2-D image analysis, the Cantabro loss test, and breakdown test were conducted in this study.Results indicate that F&E particles have negative effects on the rutting resistance, long-term durability and skeleton stability.At the same F&E content, the PA was observed to have significant negative effects on the performance while traditional dense graded mixtures did not.PA has greater breakdown than dense graded mixtures, and breakdown exacerbates negative effects.3)From what was discussed above, the PA is more sensitive to F&E particles due to an open graded aggregate skeleton with a larger proportion of coarse aggregates.Specifications should recommend different F&E limitations for PA and traditional dense graded mixtures instead of having the same.References[1]Alvarez A E, Fernandez E M, Epps-Martin A, et parison of permeable friction course mixtures fabricated using asphalt rubber and performance-grade asphalt binders[J].Construction and Building Materials, 2012, 28(1):427-436.DOI:10.1016/j.conbuildmat.2011.08.085.[2]Ma X, Li Q, Cui Y C, et al.Performance of porous asphalt mixture with various additives[J].International Journal of Pavement Engineering, 2016: 1-7.DOI:10.1080/10298436.2016.1175560.[3]Hernandez-Saenz M A, Caro S, Armbula-Mercado E, et al.Mix design, performance and maintenance of permeable friction courses (PFC)in the United States: State of the art[J].Construction and Building Materials, 2016, 111: 358-367.DOI:10.1016/j.conbuildmat.2016.02.053.[4]Mansour T N, Putman B J.Influence of aggregate gradation on the performance properties of porous asphalt mixtures[J].Journal of Materials in Civil Engineering, 2013, 25(2): 281-288.DOI:10.1061/(asce)mt.1943-5533.0000602.[5]Huber G, Jones J, Messersmith P, et al.Contribution of fine aggregate angularity and particle shape to superpave mixtureperformance[J].Transportation Research Record, 1998, 1609(1): 28-35.DOI:10.3141/1609-04.[6]ASTM International.ASTM D4791 Standard test method for flat or elongated particles in coarse aggregate [S].Washington, DC: ASTM, 2009.[7]Cominsky R, Leahy R B, Harrigan E T.Level one mix design: materials selection, compaction, and conditioning, SHRP-A-408 [R].Washington, DC: National Research Council, 1994.[8]Brown E R, Haddock J E, Mallick R B, et al.Development of a mixture design procedure for stone matrix asphalt (SMA)asphalt content, NCAT Report 97-03 [R].Auburn, AL, USA: National Center for Asphalt Technology, 1997.[9]Buchanan M S.Evaluation of the effect of flat and elongated particles on the performance of hot mix asphalt mixtures, NCAT Report 00-03 [R].Auburn, AL, USA: National Center for Asphalt Technology, 2000.[10]Airey G D, Hunter A E, Collop A C.The effect of asphalt mixture gradation and compaction energy on aggregatedegradation[J].Construction and Building Materials, 2008, 22(5): 972-980.DOI:10.1016/j.conbuildmat.2006.11.022.[11]Putman B J.Evaluation of open-graded friction courses: Construction, maintenance, and performance, FHWA-SC-12-04 [R].Clemson, SC, USA: South Carolina Department of Transportation, Clemson University, 2012. [12]Putman B J, Kline L parison of mix design methods for porous asphalt mixtures[J].Journal of Materials in Civil Engineering, 2012, 24(11): 1359-1367.DOI:10.1061/(asce)mt.1943-5533.0000529.[13]Alvarez A E, Martin A E, Estakhri C, et al.Determination of volumetric properties for permeable friction course mixtures[J].Journal of Testing and Evaluation, 2009, 37(1): 1-10.DOI:10.1520/jte101696.[14]Coenen A R, Kutay M E, Sefidmazgi N R, et al.Aggregate structure characterisation of asphalt mixtures using two-dimensional image analysis[J].Road Materials and Pavement Design, 2012, 13(3): 433-454.DOI:10.1080/14680629.2012.711923.[15]Sefidmazgi N R, Tashman L, Bahia H.Internal structure characterization of asphalt mixtures for rutting performance using imaging analysis [J].Road Materials & Pavement Design, 2012,13(Sup 1): 21-37.DOI:10.1080/14680629.2012.657045.[16]Huurman M.Lifetime optimisation tool[R].Delft, the Netherlands: Civil Engineering and Geosciences, Delft University of Technology, 2008. [17]Alvarez A E, Epps-Martin A, Estakhri C, et al.Evaluation of durabilitytests for permeable friction course mixtures[J].International Journal of Pavement Engineering, 2010, 11(1): 49-60.DOI:10.1080/10298430902730539.[18]Jiang J, Ni F, Gao L, et al.Effect of the contact structure characteristics on rutting performance in asphalt mixtures using 2D imaginganalysis[J].Construction and Building Materials, 2017, 136: 426-435.DOI:10.1016/j.conbuildmat.2016.12.210.[19]Herndon D A, Xiao F P, Amirkhanian S, et al.Investigation of Los Angeles value and alternate aggregate gradations in OGFCmixtures[J].Construction and Building Materials, 2016, 110: 278-285.DOI:10.1016/j.conbuildmat.2016.01.008.[20]JTG E20 T0730—2011.Standard test methods of bitumen and bituminous mixtures for highway engineering [S].Beijing: Research Institute of Highway Ministry of Transport, 2011.(in Chinese)[21]Yu B, Jiao L, Ni F, et al.Long-term field performance of porous asphalt pavement in China [J].Road Materials and Pavement Design, 2014, 16(1): 214-226.DOI:10.1080/14680629.2014.944205.[22]Mahboub K C, Oduroh P K, Anderson R M.Hot mix asphalt with fiat and elongated aggregates [C]//Construction and Materials Issues.Houston, TX, USA, 2001: 183-192.DOI:10.1061/40591(269)19.[23]Vavrik W, Fries R, Carpenter S.Effect of flat and elongated coarse aggregate on characteristics of gyratory compactedsamples[J].Transportation Research Record, 1999, 1681: 28-36.DOI:10.3141/1681-04.。
粗集料针片状含量对沥青混合料结构影响纪伦;刘海权;张磊;李俊;贺文栋;修春玉【摘要】为研究引起沥青混合料内部结构差异的因素,提出并测定了不同针片状颗粒含量的沥青混合料结构参数和体积指标.运用工业CT断层成像技术和图像处理技术,采用颜色标尺标注空隙结构,以及Image-Pro Plus 6.0图像处理软件提取计算沥青混合料的空隙率,并测量沥青混合料断面粗集料颗粒的形貌参数,采用面积、纵横比AR1和AR2、主轴偏角均值、颗粒趋向参数Δ和棱角性等参数评价沥青混合料的结构特征.结果表明:针片状颗粒的增加使得沥青混合料毛体积密度减小,空隙率增大,且通过工业CT计算得到的空隙率大于实测空隙率;大孔隙结构主要分布于试件的中下部位,试件顶端空隙较小;随着针片状颗粒的增加,颗粒纵横比期望AR1和AR2线性增加,横断面粗集料颗粒面积和减小,棱角性期望增大,但是对偏角均值和Δ影响不够明显.【期刊名称】《哈尔滨工业大学学报》【年(卷),期】2018(050)009【总页数】7页(P40-46)【关键词】针片状;沥青混合料;体积指标;结构参数;图像处理;细观结构【作者】纪伦;刘海权;张磊;李俊;贺文栋;修春玉【作者单位】哈尔滨工业大学交通科学与工程学院,哈尔滨150090;哈尔滨工业大学交通科学与工程学院,哈尔滨150090;中国路桥工程有限责任公司,北京100011;哈尔滨工业大学交通科学与工程学院,哈尔滨150090;哈尔滨工业大学交通科学与工程学院,哈尔滨150090;山西省交通科学研究院,太原030006;利物浦大学管理学院,利物浦 L693BX【正文语种】中文【中图分类】U414针片状颗粒(或称细长扁平颗粒)是指粗集料颗粒的长度与厚度之比超过3∶1的颗粒[1],沥青混合料中若使用过于细长或扁平针片状颗粒,易造成矿料颗粒之间互相搭接,细小颗粒无法进入,增大集料空隙,在施工中易折断,致使混合料不密实,粘聚性降低,使路面易出现早期破坏[2]. 国内外的学者虽然研究了针片状含量对于沥青混合料性能的影响[3-9],但相关的研究并没有具体清楚描述针片状颗粒与沥青混合料的结构的影响机制.为此,本文基于工业X-Ray CT扫描成像技术和图像处理技术对不同针片状含量的沥青混合料内部结构进行分析和研究,系统地阐释沥青混合料空隙结构、体积指标、结构参数及细观结构中针片状颗粒含量的影响. 基于此研究,可以更好地理解沥青混合料结构中针片状颗粒的角色,以期明确和掌握其与沥青混合料结构和性能的相关性.1 试验概况1.1 原材料沥青采用SBS改性沥青,粗集料和细集料为哈尔滨阿城区生产的安山岩,矿粉为石灰岩磨制的石粉,采用省内某实际工程中使用的纤维. 沥青混合料试件制备之前,先对粗集料和细集料进行筛分,再将4.75 mm以上粗集料中的针片状颗粒挑选出来. 然后将针片状颗粒按照0%、10%、20%、30%、40%、50%的比例进行回配.1.2 最佳沥青用量及试件制备考虑分析的全面性,本文级配选用道路工程中常用的两种典型级配:AC-16和SMA-16级配中值,试验得知,AC-16混合料的最佳沥青用量为4.5%,SMA-16混合料最佳沥青用量为6.2%,纤维用量为0.3%. 沥青混合料试件采用旋转压实仪成型,试件直径100 mm+0.2 mm、高150 mm+0.2 mm.1.3 工业CT扫描技术采用德国Phoenix v|tome|x s微焦点工业CT,如图1所示.(a)仪器外部 (b)扫描试件图1 德国Phoenix v|tome|x s微焦点工业扫描CT Fig.1 Phoenix v|tome|x s micro focus industrial scanning CT made in Germany利用工业CT对AC-16和SMA-16不同针片状颗粒含量的12种沥青混合料试件进行了扫描和重构. 为保证测量的准确性,避免成型的影响,扫描试件为切去试件两端得到Φ100 mm×H150 mm的试件. 采用phoenix datosx 2软件进行重构,同时结合三维可视化软件VG Studio MAX2.2可进行沥青混凝土试件内部结构提取和分析[5]. 图2为试件三维重构效果和断面结构提取过程示意图.(a)三维重构 (b)断面截取 (c)断面截取效果图图2 沥青混凝土扫描试件的三维重构及断面提取过程示意Fig.2 Sketch map of scanning specimen reconstruction and section extraction of asphalt mixture1.4 图像处理技术从二维断面中进行粗集料颗粒的提取,从而对粗集料颗粒的形貌参数进行研究. 本文对粗颗粒的特征图像通过Image-Pro Plus 6.0(以下简称IPP)图像分析处理软件进行的,同时采用该软件测量了粗集料颗粒的长度、面积等以及颗粒等效图形的长度、面积等几何等形貌参数[10]. 提取及测量过程见图3.(a)原图重构 (b)颗粒提取 (c)颗粒形貌参数图3 粗集料颗粒提取及参数获取过程示意图Fig.3 Sketch map of coarse aggregate particleextraction and measurement parameters1.5 参数与因素的显著性检验及相关性分析方法采用方差分析的方法检验针片状含量是否对沥青混合料中的粗集料颗粒体积指标、结构参数产生了显著性影响. 分析中,将F值与临界值比较,如果F大于临界值,说明变量对指标影响显著,反之则影响不显著[11].采用Pearson相关性检验方法检验针片状含量与体积指标、结构参数是否存在线性相关,Pearson相关系数r计算公式为(1)式中:分别为变量x、y的均值,xi、yi分别为变量x、y的第i个观测值.2 针片状含量对沥青混凝土结构影响分析2.1 试件设计空隙结构经过工业CT扫描重构之后其灰度接近于0,且灰度均匀. 因此将空隙结构从扫描后的试件中提取并计算其体积,再将该体积与试件总体积做比值即可得到“扫描空隙率”. 同时采用表干法对试件进行测量,计算了不同针片状含量的沥青混合料的体积指标,见表1(表中“Z”代表AC-16中值级配,“SZ”代表SMA-16中值级配).可见,沥青混合料的空隙率、矿料间隙率、骨料间距随粗集料针片状含量增加而增大;而混合料的毛体积密度、沥青饱和度与之呈负相关.同时发现实测空隙率显著小于“扫描空隙率”,究其原因,认为是因为表干法测定密度时,混合料表面开口空隙的水分流失,从而导致了实测值偏小.表1 不同粗集料针片比的沥青混凝土结构参数Tab. 1 Volume index of asphalt mixture with different flat and elongated particles content of coarse aggregate编号针片比/%毛体积密度/(g·cm-3)实测空隙率/%扫描空隙率/%矿料间隙率/%沥青饱和度/%Z102.4116.506.3116.3960.61Z2102.3957.117.3916.9658.25Z3202.3817.62 7.6917.4456.33Z4302.3797.757.9217.5056.06Z5402.3718.038.9317.8054.94Z6502.3638.339.6318.0653.91SZ102.3974.505.2818.1072.74SZ2102.3615.81 7.5518.9868.07SZ3202.3616.158.2119.1567.86SZ4302.3566.578.1519.5067. 64SZ5402.3456.979.1519.8565.46SZ6502.3397.499.8720.3063.922.2 针片状含量对沥青混合料空隙结构影响分析利用VG Studio MAX2.2进行空隙提取,并采用颜色标尺标注不同体积的空隙结构如图4所示,颜色越红说明空隙越大(图4标尺自下而上,标识的空隙为逐渐增大). 可见,随着针片状颗粒的增加,沥青混合料的空隙结构明显增大. 同时,由于在过程中,采用旋转压实方法制作试件,近于压头的部分容易被压实,而远于压头的部分相反,造成上部出现空隙体积小的结构,下部出现空隙体积大的结构.(a)Z1试件 (b)Z2试件 (c)Z3试件 (d)Z4试件 (e)Z5试件 (f)Z6试件(a)SZ1试件 (b)SZ2试件 (c)SZ3试件 (d)SZ4试件 (e)SZ5试件 (f)SZ6试件图4 不同针片状含量的沥青混凝土三维空隙结构对比Fig.4 Comparison of three-dimensional void structure of asphalt mixtures with different flat and elongated particles content3 针片状对混合料中粗集料形貌特征的影响粗集料的形貌特性的描述参数和位置分布研究较多[12-16],分别用集料的针片度、轮廓棱角的突出程度以及集料表面的粗糙度从轮廓形状、棱角性和表面纹理3个方面分别反映了集料的形貌特征.3.1 针片状对混合料中粗集料纵横比的影响采用IPP分别测量得到了粗集料颗粒最小外接矩形和等效椭圆的长短轴(图3),将长短轴比值分别定义为纵横比AR1和AR2,其中,将集料颗粒最小外接矩形的长轴与短轴的比值称为纵横比AR1,将颗粒等效椭圆的长轴与短轴的比值称为纵横比AR2. 求得沥青混凝土试件的一个二维断面上的所有颗粒纵横比AR1和AR2,其累计分布概率服从三参数威布尔分布,其拟合图像见图5,函数表达式和期望表达式分别为(2)(3)式中:m为形状参数,η尺度参数,γ为位置参数,Ew(t)为函数期望,Γ(m)伽马函数.图5 三参数威布尔函数的纵横比拟合分析Fig.5 Fitting Weibull Function of three parameters of aspect ratio利用式(2)和式(3)求得不同针片状含量沥青混合料断面的粗集料纵横比期望值,作出AR1和AR2期望值随针片比的变化趋势图如图6所示. 由图可知,AR1和AR2和随着针片状颗粒的增加呈现明显的增大趋势,粗集料针片比和纵横比期望值的曲线拟合相关系数都在0.953以上,相关性显著.(a)AC-16针片状含量与纵横比变化图(b)SMA-16针片状含量与纵横比变化图图6 针片状含量与纵横比变化关系图Fig.6 Relationship between the content of the flat and elongated particles and the aspect ratio3.2 针片状含量对混合料中粗集料主轴偏角影响Eyad Masad[10]提出了采用粗集料颗粒主轴偏角(见图3)平均值和趋向参数Δ评价沥青混合料粗颗粒分布一致性,和Δ表达式分别为(4)(5)式中:为主轴偏向角均值;αk为单个颗粒主轴偏向角;N为颗粒个数;Δ值在0~100之间,表示粗集料颗粒主轴分布一致性,数值越大,分布一致性越高.按式(4)、(5)统计AC-16和SMA-16级配不同针片状含量的沥青混合料偏角均值和Δ,如图7、8所示. 采用方差分析进行针片状影响显著性检验,采用Pearson 相关性检验计算针片比和主轴偏角、Δ及相关系数见表2.对比偏角均值统计图7和表2发现,在AC沥青混合料中,针片状颗粒与横断面偏角均值变化之间的方差检验不显著,也不具有线性相关,即横断面偏角均值不受针片状含量的影响或影响不大;纵断面方差检验结果具有显著性,具有正相关性微弱. 在SMA沥青混合料中,横断面偏角均值不受针片状含量的影响或影响不大,纵断面检验结果的显著性反之,但是具有较弱的线性相关性.图7 主轴偏角均值对比Fig.7 Comparison of mean deviation of spindle angle图8 颗粒趋向统计图Fig.8 Grain trend diagram表2 各参数的显著性及相关性检验结果Tab.2 Test results of significance and correlation参数级配类型F临界值(0.05)RP显著性水平横向ΔZ1~Z60.4324.476-0.1130.475—SZ1~SZ65.6162.3490.4890.0000.01纵向ΔZ1~Z615.2314.476-0.2670.087—SZ1~SZ67.7322.3490.0940.437—横向αZ1~Z61.2814.476-0.2960.057—SZ1~SZ61.2472.3490.2400.0440.05纵向αZ1~Z66.5664.4760.3450.0250.05SZ1~SZ66.4542.349-0.2800.0180.05结合图8、表2分析得出,在AC-16沥青混合料中,横断面上,随着针片状掺量增大,颗粒趋向参数Δ变化不大,临界值大于F值,说明前者对后者影响不显著,二者相关性差;纵断面上,后者受前者影响显著,但是二者相关性差. 对于SMA-16沥青混合料,横断面和纵断面上Δ受针片状颗粒掺量影响显著,横断面上具有较好的线性正相关,而纵断面相关性较差.3.3 针片状含量对沥青混合料横断面粗颗粒面积影响采用IPP测得了沥青混合料断面上每个粗集料颗粒的面积,求得每个试件断面的颗粒面积和的平均值汇总见图9,方差分析和相关性分析见表3.表3 面积参数的显著性及相关性检验结果Tab.3 Significance and correlation test results of area parameters级配类型F临界值(0.05)RP显著性水平Z1~Z61.9724.476-0.4490.0030.01SZ1~SZ69.4512.346-0.5780.0000.01由图9和表3可知,沥青混合料横断面上粗集料的平均面积随着粗集料针片状颗粒掺量的增加而减小,当AC-16和SMA-16级配沥青混合料的横断面面积平均值下降了大约10%时,此时粗集料针片状掺量均增加到50%. 产生这种现象的原因是随着针片状颗粒的逐渐增加,空隙逐渐增加,使得粗集料距离变大,在每个断面上粗颗粒面积平均值将会减小. Z1~Z5中,临界值大于F值,说明影响不显著,但是Pearson检验的相关系数大于0.45,且显著线性负相关,显著性水平0.01. SZ1~SZ6中,方差检验临界值小于F值,Pearson相关系数-0.58,说明线性负相关性很好.3.4 针片状含量对沥青混合料颗粒棱角性的影响采用基于颗粒周长计算的棱角性指标,即颗粒的棱角性Ag(P)为颗粒实际周长与等效椭圆的周长的比值的平方,表达式为(6)式中Pr为集料颗粒周长,Pre为等效椭圆周长.图9 粗集料面积对比图Fig.9 Area contrast histogram of coarse aggregate 由表4和图10分析可得,在AC类沥青混合料和SMA类沥青混合料中,棱角性指标Ag(P)均与针片状颗粒含量的变化呈正相关,方差检验结果影响显著. 说明针片状颗粒的增加使得粗集料的不规则增加,进一步使得沥青混合料棱角性期望值增加.表4 棱角性参数的显著性及相关性检验Tab.4 Significance and correlation test of angularity parameter参数级配类型 F临界值(0.05) RP显著性水平棱角性Z1~Z613.9254.4760.4310.0040.01SZ1~SZ66.7762.3490.5370.0000.01图10 棱角性指标变化图Fig.10 Change histogram of angularity index4 结论1)沥青混合料空隙率、矿料间隙率随着集料针片状颗粒含量的增加逐渐增加;而毛体积密度沥青饱和度随之逐渐减小;扫描计算空隙率大于表干法测得的空隙率,试件的中下部位出现大孔隙结构.2)纵横比AR1和AR2累计分布概率服从三参数威布尔分布,其期望值随着针片状含量的增加呈现线性增大.3)在沥青混凝土CT扫描所得的横断面上,粗集料面积平均值随针片状含量的增大而趋于变小,粗集料颗粒的偏角均值基本不变;针片状颗粒对AC-16趋向参数Δ影响不显著,而随着针片状颗粒含量的增加,SMA-16横截面趋向参数Δ增大,纵断面变化不明显.4)棱角性指标累计分布概率服从三参数威布尔分布,其期望值随针片状颗粒的增加逐渐增大.参考文献【相关文献】[1] 谢兆星,李鼎乐,韩森,等.针片状颗粒含量对沥青混合料性能的影响[J].建筑材料学报,2007,10(6):736XIE Zhaoxing, LI Dingle, HAN Sen, et al. Effect of needle particle content on the performance of asphalt mixture [J].Journal of Building Materials, 2007, 10 (6): 736[2] 余志凯,黄刚,胥吉.针片状颗粒含量对沥青混合料路用性能的影响[J].北方交通, 2010(6):14YU Zhikai, HUANG Gang, XU Ji. Effect of needle particle content on road performance of asphalt mixture [J].Northern Communications, 2010 (6): 14[3] VAVRIK W R, FRIES R J, CARPENTER S H, et al. Effect of flat and elongated coarse aggregate on characteristics of gyratory compacted samples[J]. Transportation Research Record Journal of the Transportation Research Board, 1999, 1681(1):28[4] CHEN J S, WONG S Y, LIN K Y. Quantification of movements of flat and elongated particles in hot mix asphalt subject to wheel load test[J]. Materials and Structures, 2005, 38(3):395[5] 王大庆. 细集料几何特征参数的表征及对沥青混合料性能影响研究[D].哈尔滨:哈尔滨工业大学,2013WANG Daqing. Characterization of geometric characteristic parameters of fine aggregate and its influence on performance of asphalt mixture [D]. Harbin:Harbin Institute of Technology, 2013[6] 谭忆秋,纪伦,等.基于X-ray CT的沥青混合料空隙测试精度影响因素分析[J].哈尔滨工业大学学报,2014, 46(6):65TAN Yiqiu, JI Lun, et al. Analysis of influencing factors of asphalt mixture voids accuracy based on X-ray CT [J]. Journal of Harbin Institute of Technology, 2014, 46 (6): 65[7] ALOMARI A A, MASAD E. Analysis of HMA permeability through microstructure characterization and simulation of fluid flow in X-ray CT images[C]// Middle East International Conference on Advances in Civil, Mechanical, and Materials Engineering. Amman, Jordan:[s.n.], 2005: 21[8] WANG L,SUN W, LALLY E M,et al. Application of LADAR in the analysis of aggregate characteristics[M]. Washington DC: The National Academies Press, 2012: 42 [9] ARAMBULA E, MASAD E, MARTIN A E. Influence of air void distribution on the moisture susceptibility of asphalt mixes[J]. Journal of Materials in Civil Engineering, 2007, 19(8): 655[10]MASAD E, MUHUNTHAN B, SHASHIDHAR N, et al. Quantifying laboratory compaction effects on the internal structure of asphalt concrete[J]. Transportation Research Record, 1999(1):179[11]卢纹岱.SPSS统计分析[M].北京:电子工业出版社,2010:301LU Wendai. SPSS statistical analysis of [M].Publishing House of Electronics Industry, 2010:301[12]廖一平.基于数字图像处理的沥青混合料集料形状及分布研究[D].衡阳:南华大学,2015LIAO Yiping. Research on aggregate shape and distribution of asphalt mixture based on digital image processing [D]. Hengyang:University of South China, 2015[13]高磊,解建光,吴成浩,等.基于粗集料形状特征的沥青混合料三维数字试件生成[J].东南大学学报(自然科学版),2017,47(4):793GAO Lei, XIE Jianguang, WU Chenghao, et al. Production of 3D digital specimens of asphalt mixture based on the shape characteristics of coarse aggregate [J]. Journal of Southeast University (Natural Science Edition), 2017,47 (4): 793[14]GONG F, LIU Y, YOU Z, et al. Mineral aggregate morphological evaluation with MATLAB Fourier radial gradient transform analysis[J]. Journal of Testing & Evaluation, 2016, 45(1):20160141[15]GONG F, YAO S, LIU Y, et al. A new method for characterizing coarse aggregate morphology through a MATLAB program[C]//Geo-China International Conference. New York:American Society of Civil Engineers,2016:53[16]LIU Y, GONG F, YOU Z, et al. Aggregate Morphological characterization with 3D optical scanner versus X-Ray computed tomography[J]. Journal of Materials in Civil Engineering, 2018, 30(1):04017248。
针片状颗粒对混凝土的流动性有不利的影响,同时影响石子与砂、胶凝材料等的握裹,对于混凝土来说是有害的东西。
由于受了各种规范的影响,工程界一般认为碎石中针片状颗粒(针片状颗粒以下简称A)含量不得超过15%,甚至有越少越好的看法。
但是,事实上不是这样,一方面,由于从手工转入机械化生产碎石,A含量必然变多,特别是高强度碎石更是如此;另一方面,试验也推翻了上面的看法,试验证明,碎石中A含量在40%~50%时最好,它既不明显地恶化混凝土混合物的和易性等物理性能,又能提高混凝土的强度特性。
控制针片状含量,郑州一帆机械设备有限公司研究发现合理利用圆锥破碎机和反击式破碎机将会对控制针片状物料含量起着至关重要的作用。
(1)选用反击破碎机或圆锥破碎机生产碎石。
反击破碎机是利用冲击方法将岩石击碎,生产出的石料多呈立方体,针片状含量较少。
圆锥破碎机虽属挤压破碎但生产出的碎石针片状亦较少,主要是圆锥破碎机实现了层压破碎,颗粒的破碎不仅发生在颗粒与衬板间,而且发生在颗粒与颗粒之间。
颗粒之间相互挤压使得扁平及长条状颗粒沿其薄的断面断裂,而且每个岩石颗粒在破碎腔中还可以得到多次破碎,因此产品粒度较好,针片状较少;另外圆锥破碎机工作稳定,故障率低,在国外被广泛使用。
(2)合理的破碎筛分工艺流程。
如石料经过颗式破碎机粗碎或中碎后,就直接排到最终产品的成品筛上,小于筛孔尺寸的物料将直接成为最终产品,就增加了针片状含量的比例,可见合理的破碎筛分工艺流程也是减少碎石针片状含量的一种方法。
(3)破碎机稳定、连续的供料。
无论使用何种破碎机生产碎石,都需要稳定、连续的供料,一方面是为了提高产量,另一方面则可减少针片状碎石含量,因为稳定、连续的供料才会使破碎机挤满给料,保证破碎腔内料与料之间相互挤压使得扁平及长条状颗粒沿其薄的断面断裂。
如果供料不充分,不能实现物料与物料之间挤压,一些针片状物料就可能因缺少挤压机会而过早地排出破碎机影响了最终产品质量。
含针片状粗集料及堆砌性能及对混凝土及影响含针片状粗集料的堆砌性能及对混凝土的影响摘要:针片状集料堆砌时符合双组分体系的理论堆砌规律。
掺入适量针片状颗粒,可增大体系的堆砌度。
针片状颗粒堆砌时有很大的机械咬合力,机械咬合力影响混凝土的密实成型,进而影响混凝土的其他性能。
关键词:针片状集料堆砌混凝土The stacking properties and the influence to concrete of the aggregate containing elongated and flaky particlesAbstract:When be piled up, elongated and flaky particles and non- elongated and flaky particles sysyem is in keeping with the theoretical stacking regularity of two-component system, and a ppropriate mixture of elongated and flaky particles and non- elongated and flaky particles will be denser. Elongated and flaky particles is closely related to more frictional resistance. More frictional resistance makes compaction ofconcrete difficult, and then proceed to affect other properties of concrete.Keywords:elongated and flaky particles, aggregate, stackable, concrete《建筑用卵石、碎石》(GB/T14685-2001)规定的粗集料中针片状颗粒含量如下:表1 粗集料中针片状颗粒含量项目指标Ⅰ类Ⅱ类Ⅲ类针片状颗粒(按质量计)/% 5 15 25作者实测,粒径40㎜以下普通机制碎石中针片状颗粒含量大多在15 ~ 40%范围,针片状颗粒在粒径小的集料中的含量相对高些,超出表1范围的集料非常多。
收稿日期))作者简介李秋忠()),男,山东东阿人,硕士,工程师。
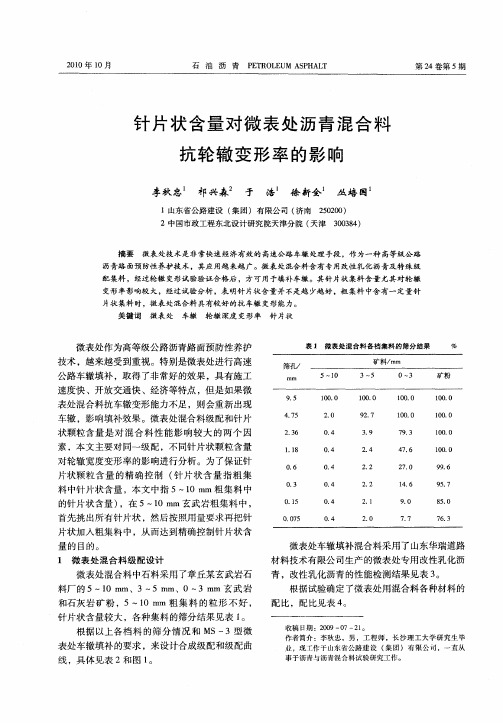
针片状含量对微表处混合料轮辙变形率的影响李秋忠1,扈东升2,李宾1(1.山东省公路建设(集团)有限公司,山东济南250101;2.山东省公路养护工程有限公司,山东济南250200)摘要:用微表处来处理高速公路的车辙是一种经济、快速、有效的技术措施,但是填补车辙的微表处混合料要进行轮辙变形试验验证合格才能使用。
微表处混合料中针片状对轮辙变形率影响较大,经过试验分析,并不是针片状越少越好,粗集料中具有一定量针片状时具有更好的抗车辙变形能力。
关键词:微表处;车辙;轮辙变形率;针片状中图分类号:U414文献标识码:BThe influence of need le and flake con ten t on m i cro-surfaci ng m ixtureru t defor m a ti on rateLI Q i u -z ho ng 1,H U D o ng -s heng 2,LI Bi n1(1.Shan d o ng H igh way Eng i neeri ng Co n s tructio n Gro up Co .,L t d .,Shando ng J in an 250101C hina;2.Shan d o ngP rov i n ceH i gh way M ain t enanceE n g ineeri ng C o .,Lt d.,Shando ng J i nan 250200Ch i na )Ab stract :It is a econo m ica,l f as,t eff ective tec hn icalm easu r es us i ng m i cr o -su rf acing to handle h i ghwayrutti ng ,but the m icro -su rf acing m i xture filli ng t h erutti ng can u se after do i ng the l oad wheel test and qualif y i ng .The n eedle and flake has great i n fl uence on rut def or mati on rate f or m icr o -surf aci ng ,through t h etest analys i s ,not t h e need le and fl ake less t he better ,ith as a better resistance to ru tting with a certa i n a mount ofn eedle and fl ake i n coarse aggr egates .K ey word :m icro -surf aci ng ;r u tting ;r u t def or mationrate ;n eed l e and fl ake引言微表处作为高等级公路预防性养护技术,越来越受到重视。
特别是微表处进行高速公路车辙填补,取得了非常好的效果,具有施工速度快、经济、开放交通快等特点。
但是假如微表处混合料抗车辙变形能力不足,则会重新出现车辙,影响填补效果。
而微表处混合料级配和针片状含量是对混合料性能影响较大的两个因素,本文主要对同一级配,不同针片状含量对轮辙变形率的影响进行分析。
为了保证针片状含量的精确控制(针片状含量指粗集料中针片状含量,本文中指5~10m m 粗集料的针片状含量),5~10mm 玄武岩粗集料中,首先挑出所有针片状,然后按照用量再把针片状加入粗集料中,这样精确控制针片状含量。
1微表处混合料级配设计微表处混合料中石料采用了章丘某玄武岩石料厂的5~10mm 、3~5mm 、0~3m m 玄武岩和石灰岩矿粉,5~10mm 粗集料的粒形不好,针片状含量较大,各种集料的筛分结果见表1。
表1微表处各档集料的筛分结果筛孔矿料(%)5~103~50~3矿粉9.5100.0100.0100.0100.04.752.092.7100.0100.02.360.43.979.3100.01.180.42.447.6100.00.60.42.227.099.60.30.42.214.695.755563)):20100401:19780.10.42.19.08.00.070.42.07.77.18根据以上各档料的筛分情况和M S-3型微表处车辙填补的要求,设计合成级配和级配曲线分别见表2和图1。
表2微表处车辙填补混合料合成级配筛孔矿料(%)5~103~50~3矿粉标级配(%)级配中值(%)级配范围(%)9.5100.0100.0100.0100.0100.0100100~1004.752.092.7100.0100.073.58070~902.360.43.979.3100.049.157.545~701.180.42.447.6100.031.13928~500.60.42.227.099.619.526.519~340.30.42.214.695.712.418.512~250.150.42.19.085.08.912.57~180.0750.42.07.776.37.7105~15配比2614564100图1微表处车辙填补配合比设计级配曲线图微表处车辙填补混合料采用了山东华瑞道路材料技术有限公司生产的微表处专用改性乳化沥青,改性乳化沥青的性能检测结果见表3。
根据试验确定了微表处混合料各种材料的配比,配比见表4。
2不同针片状含量的微表处轮辙变形根据上面确定的微表处车辙填补混合料的级配和配比,采用针片状含量分别为0、5%、10%、15%和20%五个不同的针片状含量分别进行了大量的车辙变形试验,试验方法严格按照交通部公路科学研究院主编的5微表处和稀浆封层技术指南6的附录A6微表处混合料轮辙变形试验进行,试验结果见表5。
表3微表处专用改性乳化沥青试验结果试验项目单位标准试验结果试验方法筛上剩余量(1.18mm 筛)%[0.10T0652电荷阳离子阳离子T0653沥青标准粘度C 25.3S 12~6019T0621蒸发残留物含量%\6063T0651蒸发残留物性质针入度0.1m m 40~10070T0604软化点e \5362T0606延度(5e )c m \20>100T0605溶解度(三氯乙烯)%\97.599.6T0607贮存稳定性1d%[10.7T06555d%[53.4T0655))山东交通科技2010年第3期19表4微表处稀浆混合料组成组分百分数(%)矿料100425号水泥1.0水(自来水)6.0改性乳化沥青9表5不同针片状含量的微表处混合料轮辙变形率针片状含量(%)轮辙变形率(%)016.1216.8316.3716.44514.1813.9214.814.3104.894.124.854.621512.5911.6711.8612.042018.4217.3517.2717.68图2微表处混合料针片状含量对轮辙变形率的影响根据5微表处和稀浆封层技术指南6中对微表处混合料的技术要求来看,要求轮辙宽度变形率PLD[5%,只有10%的针片状含量的微表处混合料轮辙变形率为4.62%<5%的技术要求。
这也说明并不是微表处混合料中针片状含量越少越好,其抵抗轮辙变形的能力越强,而是混合料中应该具有一定量的针片状含量时抵抗轮辙变形的能力最好。
本文中使用的石料和级配中表明,针片状含量为10%时,其抵抗轮辙变形的能力最好。
不同的石料,不同的级配,针片状含量的多少其抵抗变形的能力会有所不同。
混合料中抵抗轮辙变形能力主要是由其抗剪强度所决定的,抗剪强度主要是由混合料的内摩擦角、粘接力和内部的法向应力来决定,即:S=c+RtgU (1)………………式中:S )沥青混合料在某一平面上产生的剪切力,MP a;c )沥青混合料的粘结力,MP a;U)沥青混合料的内摩擦角;R)法向应力。
沥青混合料抗剪强度由两部分组成:一是沥青结合料的粘聚力;二是大小不同的集料颗粒嵌挤、摩擦产生的摩阻力。
其中粘聚力主要取决于沥青性能、用量、温度、细料含量以及沥青与集料的粘附性;摩阻力主要取决于集料组成、级配等因素。
其中级配对抗剪强度的影响显著,合理的级配设计可以有效提高抗剪强度,级配中具有一定的针片状,可以增加混合料的内摩擦角,由于玄武岩石料的硬度较大,做轮辙变形试验时,不容易被压碎或折断,所以其抗剪强度要大于一点针片状没有的混合料。
而针片状过多时,混合料不密实,碾压的过程中容易导致部分针片状被压断,从而轮辙变形过大。
3结语微表处作为高等级公路预防性养护技术在国外应用非常广泛,并且取得了非常好的效果。
目前国内已经有十几个省份用微表处对高等级公路进行了预防性养护,均取得了不错的效果。
使用微表处进行高速公路路面车辙修补是一种十分经济、快速的处理措施,但是混合料的级配设计非常重要。
本试验研究说明,微表处混合料中并不是针片状含量越少越好,而是混合料中具有一定量的针片状时,其抵抗轮辙变形的能力最强。
通过这个试验,也改变大家对混合料针片状的错误认识,并不是粗集料的针片状含量越少越好,也不是针片状越多越好,而是在混合料中具有一定量的针片状时,混合料的抗剪强度最大,抵抗变形的能力最强。
参考文献:[1]徐剑.沥青路面微表处养护技术的研究[D].南京:东南大学,2002.[2]交通部公路科学院.微表处和稀浆封层技术指南[M ].北京:人民交通出版社,2006.[3]国际稀浆表面摊铺协会.I SS A 微表处推荐施工指南A143(修订版)[S].北京:人民交通出版社,2005.[]张文浩微表处技术在高速公路养护中的应用研究[D]南京东南大学,3))李秋忠,扈东升,李宾:针片状含量对微表处混合料轮辙变形率的影响4..:200.20。