空间统计学软件包
- 格式:ppt
- 大小:945.50 KB
- 文档页数:37

空间计量经济学三⼗年(1979-2009)空间计量经济学创造性地处理了经典计量⽅法在⾯对空间数据时的缺陷,在传统的横截⾯以及⾯板数据基础上引⼊空间数据,进⽽对其进⾏空间相关分析和空间结构分析。
近年来在⼈⽂社会科学空间转向的⼤背景下,空间计量已成为空间综合⼈⽂学和社会科学研究的基础理论与⽅法,尤其在区域经济、房地产、环境、⼈⼝、旅游、地理、政治等领域,空间计量成为开展定量研究的必备技能。
本⽂主要为⼤家介绍空间计量发展三个阶段,空间计量模型等内容。
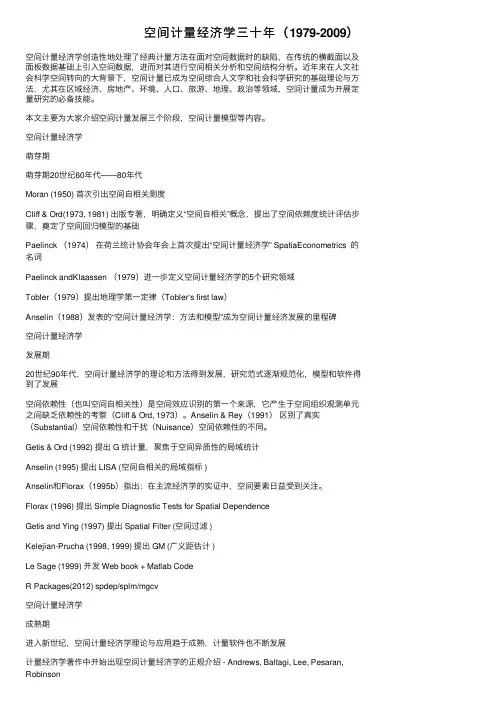
空间计量经济学萌芽期萌芽期20世纪60年代——80年代Moran (1950) ⾸次引出空间⾃相关测度Cliff & Ord(1973, 1981) 出版专著,明确定义“空间⾃相关”概念,提出了空间依赖度统计评估步骤,奠定了空间回归模型的基础Paelinck (1974)在荷兰统计协会年会上⾸次提出“空间计量经济学” SpatiaEconometrics 的名词Paelinck andKlaassen (1979)进⼀步定义空间计量经济学的5个研究领域Tobler(1979)提出地理学第⼀定律(Tobler‘s first law)Anselin(1988)发表的“空间计量经济学:⽅法和模型”成为空间计量经济发展的⾥程碑空间计量经济学发展期20世纪90年代,空间计量经济学的理论和⽅法得到发展,研究范式逐渐规范化,模型和软件得到了发展空间依赖性(也叫空间⾃相关性)是空间效应识别的第⼀个来源,它产⽣于空间组织观测单元之间缺乏依赖性的考察(Cliff & Ord, 1973)。
Anselin & Rey(1991)区别了真实(Substantial)空间依赖性和⼲扰(Nuisance)空间依赖性的不同。
Getis & Ord (1992) 提出 G 统计量,聚焦于空间异质性的局域统计Anselin (1995) 提出 LISA (空间⾃相关的局域指标 )Anselin和Florax(1995b)指出:在主流经济学的实证中,空间要素⽇益受到关注。

第10章空间统计分析空间统计分析是一种地理信息系统(GIS)中的工具和方法,用于研究和分析地理现象的空间分布模式。
它结合了统计学和地理学的原理,能够帮助我们理解和解释地理现象之间的关系,并为决策制定者提供有关地理现象的更全面和准确的信息。
本章将介绍空间统计分析的基本概念、常用方法和应用案例。
空间统计分析的基本概念包括空间自相关、空间聚集和空间差异。
空间自相关指的是地理现象在空间上的相似性和相关性,例如城市人口分布的集中性和扩散性。
空间聚集是指地理现象在空间上的聚集和集群现象,例如城市的主要商业区域和住宅区域。
空间差异是指地理现象在空间上的差异和变化,例如不同地区的气候和生态环境的差异。
常用的空间统计分析方法包括空间自相关分析、空间插值分析和空间聚类分析。
空间自相关分析通过计算地理现象之间的相似性和相关性来研究其空间分布模式,例如计算城市之间的距离和相关性。
空间插值分析通过将已知的地理现象数据点推算到未知的区域,来估计未知区域的数值,例如将气温观测点的数据插值到整个地区。
空间聚类分析通过计算地理现象之间的距离和相似性来研究其聚集和集群现象,例如将商业建筑和住宅区域进行聚类分析。
空间统计分析在很多领域有广泛的应用。
在城市规划和土地利用方面,空间统计分析可以帮助我们了解不同地区的人口分布、经济活动和交通状况,从而指导城市规划和土地开发。
在环境保护和资源管理方面,空间统计分析可以帮助我们了解不同地区的生态环境和自然资源的分布,从而制定有效的环保和资源管理策略。
在流行病学和卫生地理学方面,空间统计分析可以帮助我们了解不同地区的疾病传播和健康状况,从而指导公共卫生政策和疾病预防控制。
总之,空间统计分析是一种有助于我们理解和解释地理现象的工具和方法。
它能够帮助我们揭示地理现象之间的关系和模式,为决策制定者提供有关地理现象的更全面和准确的信息。
通过空间统计分析,我们能够更好地理解和管理我们的地球。

qgis中生成克里金插值算法在QGIS中生成克里金插值(Kriging)算法是一个用于空间数据分析和预测的强大工具。
克里金插值是一种基于统计学的地理插值方法,它考虑了数据点的空间自相关性和变异性,以生成平滑且准确的插值表面。
下面是在QGIS中使用克里金插值算法的详细步骤:首先,确保你已经安装了QGIS软件,并且具备一些空间数据分析的基础知识。
然后,按照以下步骤进行操作:准备数据:首先,你需要准备一个包含空间坐标和相应属性值的点数据集。
这些点应该是你希望进行插值的数据样本。
打开QGIS并加载数据:启动QGIS软件,并将你的点数据集加载到地图上。
你可以通过“图层”菜单中的“添加图层”选项来加载数据。
选择克里金插值工具:在QGIS的工具箱中,找到“栅格化”或“插值”工具组,并选择“克里金插值”工具。
这通常位于“栅格”或“分析”工具箱中。
配置克里金插值参数:打开克里金插值工具后,你需要配置一些参数来定义插值过程。
这些参数可能包括输入点图层、输出栅格分辨率、插值字段、变异函数模型等。
根据你的具体需求和数据特点,合理设置这些参数。
运行克里金插值:配置好参数后,点击“运行”或“确定”按钮来开始克里金插值过程。
QGIS将根据你的设置和输入数据,使用克里金算法生成一个插值栅格图层。
查看和评估结果:一旦插值完成,你可以在QGIS中查看生成的栅格图层。
你可以使用不同的可视化工具来评估插值结果的准确性和平滑度。
如果需要,你还可以对插值参数进行调整并重新运行插值过程,以获得更好的结果。
通过以上步骤,你可以在QGIS中使用克里金插值算法来生成平滑且准确的插值表面。
克里金插值是一种强大的空间分析工具,适用于各种地理数据分析和预测任务。


统计学中的空间统计分析与地理信息系统在统计学中,空间统计分析与地理信息系统(GIS)是两个密切相关的领域,它们提供了一种更加全面的数据分析方法,可以用于研究地理现象和空间关联性。
本文将探讨空间统计分析与地理信息系统的基本概念、应用和方法。
一、空间统计分析的概念和应用空间统计分析是统计学中的一个分支领域,它主要研究在地理空间中的数据分布、空间关联性和空间模式等问题。
这一方法可以帮助我们更好地理解地理现象,揭示地理空间的规律和特征。
空间统计分析可以应用于多个领域,例如城市规划、环境保护、资源管理等。
以城市规划为例,通过空间统计分析,我们可以确定城市中不同区域的人口密度、土地利用情况等,从而有针对性地制定城市发展规划。
在环境保护方面,空间统计分析可以帮助我们分析污染物的空间分布,找出污染源和受影响的区域,为环境治理提供科学依据。
二、地理信息系统的概念和应用地理信息系统(GIS)是一种用来收集、存储、管理、分析和展示地理空间数据的工具和技术。
它将地理数据与空间统计分析相结合,提供了一种空间数据处理和可视化的方法。
GIS可以应用于多个领域,例如地质勘探、交通规划、灾害管理等。
在地质勘探中,GIS可以帮助我们收集和管理地质数据,分析地质特征,为矿产资源开发提供支持。
在交通规划中,GIS可以帮助我们分析道路网络、交通流量等数据,优化交通系统的布局和设计。
在灾害管理中,GIS可以用来分析地震、洪水等自然灾害的分布和影响范围,提供灾害应对和救援的决策依据。
三、空间统计分析与地理信息系统的方法空间统计分析与地理信息系统的结合为我们提供了多种方法和技术,用来处理和分析地理空间数据。
以下是一些常用的方法:1. 空间插值:通过已知数据点来对未知区域的数据进行预测和估计,常用的插值方法包括距离加权法、克里金插值法等。
2. 空间聚类分析:用于识别地理空间中的聚类和簇群现象,常用的聚类算法包括DBSCAN、K均值等。
3. 空间回归分析:用于分析地理空间中的因果关系和影响因素,常用的回归方法包括空间滤波器模型、空间误差模型等。

引言SPM(statistical parametric mapping)一个通用软件包。
它的理论和思想最初是由英国的Karl Friston在1991年提出的,当时是为了处理PET功能成像数据。
到了1994年Karl Friston推出SPM的第一个正式版SPM 94,后来的SPM 95(从这个版本开始能够对fMRI数据做处理)、SPM 96,一直到现在的SPM 99都是在SPM 94的基础上加入新的算法和理论开发出来的。
它的主要目的是对被试间或者被试内的不同成像结果作比较,得出一个具有统计学意义的结果,SPM处理过程中的每一步都是为了实现这个目的。
SPM指的是统计参数图像,也就是这个软件的最终输出。
它对所有成像数据的每一个像素点都分别计算,得出包含有每个像素点参数值的图像,这个参数图像是许多单次扫描图像所包含信息的精简和压缩。
这样有利于我们读取和理解。
它的主要贡献是解决了不同图像数据间的比较问题,给出了具有统计学意义的结果对大多数的成像技术(比如fMRI,PET,EEG 等)所得的数据,我们都会遇到两个关键的问题,第一是不知道应该用什么统计模型来处理分析。
这是因为我们不知道所采集数据的分布形式,再加上这些技术的空间分辨率不够高,使得每个体素都包含了周围组织的信息,数据预处理过程中的对齐,又使得每个体素和周围的体素产生了更大的关联。
由于这些原因,我们就不能用普通的统计分布模型(比如泊松分布,高斯分布等)来处理这些数据。
第二个问题是,由于体素之间的关联性,我们在做多组图像数据的比较时,有必要对结果做矫正。
传统的方法是Bonferroni矫正,由于Bonferroni矫正主要应用于互不关联数据的统计计算,现在把它用到脑功能成像数据的处理当中,就会使得所输出的结果非常保守,在统计参数图像上几乎得不到明显的激活区。
SPM给出了一种行之有效的统计方法———随机高斯场(random gaussian field),利用这个理论就能对不同的图像数据做统计学上的比较,其具体的应用就是对图像数据做高斯平滑滤波。

空间统计学是一门研究具有空间分布特征数据的统计分析理论和
方法的应用学科。
它充分利用空间和空间关系(如距离、面积、体积、长度、高度、方向、中心性等数据空间特征)进行数学建模和计算。
该学科应用广泛,涵盖了模式分析、形状分析、表面建模和表面预测、空间回归、空间数据集的统计比较、空间相互作用的统计建模和预测等多个方面。
为了更好地理解空间统计学,我们首先需要了解其涉及的统计方法。
这些方法包括描述性统计、推论性统计、探索性统计、地统计学和经济计量统计等。
描述性统计主要是对数据进行整理和描述,如计算平均数、中位数、众数等统计指标;推论性统计则是基于样本数据推断总体特征,如进行回归分析和假设检验;探索性统计则是通过绘制图表、计算相关系数等方式探索数据之间的关系;地统计学则是研究地理现象的空间变异性和空间结构的方法论学科;经济计量统计则是利用数学和统计学方法对经济数据进行建模和分析。
空间统计学在各个领域都有广泛的应用。
例如,在地理学中,可以利用空间统计学研究地理现象的空间分布和变化规律;在环境科学中,可以利用空间统计学对环境数据进行建模和分析,探究环境问题与人类活动之间的关系;在城市规划中,可以利用空间统计学对城市空间布局和城市发展进行预测和评估;在经济学中,可以利用空间统计学对经济数据进行空间分析和建模,探究经济发展规律和趋势。
总之,空间统计学是一门具有广泛应用价值的学科。
通过学习和掌握空间统计学的理论和方法,我们可以更好地处理和分析具有空间分
布特征的数据,为各个领域的科学研究和实践工作提供有力支持。
如需更全面准确的信息,建议查阅空间统计学相关的专业资料,或者咨询该领域的专家学者。

空间统计分析方法比较在地理信息系统(GIS)和统计学的交叉领域,空间统计分析是一项重要且不断发展的研究领域。
它涉及了空间数据的获取、处理和分析,以帮助我们理解和解释地理现象。
本文将比较几种常见的空间统计分析方法,包括空间自相关、空间插值以及空间聚类。
一、空间自相关空间自相关是用来衡量地理现象在空间上的相关程度。
基于空间自相关的方法包括Moran's I和Geary's C。
Moran's I是一种广泛使用的指标,它可以测量地理现象的聚集性和离散性。
它通过计算每个观测值与其周围观测值的空间关系来确定空间自相关。
值越接近1,表示正相关;值越接近-1,表示负相关;值越接近0,表示无相关性。
Geary's C与Moran's I类似,也可以衡量空间自相关性,但其计算方式略有不同。
空间自相关的结果可以告诉我们一个地理现象在空间上是如何分布的,是否存在聚集现象。
通过对比Moran's I和Geary's C的结果,我们可以更全面地了解空间相关性的特征。
二、空间插值空间插值是利用已知数据点的信息来估计未知位置的值。
在GIS中,这种方法常用于生成等值线图或栅格图。
最常见的空间插值方法包括反距离加权法(IDW)、克里金法和径向基函数插值法(RBF)。
IDW根据距离权重来进行插值。
在计算要插值点的值时,IDW方法会取周围已知点的值,并根据距离对这些值进行加权平均。
这样,距离较近的点会对插值结果有更大的影响力。
克里金法是一种基于统计学的插值方法,它假设变量在空间上具有某种空间相关结构。
克里金法通过拟合半方差函数来估计空间上每个位置的值。
RBF插值法则是利用径向基函数来进行插值。
它将已知点的值用基函数的线性组合来表达。
这种方法的优势在于可以处理非线性的空间相关性。
不同的空间插值方法适用于不同的数据特点和研究需求。
通过比较它们的结果,我们可以选择最合适的方法来推断未知位置的值。
population 母体sample 样本census 普查sampling 抽样quantitative 量的qualitative/categorical质的discrete 离散的continuous 连续的population parameters 母体参数sample statistics 样本统计量descriptive statistics 叙述统计学inferential/inductive statistics 推论 ...抽样调查(sampliing survey单纯随机抽样(simple random sampling 系统抽样(systematic sampling分层抽样(stratified sampling整群抽样(cluster sampling多级抽样(multistage sampling常态分配(Parametric Statistics)无母数统计学(Nonparametric Statistics) 实验设计(Design of Experiment)参数(Parameter)Data analysis 资料分析Statistical table 统计表Statistical chart 统计图Pie chart 圆饼图Stem-and-leaf display 茎叶图Box plot 盒须图Histogram 直方图Bar Chart 长条图Polygon 次数多边图Ogive 肩形图Descriptive statistics 叙述统计学Expectation 期望值Mode 众数Mean 平均数Variance 变异数Standard deviation 标准差Standard error 标准误Covariance matrix 共变异数矩阵Inferential statistics 推论统计学Point estimation 点估计Interval estimation 区间估计Confidence interval 信赖区间Confidence coefficient 信赖系数Testing statistical hypothesis 统计假设检定Regression analysis 回归分析Analysis of variance 变异数分析Correlation coefficient 相关系数Sampling survey 抽样调查Census 普查Sampling 抽样Reliability 信度Validity 效度Sampling error 抽样误差Non-sampling error 非抽样误差Random sampling 随机抽样Simple random sampling 简单随机抽样法Stratified sampling 分层抽样法Cluster sampling 群集抽样法Systematic sampling 系统抽样法Two-stage random sampling 两段随机抽样法Convenience sampling 便利抽样Quota sampling 配额抽样Snowball sampling 雪球抽样Nonparametric statistics 无母数统计The sign test 等级检定Wilcoxon signed rank tests 魏克森讯号等级检定Wilcoxon rank sum tests 魏克森等级和检定Run test 连检定法Discrete uniform densities 离散的均匀密度Binomial densities 二项密度Hypergeometric densities 超几何密度Poisson densities 卜松密度Geometric densities 几何密度Negative binomial densities 负二项密度Continuous uniform densities 连续均匀密度Normal densities 常态密度Exponential densities 指数密度Gamma densities 伽玛密度Beta densities 贝他密度Multivariate analysis 多变量分析Principal components 主因子分析Discrimination analysis 区别分析Cluster analysis 群集分析Factor analysis 因素分析Survival analysis 存活分析Time series analysis 时间序列分析Linear models 线性模式Quality engineering 品质工程Probability theory 机率论Statistical computing 统计计算Statistical inference 统计推论Stochastic processes 随机过程Decision theory 决策理论Discrete analysis 离散分析Mathematical statistics 数理统计统计学: Statistics母体: Population样本: Sample资料分析: Data analysis统计表: Statistical table统计图: Statistical chart圆饼图: Pie chart茎叶图: Stem-and-leaf display盒须图: Box plot直方图: Histogram长条图: Bar Chart次数多边图: Polygon肩形图: Ogive叙述统计学: Descriptive statistics 期望值: Expectation众数: Mode平均数: Mean变异数: Variance标准差: Standard deviation标准误: Standard error共变异数矩阵: Covariance matrix推论统计学: Inferential statistics点估计: Point estimation区间估计: Interval estimation信赖区间: Confidence interval信赖系数: Confidence coefficient统计假设检定: Testing statisticalhypothesis回归分析: Regression analysis变异数分析: Analysis of variance相关系数: Correlation coefficient抽样调查: Sampling survey普查: Census抽样: Sampling信度: Reliability效度: Validity抽样误差: Sampling error非抽样误差: Non-sampling error随机抽样: Random sampling简单随机抽样法: Simple randomsampling分层抽样法: Stratified sampling群集抽样法: Cluster sampling系统抽样法: Systematic sampling两段随机抽样法: Two-stage randomsampling便利抽样: Convenience sampling配额抽样: Quota sampling雪球抽样: Snowball sampling无母数统计: Nonparametric statistics等级检定: The sign test魏克森讯号等级检定: Wilcoxon signedrank tests魏克森等级和检定: Wilcoxon rank sumtests连检定法: Run test离散的均匀密度: Discrete uniformdensities二项密度: Binomial densities超几何密度: Hypergeometric densities卜松密度: Poisson densities几何密度: Geometric densities负二项密度: Negative binomial densities连续均匀密度: Continuous uniformdensities常态密度: Normal densities指数密度: Exponential densities伽玛密度: Gamma densities贝他密度: Beta densities多变量分析: Multivariate analysis主因子分析: Principal components区别分析: Discrimination analysis群集分析: Cluster analysis因素分析: Factor analysis存活分析: Survival analysis时间序列分析: Time series analysis线性模式: Linear models品质工程: Quality engineering机率论: Probability theory统计计算: Statistical computing统计推论: Statistical inference随机过程: Stochastic processes决策理论: Decision theory离散分析: Discrete analysis数理统计: Mathematical statistics统计名词市调辞典众数(Mode) 普查(census)指数(Index) 问卷(Questionnaire)中位数(Median) 信度(Reliability)百分比(Percentage) 母群体(Population)信赖水准(Confidence level) 观察法(Observational Survey)假设检定(Hypothesis Testing) 综合法(Integrated Survey)卡方检定(Chi-square Test) 雪球抽样(Snowball Sampling)差距量表(Interval Scale) 序列偏差(Series Bias)类别量表(Nominal Scale) 次级资料(Secondary Data)顺序量表(Ordinal Scale) 抽样架构(Sampling frame)比率量表(Ratio Scale) 集群抽样(Cluster Sampling)连检定法(Run Test) 便利抽样(Convenience Sampling)符号检定(Sign Test) 抽样调查(SamplingSur)算术平均数(Arithmetic Mean) 非抽样误差(non-sampling error)展示会法(Display Survey)调查名词准确效度(Criterion-RelatedValidity)元素(Element) 邮寄问卷法(Mail Interview)样本(Sample) 信抽样误差(Sampling error)效度(Validity) 封闭式问题(Close Question)精确度(Precision) 电话访问法(TelephoneInterview)准确度(Validity) 随机抽样法(RandomSampling)实验法(Experiment Survey)抽样单位(Sampling unit) 资讯名词市场调查(Marketing Research) 决策树(Decision Trees)容忍误差(Tolerated erro) 资料采矿(DataMining)初级资料(Primary Data) 时间序列(Time-Series Forecasting)目标母体(Target Population) 回归分析(Regression)抽样偏差(Sampling Bias) 趋势分析(TrendAnalysis)抽样误差(sampling error) 罗吉斯回归(Logistic Regression)架构效度(Construct Validity) 类神经网络(Neural Network)配额抽样(Quota Sampling) 无母数统计检定方法(Non-Parametric Test)人员访问法(Interview) 判别分析法(Discriminant Analysis)集群分析法(cluster analysis) 规则归纳法(Rules Induction)内容效度(Content Validity) 判断抽样(Judgment Sampling)开放式问题(Open Question) OLAP(OnlineAnalytical Process)分层随机抽样(Stratified Randomsampling) 资料仓储(Data Warehouse)非随机抽样法(Nonrandom Sampling) 知识发现(Knowledge DiscoveryAbsolute deviation, 绝对离差Absolute number, 绝对数Absolute residuals, 绝对残差Acceleration array, 加速度立体阵Acceleration in an arbitrary direction, 任意方向上的加速度Acceleration normal, 法向加速度Acceleration space dimension, 加速度空间的维数Acceleration tangential, 切向加速度Acceleration vector, 加速度向量Acceptable hypothesis, 可接受假设Accumulation, 累积Accuracy, 准确度Actual frequency, 实际频数Adaptive estimator, 自适应估计量Addition, 相加Addition theorem, 加法定理Additive Noise, 加性噪声Additivity, 可加性Adjusted rate, 调整率Adjusted value, 校正值Admissible error, 容许误差Aggregation, 聚集性Alpha factoring,α因子法Alternative hypothesis, 备择假设Among groups, 组间Amounts, 总量Analysis of correlation, 相关分析Analysis of covariance, 协方差分析Analysis Of Effects, 效应分析Analysis Of Variance, 方差分析Analysis of regression, 回归分析Analysis of time series, 时间序列分析Analysis of variance, 方差分析Angular transformation, 角转换ANOVA (analysis of variance), 方差分析ANOVA Models, 方差分析模型ANOVA table and eta, 分组计算方差分析Arcing, 弧/弧旋Arcsine transformation, 反正弦变换Area 区域图Area under the curve, 曲线面积AREG , 评估从一个时间点到下一个时间点回归相关时的误差ARIMA, 季节和非季节性单变量模型的极大似然估计Arithmetic grid paper, 算术格纸Arithmetic mean, 算术平均数Arrhenius relation, 艾恩尼斯关系Assessing fit, 拟合的评估Associative laws, 结合律Asymmetric distribution, 非对称分布Asymptotic bias, 渐近偏倚Asymptotic efficiency, 渐近效率Asymptotic variance, 渐近方差Attributable risk, 归因危险度Attribute data, 属性资料Attribution, 属性Autocorrelation, 自相关Autocorrelation of residuals, 残差的自相关Average, 平均数Average confidence interval length, 平均置信区间长度Average growth rate, 平均增长率Bar chart, 条形图Bar graph, 条形图Base period, 基期Bayes' theorem , Bayes定理Bell-shaped curve, 钟形曲线Bernoulli distribution, 伯努力分布Best-trim estimator, 最好切尾估计量Bias, 偏性Binary logistic regression, 二元逻辑斯蒂回归Binomial distribution, 二项分布Bisquare, 双平方Bivariate Correlate, 二变量相关Bivariate normal distribution, 双变量正态分布Bivariate normal population, 双变量正态总体Biweight interval, 双权区间Biweight M-estimator, 双权M估计量Block, 区组/配伍组BMDP(Biomedical computer programs),BMDP统计软件包Boxplots, 箱线图/箱尾图Breakdown bound, 崩溃界/崩溃点Canonical correlation, 典型相关Caption, 纵标目Case-control study, 病例对照研究Categorical variable, 分类变量Catenary, 悬链线Cauchy distribution, 柯西分布Cause-and-effect relationship, 因果关系Cell, 单元Censoring, 终检Center of symmetry, 对称中心Centering and scaling, 中心化和定标Central tendency, 集中趋势Central value, 中心值CHAID -χ2 Automatic Interaction Detector,卡方自动交互检测Chance, 机遇Chance error, 随机误差Chance variable, 随机变量Characteristic equation, 特征方程Characteristic root, 特征根Characteristic vector, 特征向量Chebshev criterion of fit, 拟合的切比雪夫准则Chernoff faces, 切尔诺夫脸谱图Chi-square test, 卡方检验/χ2检验Choleskey decomposition, 乔洛斯基分解Circle chart, 圆图Class interval, 组距Class mid-value, 组中值Class upper limit, 组上限Classified variable, 分类变量Cluster analysis, 聚类分析Cluster sampling, 整群抽样Code, 代码Coded data, 编码数据Coding, 编码Coefficient of contingency, 列联系数Coefficient of determination, 决定系数Coefficient of multiple correlation, 多重相关系数Coefficient of partial correlation, 偏相关系数Coefficient of production-moment correlation, 积差相关系数Coefficient of rank correlation, 等级相关系数Coefficient of regression, 回归系数Coefficient of skewness, 偏度系数Coefficient of variation, 变异系数Cohort study, 队列研究Collinearity, 共线性Column, 列Column effect, 列效应Column factor, 列因素Combination pool, 合并Combinative table, 组合表Common factor, 共性因子Common regression coefficient, 公共回归系数Common value, 共同值Common variance, 公共方差Common variation, 公共变异Communality variance, 共性方差Comparability, 可比性Comparison of bathes, 批比较Comparison value, 比较值Compartment model, 分部模型Compassion, 伸缩Complement of an event, 补事件Complete association, 完全正相关Complete dissociation, 完全不相关Complete statistics, 完备统计量Completely randomized design, 完全随机化设计Composite event, 联合事件Composite events, 复合事件Concavity, 凹性Conditional expectation, 条件期望Conditional likelihood, 条件似然Conditional probability, 条件概率Conditionally linear, 依条件线性Confidence interval, 置信区间Confidence limit, 置信限Confidence lower limit, 置信下限Confidence upper limit, 置信上限Confirmatory Factor Analysis , 验证性因子分析Confirmatory research, 证实性实验研究Confounding factor, 混杂因素Conjoint, 联合分析Consistency, 相合性Consistency check, 一致性检验Consistent asymptotically normal estimate,相合渐近正态估计Consistent estimate, 相合估计Constrained nonlinear regression, 受约束非线性回归Constraint, 约束Contaminated distribution, 污染分布Contaminated Gausssian, 污染高斯分布Contaminated normal distribution, 污染正态分布Contamination, 污染Contamination model, 污染模型Contingency table, 列联表Contour, 边界线Contribution rate, 贡献率Control, 对照, 质量控制图Controlled experiments, 对照实验Conventional depth, 常规深度Convolution, 卷积Corrected factor, 校正因子Corrected mean, 校正均值Correction coefficient, 校正系数Correctness, 正确性Correlation coefficient, 相关系数Correlation, 相关性Correlation index, 相关指数Correspondence, 对应Counting, 计数Counts, 计数/频数Covariance, 协方差Covariant, 共变Cox Regression, Cox回归Criteria for fitting, 拟合准则Criteria of least squares, 最小二乘准则Critical ratio, 临界比Critical region, 拒绝域Critical value, 临界值Cross-over design, 交叉设计Cross-section analysis, 横断面分析Cross-section survey, 横断面调查Crosstabs , 交叉表Crosstabs 列联表分析Cross-tabulation table, 复合表Cube root, 立方根Cumulative distribution function, 分布函数Cumulative probability, 累计概率Curvature, 曲率/弯曲Curvature, 曲率Curve Estimation, 曲线拟合Curve fit , 曲线拟和Curve fitting, 曲线拟合Curvilinear regression, 曲线回归Curvilinear relation, 曲线关系Cut-and-try method, 尝试法Cycle, 周期Cyclist, 周期性D test, D检验Data acquisition, 资料收集Data bank, 数据库Data capacity, 数据容量Data deficiencies, 数据缺乏Data handling, 数据处理Data manipulation, 数据处理Data processing, 数据处理Data reduction, 数据缩减Data set, 数据集Data sources, 数据来源Data transformation, 数据变换Data validity, 数据有效性Data-in, 数据输入Data-out, 数据输出Dead time, 停滞期Degree of freedom, 自由度Degree of precision, 精密度Degree of reliability, 可靠性程度Degression, 递减Density function, 密度函数Density of data points, 数据点的密度Dependent variable, 应变量/依变量/因变量Dependent variable, 因变量Depth, 深度Derivative matrix, 导数矩阵Derivative-free methods, 无导数方法Design, 设计Determinacy, 确定性Determinant, 行列式Determinant, 决定因素Deviation, 离差Deviation from average, 离均差Diagnostic plot, 诊断图Dichotomous variable, 二分变量Differential equation, 微分方程Direct standardization, 直接标准化法Direct Oblimin, 斜交旋转Discrete variable, 离散型变量DISCRIMINANT, 判断Discriminant analysis, 判别分析Discriminant coefficient, 判别系数Discriminant function, 判别值Dispersion, 散布/分散度Disproportional, 不成比例的Disproportionate sub-class numbers, 不成比例次级组含量Distribution free, 分布无关性/免分布Distribution shape, 分布形状Distribution-free method, 任意分布法Distributive laws, 分配律Disturbance, 随机扰动项Dose response curve, 剂量反应曲线Double blind method, 双盲法Double blind trial, 双盲试验Double exponential distribution, 双指数分布Double logarithmic, 双对数Downward rank, 降秩Dual-space plot, 对偶空间图DUD, 无导数方法Duncan's new multiple range method, 新复极差法/Duncan新法Error Bar, 均值相关区间图Effect, 实验效应Eigenvalue, 特征值Eigenvector, 特征向量Ellipse, 椭圆Empirical distribution, 经验分布Empirical probability, 经验概率单位Enumeration data, 计数资料Equal sun-class number, 相等次级组含量Equally likely, 等可能Equivariance, 同变性Error, 误差/错误Error of estimate, 估计误差Error type I, 第一类错误Error type II, 第二类错误Estimand, 被估量Estimated error mean squares, 估计误差均方Estimated error sum of squares, 估计误差平方和Euclidean distance, 欧式距离Event, 事件Event, 事件Exceptional data point, 异常数据点Expectation plane, 期望平面Expectation surface, 期望曲面Expected values, 期望值Experiment, 实验Experimental sampling, 试验抽样Experimental unit, 试验单位Explained variance (已说明方差)Explanatory variable, 说明变量Exploratory data analysis, 探索性数据分析Explore Summarize, 探索-摘要Exponential curve, 指数曲线Exponential growth, 指数式增长EXSMOOTH, 指数平滑方法Extended fit, 扩充拟合Extra parameter, 附加参数Extrapolation, 外推法Extreme observation, 末端观测值Extremes, 极端值/极值F distribution, F分布F test, F检验Factor, 因素/因子Factor analysis, 因子分析Factor Analysis, 因子分析Factor score, 因子得分Factorial, 阶乘Factorial design, 析因试验设计False negative, 假阴性False negative error, 假阴性错误Family of distributions, 分布族Family of estimators, 估计量族Fanning, 扇面Fatality rate, 病死率Field investigation, 现场调查Field survey, 现场调查Finite population, 有限总体Finite-sample, 有限样本First derivative, 一阶导数First principal component, 第一主成分First quartile, 第一四分位数Fisher information, 费雪信息量Fitted value, 拟合值Fitting a curve, 曲线拟合Fixed base, 定基Fluctuation, 随机起伏Forecast, 预测Four fold table, 四格表Fourth, 四分点Fraction blow, 左侧比率Fractional error, 相对误差Frequency, 频率Frequency polygon, 频数多边图Frontier point, 界限点Function relationship, 泛函关系Gamma distribution, 伽玛分布Gauss increment, 高斯增量Gaussian distribution, 高斯分布/正态分布Gauss-Newton increment, 高斯-牛顿增量General census, 全面普查Generalized least squares, 综合最小平方法GENLOG (Generalized liner models), 广义线性模型Geometric mean, 几何平均数Gini's mean difference, 基尼均差GLM (General liner models), 通用线性模型Goodness of fit, 拟和优度/配合度Gradient of determinant, 行列式的梯度Graeco-Latin square, 希腊拉丁方Grand mean, 总均值Gross errors, 重大错误Gross-error sensitivity, 大错敏感度Group averages, 分组平均Grouped data, 分组资料Guessed mean, 假定平均数Half-life, 半衰期Hampel M-estimators, 汉佩尔M估计量Happenstance, 偶然事件Harmonic mean, 调和均数Hazard function, 风险均数Hazard rate, 风险率Heading, 标目Heavy-tailed distribution, 重尾分布Hessian array, 海森立体阵Heterogeneity, 不同质Heterogeneity of variance, 方差不齐Hierarchical classification, 组内分组Hierarchical clustering method, 系统聚类法High-leverage point, 高杠杆率点High-Low, 低区域图Higher Order Interaction Effects,高阶交互作用HILOGLINEAR, 多维列联表的层次对数线性模型Hinge, 折叶点Histogram, 直方图Historical cohort study, 历史性队列研究Holes, 空洞HOMALS, 多重响应分析Homogeneity of variance, 方差齐性Homogeneity test, 齐性检验Huber M-estimators, 休伯M估计量Hyperbola, 双曲线Hypothesis testing, 假设检验Hypothetical universe, 假设总体Image factoring,, 多元回归法Impossible event, 不可能事件Independence, 独立性Independent variable, 自变量Index, 指标/指数Indirect standardization, 间接标准化法Individual, 个体Inference band, 推断带Infinite population, 无限总体Infinitely great, 无穷大Infinitely small, 无穷小Influence curve, 影响曲线Information capacity, 信息容量Initial condition, 初始条件Initial estimate, 初始估计值Initial level, 最初水平Interaction, 交互作用Interaction terms, 交互作用项Intercept, 截距Interpolation, 内插法Interquartile range, 四分位距Interval estimation, 区间估计Intervals of equal probability, 等概率区间Intrinsic curvature, 固有曲率Invariance, 不变性Inverse matrix, 逆矩阵Inverse probability, 逆概率Inverse sine transformation, 反正弦变换Iteration, 迭代Jacobian determinant, 雅可比行列式Joint distribution function, 分布函数Joint probability, 联合概率Joint probability distribution, 联合概率分布K-Means Cluster逐步聚类分析K means method, 逐步聚类法Kaplan-Meier, 评估事件的时间长度Kaplan-Merier chart, Kaplan-Merier图Kendall's rank correlation, Kendall等级相关Kinetic, 动力学Kolmogorov-Smirnove test, 柯尔莫哥洛夫-斯米尔诺夫检验Kruskal and Wallis test, Kruskal及Wallis检验/多样本的秩和检验/H检验Kurtosis, 峰度Lack of fit, 失拟Ladder of powers, 幂阶梯Lag, 滞后Large sample, 大样本Large sample test, 大样本检验Latin square, 拉丁方Latin square design, 拉丁方设计Leakage, 泄漏Least favorable configuration, 最不利构形Least favorable distribution, 最不利分布Least significant difference, 最小显著差法Least square method, 最小二乘法Least Squared Criterion,最小二乘方准则Least-absolute-residuals estimates, 最小绝对残差估计Least-absolute-residuals fit, 最小绝对残差拟合Least-absolute-residuals line, 最小绝对残差线Legend, 图例L-estimator, L估计量L-estimator of location, 位置L估计量L-estimator of scale, 尺度L估计量Level, 水平Leveage Correction,杠杆率校正Life expectance, 预期期望寿命Life table, 寿命表Life table method, 生命表法Light-tailed distribution, 轻尾分布Likelihood function, 似然函数Likelihood ratio, 似然比line graph, 线图Linear correlation, 直线相关Linear equation, 线性方程Linear programming, 线性规划Linear regression, 直线回归Linear Regression, 线性回归Linear trend, 线性趋势Loading, 载荷Location and scale equivariance, 位置尺度同变性Location equivariance, 位置同变性Location invariance, 位置不变性Location scale family, 位置尺度族Log rank test, 时序检验Logarithmic curve, 对数曲线Logarithmic normal distribution, 对数正态分布Logarithmic scale, 对数尺度Logarithmic transformation, 对数变换Logic check, 逻辑检查Logistic distribution, 逻辑斯特分布Logit transformation, Logit转换LOGLINEAR, 多维列联表通用模型Lognormal distribution, 对数正态分布Lost function, 损失函数Low correlation, 低度相关Lower limit, 下限Lowest-attained variance, 最小可达方差LSD, 最小显著差法的简称Lurking variable, 潜在变量Main effect, 主效应Major heading, 主辞标目Marginal density function, 边缘密度函数Marginal probability, 边缘概率Marginal probability distribution, 边缘概率分布Matched data, 配对资料Matched distribution, 匹配过分布Matching of distribution, 分布的匹配Matching of transformation, 变换的匹配Mathematical expectation, 数学期望Mathematical model, 数学模型Maximum L-estimator, 极大极小L 估计量Maximum likelihood method, 最大似然法Mean, 均数Mean squares between groups, 组间均方Mean squares within group, 组内均方Means (Compare means), 均值-均值比较Median, 中位数Median effective dose, 半数效量Median lethal dose, 半数致死量Median polish, 中位数平滑Median test, 中位数检验Minimal sufficient statistic, 最小充分统计量Minimum distance estimation, 最小距离估计Minimum effective dose, 最小有效量Minimum lethal dose, 最小致死量Minimum variance estimator, 最小方差估计量MINITAB, 统计软件包Minor heading, 宾词标目Missing data, 缺失值Model specification, 模型的确定Modeling Statistics , 模型统计Models for outliers, 离群值模型Modifying the model, 模型的修正Modulus of continuity, 连续性模Morbidity, 发病率Most favorable configuration, 最有利构形MSC(多元散射校正)Multidimensional Scaling (ASCAL), 多维尺度/多维标度Multinomial Logistic Regression , 多项逻辑斯蒂回归Multiple comparison, 多重比较Multiple correlation , 复相关Multiple covariance, 多元协方差Multiple linear regression, 多元线性回归Multiple response , 多重选项Multiple solutions, 多解Multiplication theorem, 乘法定理Multiresponse, 多元响应Multi-stage sampling, 多阶段抽样Multivariate T distribution, 多元T分布Mutual exclusive, 互不相容Mutual independence, 互相独立Natural boundary, 自然边界Natural dead, 自然死亡Natural zero, 自然零Negative correlation, 负相关Negative linear correlation, 负线性相关Negatively skewed, 负偏Newman-Keuls method, q检验NK method, q检验No statistical significance, 无统计意义Nominal variable, 名义变量Nonconstancy of variability, 变异的非定常性Nonlinear regression, 非线性相关Nonparametric statistics, 非参数统计Nonparametric test, 非参数检验Nonparametric tests, 非参数检验Normal deviate, 正态离差Normal distribution, 正态分布Normal equation, 正规方程组Normal P-P, 正态概率分布图Normal Q-Q, 正态概率单位分布图Normal ranges, 正常范围Normal value, 正常值Normalization 归一化Nuisance parameter, 多余参数/讨厌参数Null hypothesis, 无效假设Numerical variable, 数值变量Objective function, 目标函数Observation unit, 观察单位Observed value, 观察值One sided test, 单侧检验One-way analysis of variance, 单因素方差分析Oneway ANOVA , 单因素方差分析Open sequential trial, 开放型序贯设计Optrim, 优切尾Optrim efficiency, 优切尾效率Order statistics, 顺序统计量Ordered categories, 有序分类Ordinal logistic regression , 序数逻辑斯蒂回归Ordinal variable, 有序变量Orthogonal basis, 正交基Orthogonal design, 正交试验设计Orthogonality conditions, 正交条件ORTHOPLAN, 正交设计Outlier cutoffs, 离群值截断点Outliers, 极端值OVERALS , 多组变量的非线性正规相关Overshoot, 迭代过度Paired design, 配对设计Paired sample, 配对样本Pairwise slopes, 成对斜率Parabola, 抛物线Parallel tests, 平行试验Parameter, 参数Parametric statistics, 参数统计Parametric test, 参数检验Pareto, 直条构成线图(又称佩尔托图)Partial correlation, 偏相关Partial regression, 偏回归Partial sorting, 偏排序Partials residuals, 偏残差Pattern, 模式PCA(主成分分析)Pearson curves, 皮尔逊曲线Peeling, 退层Percent bar graph, 百分条形图Percentage, 百分比Percentile, 百分位数Percentile curves, 百分位曲线Periodicity, 周期性Permutation, 排列P-estimator, P估计量Pie graph, 构成图,饼图Pitman estimator, 皮特曼估计量Pivot, 枢轴量Planar, 平坦Planar assumption, 平面的假设PLANCARDS, 生成试验的计划卡PLS(偏最小二乘法)Point estimation, 点估计Poisson distribution, 泊松分布Polishing, 平滑Polled standard deviation, 合并标准差Polled variance, 合并方差Polygon, 多边图Polynomial, 多项式Polynomial curve, 多项式曲线Population, 总体Population attributable risk, 人群归因危险度Positive correlation, 正相关Positively skewed, 正偏Posterior distribution, 后验分布Power of a test, 检验效能Precision, 精密度Predicted value, 预测值Preliminary analysis, 预备性分析Principal axis factoring,主轴因子法Principal component analysis, 主成分分析Prior distribution, 先验分布Prior probability, 先验概率Probabilistic model, 概率模型probability, 概率Probability density, 概率密度Product moment, 乘积矩/协方差Profile trace, 截面迹图Proportion, 比/构成比Proportion allocation in stratified randomsampling, 按比例分层随机抽样Proportionate, 成比例Proportionate sub-class numbers, 成比例次级组含量Prospective study, 前瞻性调查Proximities, 亲近性Pseudo F test, 近似F检验Pseudo model, 近似模型Pseudosigma, 伪标准差Purposive sampling, 有目的抽样QR decomposition, QR分解Quadratic approximation, 二次近似Qualitative classification, 属性分类Qualitative method, 定性方法Quantile-quantile plot, 分位数-分位数图/Q-Q 图Quantitative analysis, 定量分析Quartile, 四分位数Quick Cluster, 快速聚类Radix sort, 基数排序Random allocation, 随机化分组Random blocks design, 随机区组设计Random event, 随机事件Randomization, 随机化Range, 极差/全距Rank correlation, 等级相关Rank sum test, 秩和检验Rank test, 秩检验Ranked data, 等级资料Rate, 比率Ratio, 比例Raw data, 原始资料Raw residual, 原始残差Rayleigh's test, 雷氏检验Rayleigh's Z, 雷氏Z值Reciprocal, 倒数Reciprocal transformation, 倒数变换Recording, 记录Redescending estimators, 回降估计量Reducing dimensions, 降维Re-expression, 重新表达Reference set, 标准组Region of acceptance, 接受域Regression coefficient, 回归系数Regression sum of square, 回归平方和Rejection point, 拒绝点Relative dispersion, 相对离散度Relative number, 相对数Reliability, 可靠性Reparametrization, 重新设置参数Replication, 重复Report Summaries, 报告摘要Residual sum of square, 剩余平方和residual variance (剩余方差)Resistance, 耐抗性Resistant line, 耐抗线Resistant technique, 耐抗技术R-estimator of location, 位置R估计量R-estimator of scale, 尺度R估计量Retrospective study, 回顾性调查Ridge trace, 岭迹Ridit analysis, Ridit分析Rotation, 旋转Rounding, 舍入Row, 行Row effects, 行效应Row factor, 行因素RXC table, RXC表Sample, 样本Sample regression coefficient, 样本回归系数Sample size, 样本量Sample standard deviation, 样本标准差Sampling error, 抽样误差SAS(Statistical analysis system ), SAS统计软件包Scale, 尺度/量表Scatter diagram, 散点图Schematic plot, 示意图/简图Score test, 计分检验Screening, 筛检SEASON, 季节分析Second derivative, 二阶导数Second principal component, 第二主成分SEM (Structural equation modeling), 结构化方程模型Semi-logarithmic graph, 半对数图Semi-logarithmic paper, 半对数格纸Sensitivity curve, 敏感度曲线Sequential analysis, 贯序分析Sequence, 普通序列图Sequential data set, 顺序数据集Sequential design, 贯序设计Sequential method, 贯序法Sequential test, 贯序检验法Serial tests, 系列试验Short-cut method, 简捷法Sigmoid curve, S形曲线Sign function, 正负号函数Sign test, 符号检验Signed rank, 符号秩Significant Level, 显著水平Significance test, 显著性检验Significant figure, 有效数字Simple cluster sampling, 简单整群抽样Simple correlation, 简单相关Simple random sampling, 简单随机抽样Simple regression, 简单回归simple table, 简单表Sine estimator, 正弦估计量Single-valued estimate, 单值估计Singular matrix, 奇异矩阵Skewed distribution, 偏斜分布Skewness, 偏度Slash distribution, 斜线分布Slope, 斜率Smirnov test, 斯米尔诺夫检验Source of variation, 变异来源Spearman rank correlation, 斯皮尔曼等级相关Specific factor, 特殊因子Specific factor variance, 特殊因子方差Spectra , 频谱Spherical distribution, 球型正态分布Spread, 展布SPSS(Statistical package for the social science), SPSS统计软件包Spurious correlation, 假性相关Square root transformation, 平方根变换Stabilizing variance, 稳定方差Standard deviation, 标准差Standard error, 标准误Standard error of difference, 差别的标准误Standard error of estimate, 标准估计误差Standard error of rate, 率的标准误Standard normal distribution, 标准正态分布Standardization, 标准化Starting value, 起始值Statistic, 统计量Statistical control, 统计控制Statistical graph, 统计图Statistical inference, 统计推断Statistical table, 统计表Steepest descent, 最速下降法Stem and leaf display, 茎叶图Step factor, 步长因子Stepwise regression, 逐步回归Storage, 存Strata, 层(复数)Stratified sampling, 分层抽样Stratified sampling, 分层抽样Strength, 强度Stringency, 严密性Structural relationship, 结构关系Studentized residual, 学生化残差/t化残差Sub-class numbers, 次级组含量Subdividing, 分割Sufficient statistic, 充分统计量Sum of products, 积和Sum of squares, 离差平方和Sum of squares about regression, 回归平方和Sum of squares between groups, 组间平方和Sum of squares of partial regression, 偏回归平方和Sure event, 必然事件Survey, 调查Survival, 生存分析Survival rate, 生存率Suspended root gram, 悬吊根图Symmetry, 对称Systematic error, 系统误差Systematic sampling, 系统抽样Tags, 标签Tail area, 尾部面积Tail length, 尾长Tail weight, 尾重Tangent line, 切线Target distribution, 目标分布Taylor series, 泰勒级数Test(检验)Test of linearity, 线性检验Tendency of dispersion, 离散趋势Testing of hypotheses, 假设检验Theoretical frequency, 理论频数Time series, 时间序列Tolerance interval, 容忍区间Tolerance lower limit, 容忍下限Tolerance upper limit, 容忍上限Torsion, 扰率Total sum of square, 总平方和Total variation, 总变异Transformation, 转换Treatment, 处理Trend, 趋势Trend of percentage, 百分比趋势Trial, 试验Trial and error method, 试错法Tuning constant, 细调常数。

测绘数据处理的常用软件及方法随着科技的不断发展,测绘行业也日新月异。
测量数据的处理与分析成为测绘工作中不可或缺的一部分。
在这篇文章中,我们将介绍测绘数据处理的常用软件及方法,以便更好地理解和应用于实际工作中。
一、常用软件1. ArcGISArcGIS是一款集地理信息系统、地理数据管理、分析、可视化与共享等功能于一身的软件。
它提供了强大的数据处理工具和分析功能,可以用于测绘数据的建模、地图制作、空间分析等。
ArcGIS的优势在于其用户界面友好、操作简便,适用于各种规模和类型的测绘项目。
2. AutoCADAutoCAD是一款设计和建模软件,它广泛应用于测绘数据的绘制与处理。
AutoCAD提供了丰富的绘图工具和CAD设计功能,可以用于绘制测量图纸、数字化地图、生成三维模型等。
其强大的数据处理能力使得测绘数据的处理更加高效和准确。
3. QGISQGIS是一款开源的地理信息系统软件,提供了丰富的地理数据处理和分析功能,适用于各类测绘项目。
QGIS支持导入与输出多种格式的地理数据,可以进行空间查询、地理标注、地图制作等操作。
其开源的特性使得QGIS可以更加灵活地满足用户的需求。
二、常用方法1. 数据清理与处理在测绘数据处理过程中,第一步需要进行数据清理与处理。
这包括去除异常数据、填充缺失数值、纠正数据误差等操作。
常用的方法有统计学方法、数据插值法、数据滤波法等。
其中,统计学方法可以用于检测异常数据和填充缺失数值,数据插值法可用于补全缺失数据,数据滤波法适用于消除数据中的噪声。
2. 数据配准与校正数据配准与校正是保证测绘数据精度的重要步骤。
对于不同源的数据,我们需要将其进行坐标配准和校正,以确保其在同一坐标系下使用。
配准主要包括地理配准和几何配准,可以通过添加控制点、变换坐标等方法实现。
校正则是指校正数据中的系统误差,例如大气误差、法线误差等。
3. 数据模型与分析数据模型与分析是测绘数据处理中的关键环节。
根据实际测绘需求,我们可以选择不同的模型进行数据建模与分析,例如地形模型、栅格模型、矢量模型等。
arcgis 空间聚类方法ArcGIS是一款专业的地理信息系统软件,其中包含了丰富的空间分析功能。
而空间聚类方法是其中一种常用的空间分析技术,用于发现地理空间中的聚集模式。
本文将介绍ArcGIS中的空间聚类方法,并探讨其应用及优势。
一、空间聚类方法概述空间聚类方法是一种通过统计学方法来确定地理空间中的聚集模式的技术。
它可以帮助我们识别出地理空间中的热点区域、集聚区域以及离散区域,从而更好地理解地理现象的分布规律。
ArcGIS提供了多种空间聚类方法,如聚类分析(Cluster Analysis)、K均值聚类(K-means Clustering)等。
二、聚类分析聚类分析是一种常用的空间聚类方法,它将地理空间中的点或区域划分为若干个空间聚类,每个聚类内的点或区域在某种属性上具有相似性,并与其他聚类之间存在明显的差异。
ArcGIS中的聚类分析工具可以通过计算点或区域之间的距离或相似性来进行聚类划分,常用的方法有DBSCAN(Density-based Spatial Clustering of Applications with Noise)、OPTICS(Ordering Points To Identify the Clustering Structure)等。
三、K均值聚类K均值聚类是一种常用的无监督学习方法,它通过将地理空间中的点或区域划分为K个聚类,使得每个点或区域到所属聚类的质心距离最小化。
ArcGIS中的K均值聚类工具可以通过迭代计算各个点或区域与质心的距离来进行聚类划分,从而得到K个聚类。
K均值聚类适用于数据量较大、数据结构较简单的情况。
四、空间聚类方法的应用空间聚类方法在地理信息系统领域有着广泛的应用。
例如,在城市规划中,我们可以利用空间聚类方法来确定合适的商业区位置,从而优化城市布局;在环境监测中,我们可以利用空间聚类方法来识别污染源,从而采取相应的治理措施;在疾病传播研究中,我们可以利用空间聚类方法来识别疫情聚集区,从而采取针对性的防控措施。
地质统计学教案中的地质统计软件与工具应用地质统计学是地质学与统计学相结合的学科,通过对地质现象和地质数据的统计分析,提供了一种系统的、科学的研究方法和技术手段。
而地质统计软件与工具则是在地质统计学应用中,起到关键作用的工具。
本文将介绍地质统计软件与工具的应用,以及其在地质统计学教学中的重要性。
一、地质统计软件的应用地质统计软件是地质学家进行数据处理和分析的重要工具。
它们可以帮助地质学家对地质数据进行可视化展示、数据清洗和处理、统计算法应用等操作。
以下是一些经典的地质统计软件:1. GSLIB:GSLIB是地质学家使用最广泛的统计分析软件之一。
它提供了丰富的统计分析方法和模型,如变异函数分析、空间插值、模拟等。
GSLIB能够处理各种类型的地质数据,包括地球化学数据、地震数据、岩心数据等。
2. GeoR:GeoR是R语言的一个扩展包,专门用于地质数据的统计分析。
它提供了多种空间统计方法,如Kriging插值、局部Kriging、克里格变异函数等。
GeoR用户可以使用R语言的强大功能,进行更加灵活和个性化的地质数据分析。
3. Isatis:Isatis是一款专业的地质空间统计软件,由法国Geovariances公司开发。
该软件具有较好的图形用户界面和丰富的统计分析功能,包括地质建模、回归分析、多元统计等。
Isatis在资源勘探、地质灾害评估等领域得到了广泛应用。
以上只是地质统计软件中的几个代表性工具,还有许多其他的软件如GeoStat、SGeMS等,它们都为地质学家提供了高效而方便的数据处理、分析和建模方法。
二、地质统计工具的应用除了地质统计软件,地质统计学中还有一些常用的工具被广泛运用。
1. 地质野外测量工具:地质学家在野外进行地质调查和采样时,需要使用各种工具,如罗盘、测距仪、取样器等。
这些工具能够帮助地质学家准确收集地质数据,为后续的统计分析提供准备。
2. 地质图化软件:地质学家在地质调查中需要绘制地质图,并在图上标注地质要素、测量结果等信息。
GIS分析第6章空间统计学分析空间统计学是地理信息系统(GIS)中的一种分析方法,主要用于研究地理现象的空间分布规律以及地理现象之间的空间关联关系。
空间统计学分析提供了一种描述和解释地理现象的方法,可以帮助人们理解和预测地理现象的空间模式和变化趋势。
空间统计学的基本概念包括空间自相关、空间群集、空间分析、空间插值等。
空间自相关指的是地理现象之间的空间关联性,即地理现象在空间上的分布是否存在相关性。
空间群集是指地理现象在空间上的聚集或分散程度,用于描述地理现象的空间模式。
空间分析是对地理现象的空间特征进行定量评估和解释的过程,包括空间相关性和空间差异性的测量和模型构建。
空间插值是通过已知点的观测值推断未知点的值,用于填充数据空白区域或生成连续的表面。
空间统计学的主要方法包括空间自相关分析、空间群集分析、局部空间统计分析和空间插值分析等。
空间自相关分析用于研究地理现象之间的空间关联性,包括全局自相关和局部自相关。
全局自相关是通过计算整个研究区域内地理现象的相关性来评估地理现象的整体空间分布规律;局部自相关是通过计算每个地理现象邻近区域内地理现象的相关性来评估地理现象的局部空间分布规律。
空间群集分析用于研究地理现象的空间模式,包括空间聚集和空间分散。
空间聚集分析通过计算地理现象的相似性指数来判断地理现象是否聚集在一起;空间分散分析通过计算地理现象的离散性指数来判断地理现象是否分散。
局部空间统计分析用于研究地理现象的空间异质性,包括局部自相关和局部群集。
局部自相关分析通过计算每个地理现象邻近区域内地理现象的相关性来评估地理现象的局部空间关联性;局部群集分析通过计算地理现象的局部空间聚集程度来评估地理现象的局部空间模式。
空间插值分析用于推断未知点的值,包括确定性插值和随机插值。
确定性插值通过已知点的观测值进行插值,生成连续的表面;随机插值通过已知点的观测值进行随机抽样,生成概率分布。
在GIS分析中,空间统计学分析能够帮助人们更好地理解和使用地理数据,发现地理现象的空间规律和关联关系,为决策支持和空间规划提供科学依据。