stata初级入门3-描述性统计指标课件
- 格式:ppt
- 大小:618.00 KB
- 文档页数:21

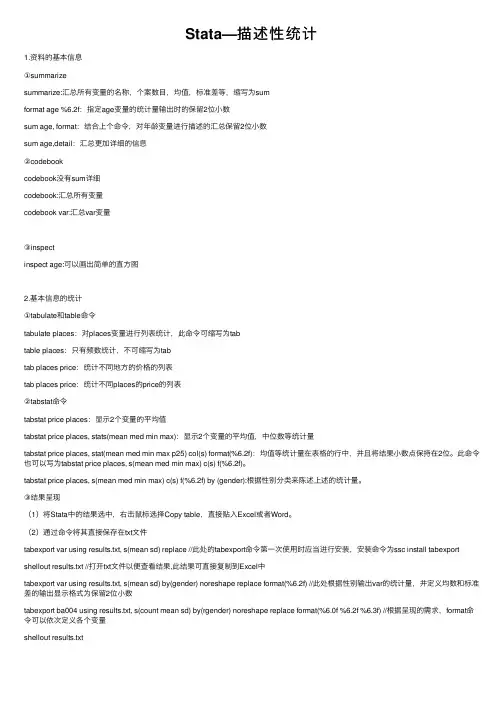
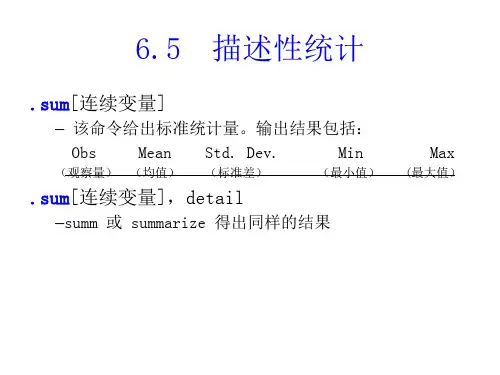
Stata—描述性统计1.资料的基本信息①summarizesummarize:汇总所有变量的名称,个案数⽬,均值,标准差等,缩写为sumformat age %6.2f:指定age变量的统计量输出时的保留2位⼩数sum age, format:结合上个命令,对年龄变量进⾏描述的汇总保留2位⼩数sum age,detail:汇总更加详细的信息②codebookcodebook没有sum详细codebook:汇总所有变量codebook var:汇总var变量③inspectinspect age:可以画出简单的直⽅图2.基本信息的统计①tabulate和table命令tabulate places:对places变量进⾏列表统计,此命令可缩写为tabtable places:只有频数统计,不可缩写为tabtab places price:统计不同地⽅的价格的列表tab places price:统计不同places的price的列表②tabstat命令tabstat price places:显⽰2个变量的平均值tabstat price places, stats(mean med min max):显⽰2个变量的平均值,中位数等统计量tabstat price places, stat(mean med min max p25) col(s) format(%6.2f):均值等统计量在表格的⾏中,并且将结果⼩数点保持在2位。
此命令也可以写为tabstat price places, s(mean med min max) c(s) f(%6.2f)。
tabstat price places, s(mean med min max) c(s) f(%6.2f) by (gender):根据性别分类来陈述上述的统计量。
③结果呈现(1)将Stata中的结果选中,右击⿏标选择Copy table,直接贴⼊Excel或者Word。