引物设计及测序结果分析
- 格式:ppt
- 大小:2.43 MB
- 文档页数:41

实验五 PCR引物设计及评价【实验目的】1、掌握引物设计的基本要求,并熟悉使用Primer premier5.0软件进行引物搜索。
2、掌握使用软件oligo6.0对设计的引物进行评价分析。
【实验原理】一、引物设计原则聚合梅链式反应(polymerase chain reaction)即PCR技术,是一种在体外快速扩增特定基因或DNA 序列的方法,故又称基因的体外扩增法。
PCR技术已成为分子生物学研究中使用最多,最广泛的手段之一,而引物设计是PCR技术中至关重要的一环,使用不合适的PCR引物容易导致实验失败:表现为扩增出目的带之外的多条带(如形成引物二聚体带),不出带或出带很弱,等等。
现在PCR 引物设计大都通过计算机软件进行,可以直接提交模板序列到特定网页,得到设计好的引物,也可以在本地计算机上运行引物设计专业软件。
引物设计原则如下:1、引物应在序列的保守区域设计并具有特异性。
引物序列应位于基因组DNA的高度保守区,且与非扩增区无同源序列。
这样可以减少引物与基因组的非特异结合,提高反应的特异性;2、引物的长度一般为15-30 bp。
常用的是18-27 bp,但不应大于38,因为过长会导致其延伸温度大于74℃,不适于Taq DNA聚合酶进行反应;3、引物不应形成二级结构。
引物二聚体及发夹结构的能值过高(超过4.5kcal/mol)易导致产生引物二聚体带,并且降低引物有效浓度而使PCR反应不能正常进行;4、引物序列的GC含量一般为40-60%。
过高或过低都不利于引发反应。
上下游引物的GC含量不能相差太大;5、引物所对应模板位置序列的Tm值在72℃左右可使复性条件最佳。
Tm值的计算有多种方法,如按公式Tm=4(G+C)+2(A+T);6、引物5'端序列对PCR影响不太大,因此常用来引进修饰位点或标记物。
可根据下一步实验中要插入PCR产物的载体的相应序列而确定。
7、引物3’端不可修饰。
引物3'端的末位碱基对Taq酶的DNA合成效率有较大的影响。
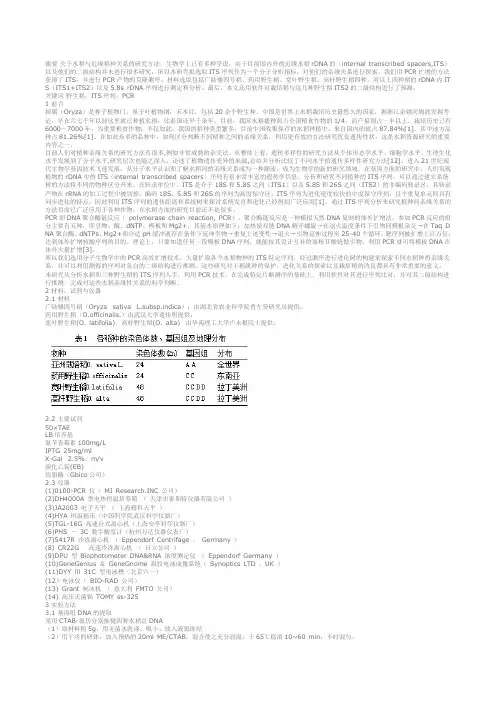
摘要关于水稻与近缘稻种关系的研究方法,生物学上已有多种学说,由于目前国内外的近缘水稻rDNA的(internal transcribed spacers,ITS)以及他们的二级结构并未进行很多研究,所以本研究拟选取ITS序列作为一个分子分析指标,对他们的亲缘关系进行探索。
我们用PCR扩增的方法获得了ITS,并进行PCR产物的克隆测序。
材料选取包括广陆矮四号稻、药用野生稻、宽叶野生稻、高杆野生稻四种。
对以上四种稻的rDNA内IT S(ITS1+ITS2)以及5.8s rDNA序列进行测定和分析。
最后,本文还用软件对栽培稻与这几种野生稻ITS2的二级结构进行了预测。
关键词野生稻;ITS序列;PCR1 前言稻属(Oryza)是种子植物门,单子叶植物纲,禾本目,包括20余个野生种。
中国是世界上水稻栽培历史最悠久的国家,据浙江余姚河姆渡发掘考证,早在六七千年以前这里就已种植水稻,比泰国还早千余年。
目前,我国水稻播种面占全国粮食作物的1/4,而产量则占一半以上。
栽培历史已有6000~7000年。
为重要粮食作物;不仅如此,我国的稻种类型繁多。
目前中国收集保存的水稻种植中,来自国内的就占87.84%[1],其中地方品种占81.26%[1]。
在如此众多的品种中,如何区分判断不同稻种之间的亲缘关系,利用更有效的方法研究优良遗传性状,这是水稻资源研究的重要内容之一。
目前人们对植种亲缘关系的研究方法有很多,例如非常成熟的杂交法。
从整体上看,遗传多样性的研究方法从个体形态学水平、细胞学水平、生理生化水平发展到了分子水平,研究层次也随之深入。
论述了植物遗传变异的来源,总结并分析比较了不同水平的遗传多样性研究方法[12]。
进入21世纪现代生物学基因技术飞速发展,从分子水平认识和了解水稻间的亲缘关系成为一种潮流,成为生物学的新的研究领域。
在基因方面的研究中,人们发现植物的rDNA中的ITS(internal transcribed spacers)序列有着非常丰富的遗传学信息。

测序引物设计指南♦PCR引物设计方法:1.引物最好在模板cDNA的保守区内设计。
DNA序列的保守区是通过物种间相似序列的比较确定的。
在NCBI上搜索不同物种的同一基因,通过序列分析软件(比如DNAman)比对(Alignment),各基因相同的序列就是该基因的保守区。
2.引物长度一般在15~30碱基之间。
引物长度(primerlength)常用的是18-27bp,但不应大于38,因为过长会导致其延伸温度大于74℃,不适于TaqDNA 聚合酶进行反应。
3.引物GC含量在40%~60%之间,Tm值最好接近72℃。
GC含量(composition)过高或过低都不利于引发反应。
上下游引物的GC含量不能相差太大。
另外,上下游引物的Tm值(meltingtemperature)是寡核苷酸的解链温度,即在一定盐浓度条件下,50%寡核苷酸双链解链的温度。
有效启动温度,一般高于Tm值5~10℃。
若按公式Tm=4(G+C)+2(A+T)估计引物的Tm值,则有效引物的Tm为55~80℃,其Tm值最好接近72℃以使复性条件最佳。
4.引物3′端要避开密码子的第3位。
如扩增编码区域,引物3′端不要终止于密码子的第3位,因密码子的第3位易发生简并,会影响扩增的特异性与效率。
5.引物3′端不能选择A,最好选择T。
引物3′端错配时,不同碱基引发效率存在着很大的差异,当末位的碱基为A时,即使在错配的情况下,也能有引发链的合成,而当末位链为T时,错配的引发效率大大降低,G和C错配的引发效率介于A、T之间,所以3′端最好选择T。
6.碱基要随机分布。
引物序列在模板内应当没有相似性较高,尤其是3’端相似性较高的序列,否则容易导致错误引发(Falsepriming)。
降低引物与模板相似性的一种方法是,引物中四种碱基的分布最好是随机的,不要有聚嘌呤或聚嘧啶的存在。
尤其3′端不应超过3个连续的G或C,因这样会使引物在GC富集序列区错误引发。
7.引物自身及引物之间不应存在互补序列。

测序结果说明1.测序完成后,我们用对每个样品提供一份测序报告,其中包括:测出的序列彩色峰图(请用Chromas软件打开)序列文件拼接后结果(需要测通的样品)2.在进行DNA测序时,紧接引物的10~30碱基有时不一定能完全读清楚。
3.正常情况下,3730测序仪保证800bp的有效长度,但是有时由于DNA结构上的原因,有时会出现反应中断无法进行的情况。
如:G/C rich;G/C Cluster;Poly A/T/C/G的连续结构等。
此外,另一种情况为反应中途出现的套峰现象,此种情况一般为DNA结构中的重复序列,造成测序用引物和模板之间有两个以上结合位点。
以上情况是由于DNA结构原因造成了无法正常进行DNA测序,对这种情况,我们会根据具体测序结果进行相应收费。
出现以上情况后,我们提倡从另一端进行测序,或者用高级试剂盒进行测序。
4.备注说明一般正常的菌液和质粒自收样日至发送报告日周期为二--三天,PCR产物(纯化及未纯化)为三--四天。
对于三个工作日内无法得到满意测序结果的,我们会用E-mail或电话与客户或代理商联系。
并不是所有的样品都能得到满意的测序结果,对于测序结果不好的,我们会尽力找到可能的原因,以建议进一步如何操作。
测序常见问题解答Q1.为什么提供新鲜的菌液?如何提供新鲜的菌液?A1.首先,新鲜的菌液易于培养,可以获得更多的DNA,同时最大限度地保证菌种的纯度。
如果您提供新鲜菌液,用封口膜封口以免泄露;也可以将培养好的4~5ml菌液离心沉淀下来,倒去上清液以方便邮寄。
同时邮寄时最好用盒子以免邮寄过程中造成离心管挤压破裂。
Q2.DNA测序样品用什么溶液溶解比较好?A2.溶解DNA测序样品时,用灭菌蒸馏水溶解最好。
DNA的测序反应也是Taq酶的聚合反应,需要一个最佳的酶反应条件。
如果DNA用缓冲液溶解后,在进行测序反应时,DNA溶液中的缓冲液组份会影响测序反应的体系条件,造成Taq酶的聚合性能下降。

第1篇一、实验目的本实验旨在学习并掌握特异引物设计的方法,通过实验验证设计引物的正确性,为后续的PCR实验提供高质量的引物。
二、实验原理特异引物设计是分子生物学实验中的一项重要技术,主要用于PCR、实时定量PCR等实验中,通过设计特定的DNA序列作为引物,在模板DNA上扩增出目的基因片段。
特异引物设计的关键在于确保引物与目标DNA序列的高度特异性,避免非特异性扩增。
三、实验材料1. 质粒DNA模板;2. 引物合成试剂盒;3. PCR仪;4. 电泳仪;5. DNA电泳凝胶;6. 紫外线灯;7. 引物设计软件(如Primer Premier);8. 其他试剂(如PCR反应缓冲液、dNTPs、Taq酶等)。
四、实验方法1. 引物设计使用引物设计软件(如Primer Premier)设计特异引物。
根据目标DNA序列,选择合适的引物长度(通常为20-30 bp),确保引物与目标DNA序列具有高度特异性。
同时,考虑引物的Tm值、GC含量、引物之间的退火温度等参数。
2. 引物合成按照引物合成试剂盒说明书进行引物合成,得到特异引物。
3. PCR反应将质粒DNA模板、特异引物、PCR反应缓冲液、dNTPs、Taq酶等试剂加入PCR管中,进行PCR反应。
反应程序如下:- 预变性:95℃,5 min;- 循环扩增:95℃,30 s;55℃(根据引物Tm值调整),30 s;72℃,1 min;- 最后延伸:72℃,10 min。
4. PCR产物分析将PCR产物进行琼脂糖凝胶电泳,观察扩增结果。
如果出现与预期片段大小一致的条带,说明引物设计正确。
5. 引物验证将PCR产物进行纯化,并进行测序,验证引物特异性。
五、实验结果与分析1. 引物设计结果通过引物设计软件,成功设计出符合要求的特异引物,引物长度为25 bp,Tm值为59.5℃,GC含量为45%。
2. PCR反应结果PCR反应后,在琼脂糖凝胶电泳上观察到与预期片段大小一致的条带,说明引物设计正确。
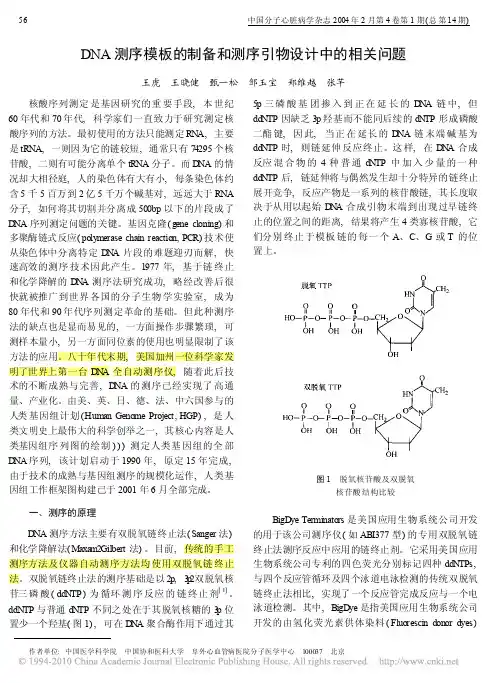
DNA测序模板的制备和测序引物设计中的相关问题王虎王晓健甄一松邹玉宝郑维越张芊核酸序列测定是基因研究的重要手段,本世纪60年代和70年代,科学家们一直致力于研究测定核酸序列的方法。
最初使用的方法只能测定RN A,主要是tRNA,一则因为它的链较短,通常只有74295个核苷酸,二则有可能分离单个tRNA分子。
而D NA的情况却大相径庭,人的染色体有大有小,每条染色体约含5千5百万到2亿5千万个碱基对,远远大于RNA 分子,如何将其切割并分离成500bp以下的片段成了D NA序列测定问题的关键。
基因克隆(gene cloning)和多聚酶链式反应(polymerase chain reaction,PCR)技术使从染色体中分离特定D N A片段的难题迎刃而解,快速高效的测序技术因此产生。
1977年,基于链终止和化学降解的D N A测序法研究成功,略经改善后很快就被推广到世界各国的分子生物学实验室,成为80年代和90年代序列测定革命的基础。
但此种测序法的缺点也是显而易见的,一方面操作步骤繁琐,可测样本量小,另一方面同位素的使用也明显限制了该方法的应用。
八十年代末期,美国加州一位科学家发明了世界上第一台D N A全自动测序仪,随着此后技术的不断成熟与完善,D NA的测序已经实现了高通量、产业化。
由美、英、日、德、法、中六国参与的人类基因组计划(Human Genome Project,HGP),是人类文明史上最伟大的科学创举之一,其核心内容是人类基因组序列图的绘制)))测定人类基因组的全部D NA序列,该计划启动于1990年,原定15年完成,由于技术的成熟与基因组测序的规模化运作,人类基因组工作框架图构建已于2001年6月全部完成。
一、测序的原理D NA测序方法主要有双脱氧链终止法(Sanger法)和化学降解法(M axa m2Gilbert法)。
目前,传统的手工测序方法及仪器自动测序方法均使用双脱氧链终止法。
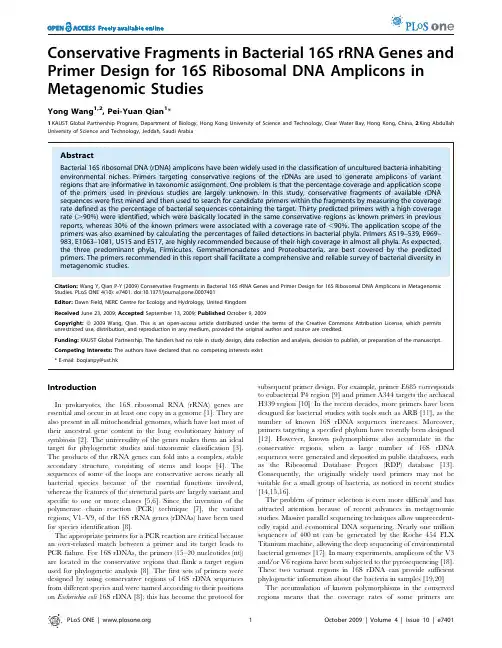
Conservative Fragments in Bacterial16S rRNA Genes and Primer Design for16S Ribosomal DNA Amplicons in Metagenomic StudiesYong Wang1,2,Pei-Yuan Qian1*1KAUST Global Partnership Program,Department of Biology,Hong Kong University of Science and Technology,Clear Water Bay,Hong Kong,China,2King Abdullah University of Science and Technology,Jeddah,Saudi ArabiaAbstractBacterial16S ribosomal DNA(rDNA)amplicons have been widely used in the classification of uncultured bacteria inhabiting environmental niches.Primers targeting conservative regions of the rDNAs are used to generate amplicons of variant regions that are informative in taxonomic assignment.One problem is that the percentage coverage and application scope of the primers used in previous studies are largely unknown.In this study,conservative fragments of available rDNA sequences were first mined and then used to search for candidate primers within the fragments by measuring the coverage rate defined as the percentage of bacterial sequences containing the target.Thirty predicted primers with a high coverage rate(.90%)were identified,which were basically located in the same conservative regions as known primers in previous reports,whereas30%of the known primers were associated with a coverage rate of,90%.The application scope of the primers was also examined by calculating the percentages of failed detections in bacterial phyla.Primers A519–539,E969–983,E1063–1081,U515and E517,are highly recommended because of their high coverage in almost all phyla.As expected, the three predominant phyla,Firmicutes,Gemmatimonadetes and Proteobacteria,are best covered by the predicted primers.The primers recommended in this report shall facilitate a comprehensive and reliable survey of bacterial diversity in metagenomic studies.Citation:Wang Y,Qian P-Y(2009)Conservative Fragments in Bacterial16S rRNA Genes and Primer Design for16S Ribosomal DNA Amplicons in Metagenomic Studies.PLoS ONE4(10):e7401.doi:10.1371/journal.pone.0007401Editor:Dawn Field,NERC Centre for Ecology and Hydrology,United KingdomReceived June23,2009;Accepted September13,2009;Published October9,2009Copyright:ß2009Wang,Qian.This is an open-access article distributed under the terms of the Creative Commons Attribution License,which permits unrestricted use,distribution,and reproduction in any medium,provided the original author and source are credited.Funding:KAUST Global Partnership.The funders had no role in study design,data collection and analysis,decision to publish,or preparation of the manuscript.Competing Interests:The authors have declared that no competing interests exist.*E-mail:boqianpy@ust.hkIntroductionIn prokaryotes,the16S ribosomal RNA(rRNA)genes are essential and occur in at least one copy in a genome[1].They are also present in all mitochondrial genomes,which have lost most of their ancestral gene content in the long evolutionary history of symbiosis[2].The universality of the genes makes them an ideal target for phylogenetic studies and taxonomic classification[3]. The products of the rRNA genes can fold into a complex,stable secondary structure,consisting of stems and loops[4].The sequences of some of the loops are conservative across nearly all bacterial species because of the essential functions involved, whereas the features of the structural parts are largely variant and specific to one or more classes[5,6].Since the invention of the polymerase chain reaction(PCR)technique[7],the variant regions,V1–V9,of the16S rRNA genes(rDNAs)have been used for species identification[8].The appropriate primers for a PCR reaction are critical because an over-relaxed match between a primer and its target leads to PCR failure.For16S rDNAs,the primers(15–20nucleotides(nt)) are located in the conservative regions that flank a target region used for phylogenetic analysis[8].The first sets of primers were designed by using conservative regions of16S rDNA sequences from different species and were named according to their positions on Escherichia coli16S rDNA[8];this has become the protocol for subsequent primer design.For example,primer E685corresponds to eubacterial P4region[9]and primer A344targets the archaeal H339region[10].In the recent decades,more primers have been designed for bacterial studies with tools such as ARB[11],as the number of known16S rDNA sequences increases.Moreover, primers targeting a specified phylum have recently been designed [12].However,known polymorphisms also accumulate in the conservative regions,when a large number of16S rDNA sequences were generated and deposited in public databases,such as the Ribosomal Database Project(RDP)database[13]. Consequently,the originally widely used primers may not be suitable for a small group of bacteria,as noticed in recent studies [14,15,16].The problem of primer selection is even more difficult and has attracted attention because of recent advances in metagenomic studies.Massive parallel sequencing techniques allow unprecedent-edly rapid and economical DNA sequencing.Nearly one million sequences of400nt can be generated by the Roche454FLX Titanium machine,allowing the deep sequencing of environmental bacterial genomes[17].In many experiments,amplicons of the V3 and/or V6regions have been subjected to the pyrosequencing[18]. These two variant regions in16S rDNA can provide sufficient phylogenetic information about the bacteria in samples[19,20]. The accumulation of known polymorphisms in the conserved regions means that the coverage rates of some primers aredeclining[6].This might cause problems in using widely accepted primers if they fail to recover a high percentage of bacterial species in uncultured environmental samples,as ing wrong primers will lead to failure to detect some bacterial species and consequently incomplete surveys in metagenomic studies. Previous studies have found that Archaea-and Eubacteria-specific primers cannot target a spectrum of classes[14,16].The known primers for the Archaea are not always suitable for amplifying the16S rRNA amplicons for Korarchaeota or Nanoarchaeota[16].Using the RDP classifier and the BLAST program,Baker et al.(2003)and Huws et al.(2007)have investigated the species specificity and coverage spectrum of the known primers.However,the results of both studies are preliminary in that the coverage rates of the primers were not given.Moreover,the latter study did not consider degeneracies in these primers.In a recent work,the coverage of several known primers was surveyed using several sets of metagenomic data,and the primers with better performance were recommended for future work[21].All these studies used known primers and provided brief information of their phylum specificity.But we still do not have a ranking of the capacities of the known primers useful for environmental samples and a list of all candidate primers for bacterial16S rRNA genes.In this study,we identified conservative fragments in16S rRNA genes from the RDP database and compiled a list of candidate primers.The predicted primers reported in this study comprise nearly a full-set of primers for prokaryotic16S rRNA genes and largely overlapped with known primers,regardless of any shift in positions.The average coverage rate of our primers is96%, markedly higher than that of other known primers.We also studied the scope of their application,which should provide guidance for metagenomic studies.ResultsDesigning predicted primers using conserved fragments of16S rDNA sequencesWe identified continuous conservative sites(.14nt)in the Archaea and Eubacteria separately.They were positioned on the E. coli16S rRNA gene by using a pairwise alignment and converted toconservative fragments.There were8archaea-specific and11 eubacteria-specific conservative fragments of various lengths.Most of the conservative archaeal and eubacterial fragments were numbered according to approximate positions on the E.coli16S rRNA gene,and only four fragments lacked any counterparts: eubacterial fragments104–120,683–707,and1177–1197,and archaeal fragment1225–1242(Table1).Among the overlapping fragments,we found obvious sequence variations such as between archaeal344–367and eubacterial314–368.The differences in these fragments possibly reflect the major characteristics of the functional parts of the16S rRNA transcripts,which probably developed after the divergence of the Archaea and Eubacteria. Next,we selected candidate primers(15nt)from the fragments by checking their coverage rates.A high coverage rate indicates a high percentage of bacteria in our dataset with a target site for the candidate primer.Every candidate primer was examined with a sliding window,which was moved across the fragments(Fig.1). Although all the sites were highly conservative,the coverage rates of the candidate primers on the same fragment varied markedly and might be distributed across a larger range than that shown in Figure 1.The candidate primers containing degenerate sites clearly corresponded to low coverage rates(Fig.1),suggesting that introduction of the degeneracies could not ensure complete matches between the primers and their targets,and that the degeneracies by themselves pointed to the positions of weak sites in the candidate primers as well as in the conservative fragments. After we filtered out the candidate primers with a coverage rates below90%,the remaining overlapping primers were merged again and new coverage rates were measured for them(Table2). Thirty candidate primers(13for the Archaea and17for the Eubacteria)were identified and are of potential use in designing forward and reverse primers.Notably,eubacterial conservative fragment104–120did not contain candidate primers that met the selection criteria.Some primers for the Archaea and Eubacteria were not only numbered with the same E.coli rDNA positions but were also highly homologous in their pattern.Therefore,they were defined as predicted universal primers:U515–532,U785–800,U909–928,and U1052–1071(Table2).Coverage rates of predicted and known primersTo evaluate the accuracy of our prediction,the predicted primers were compared with29known primers including13 Archaea-specific,9Eubacteria-specific,and7universal primers (Table3).After cleaning the overlapping primers,we found that our predicted primers contained a novel primer,A884–898,which has not been reported previously.Although nearly all the predicted and known primers were located in the same regions, Table1.The conservative fragments in archaeal and eubacterial16S rDNAs.Bacteria Position Conservative fragmentE104–120GGCGVACGGGTGAGTAAE314–368CAYTGGRACTGAGACACGGYCCARACTCCTACGGGAGGCAGCAGTRRGGAATHTTA344–367AYGGGGYGCAGCAGGCGRGAAARCE505–539GGCTAACTHCGTGCCAGCAGCCGCGGTAATACGDA A506–547GGYAAGDCYGGTGYCAGCCGCCGCGGTAAHACCRCCDRTGGCGAAE683–707GTGTAGRGGTGAAATKCGYAGAKATE764–806CGAAAGYGTGGGKAKCRCAGGATTAGATACCCTGGTAGTCCA779–806CRAACSGGATTAGATACCCSGGTAGTCCE879–893CCRCCTGGGGAGTACA882–936CCTGGGRAGTACGKHCGCAAGDRTGAAACTTAAAGGAATTGGCGGGGGAGCACE909–940ACTCAAAKGAATTGACGGGGRCCCGCACAAGCA947–973GCSTGCGGYTYAATTGGABTCAACGCCE949–964ATGTGGTTTAATTCGAE969–985ACGCGARGAACCTTACCA1043–1073GAGAGGWGGTGCATGGCCGYCGYCAGYTCGTE1048–1114GTGSTGCATGGYTGTCGTCAGCTCGTGYCGTGAGRTGTYGGGTTAAGTCCCRYAACGAGCGCAACCCA1094–1111GTCAGRYAACGARCGAGAE1177–1197GGAAGGYGGGGAYGACGTCAAA1225–1242ACACGCGSGCTRCAAWGGThe conservative fragments were generated from multiple alignments among 6,624Archaea(A)and275,057Eubacteria(E)in RDP database.The positions are determined according to relative positions in E.coli16S rDNA genome.Y:C or T; R:A or G;W:A or T;K:G or T;M:C or A;S:C or G;V:not T;H:not G;B:not A;D: not C.doi:10.1371/journal.pone.0007401.t001some of the known primers were probably problematic because of the lack of sufficient degeneracies and the low degree of conservation at some sites in the primers.Therefore,the coverage rates of these primers were compared with those of the predicted primers.For the predicted primers,the average coverage rates of the archaeal and eubacterial primers were 96%and 96.2%,respectively.The average coverage rate of the predicted universal primers was 96%.The values for the known archaeal,eubacterial,and universal primers were 85%,77.4%,and 84.3%,respectively.Overall,the coverage rates of all the predicted primers were above 90%,whereas the coverage rates of the 11known primers (30.6%of all known primers)were lower than 90%(Table 3).The coverage rates of the predicted primers were significantly higher than those of the known primers (Spearman test;P ,0.00001).Our results also cast doubt on the validity of some known universal primers,as three out of the seven showed poor coverage in Archaea or Eubacteria:the coverage rate of U779in Archaea was only 5%.The remaining primers,U341F,U519F,U789F,and U1053F,are highly recommended for their high coverage rates in all bacteria.U341F was not included among our predicted universal primers,as polymorphisms and dissimilarities in this region would introduce too many degeneracies when both the Archaea and Eubacteria are considered.Phylum specificity of predicted and known primersAs described above,we generated a list of predicted and known primers with a high coverage rate for both the Archaea and Eubacteria.However,it was a challenge to amplify the 16S rRNA sequences of all the bacteria in environmental samples.Generally,the dominant and well-characterized bacterial phyla could be detected easily according to the principles of primer design.The problem was how to identify the minority bacterial phyla;occasionally,a whole phylum was missed.In the RDP database,the numbers of bacteria from different phyla differed substantially,and the failure to detect a small phylum might simply result in less than 1%loss of coverage rate.Therefore,it was necessary to assess the phylum specificity of our predicted primers,as a supplemen-tary evaluation other than coverage rate.We first displayed coverage spectrum of 13Archaea-specific primers.In the Crenarchaeota and Euryarchaeota,the percentage of failed detections was below 10%for the primers,indicating thatthe coverage of these Archaea was rather stable (Fig.2).However,the coverage of Korarchaeota and Nanoarchaeota varied remarkably in a range of 0%–100%.Primers A785–800,A899–913,and A905–936were not suitable for Korarchaeota,as indicated by their 100%of failure rates.The highly variant coverage rates of these primers in Nanoarchaeota were not surprising because there were only three representatives of this taxon (.1200nt)in the database.In light of the spectrum found in this test,A519–539could provide the best coverage of all archaeal phyla.Although some primers failed to cover Korarchaeota completely,they provided location information for the design of Korarchaeota-specific primers.Among the 12known Archaea-specific and universal primers examined,U906F and U1053F performed better than the others (Fig.S1).And the result confirms that the Archaea-specific primers do not have high coverage rates in Korarchaeota and/or Nanoarchaeota.The same test was performed with 17predicted Eubacteria-specific primers on 25eubacterial phyla.Most of the primers showed a weakness in finding targets in a small spectrum of eubacteria phyla (Fig.3).E969–983was the best primers because it displayed the lowest average rate (1%)of failed detections,followed by E1063–1081with an average failure percentage of 4.6%.The highest average failure percentage (32.8%)was observed for E1177–1193.Surprisingly,the difference between E783–797and E785–806was 9%,although the major part of E783–797lies within E785–806except for the first two nucleotides.Therefore,different primers show clear phylum specificity,and fine adjustment of the primer target could achieve better coverage.This was verified by variant rates of failed detections observed for the same phylum dataset using different primers.We thus measured the average of the rates for individual phyla to determine the bacteria phyla that were most easily detected,and the results showed that Firmicutes,Gemmatimona-detes and Proteobacteria were the phyla with the highest rates of match to the primers.In ascending order,the average percentages of failed detections were 1.47%,1.54%,and 1.9%,respectively,for three phyla.In contrast,Planctomycetes and TM7were associated with the highest average rates of failed detections (40%and 31.8%,respectively)with large standard deviation (42%and 43%,respectively),indicating that the coverage of the primers in these two phyla is not stable.These results could be foreseen because the overwhelming number of representatives from Firmicutes and Proteobacteria (Fig.3)caused a bias in primer design.The polymorphisms in the minority phyla were largely ignored,leading to insufficient degeneracies in the primers.The performance of known primers was also assessed.Of the top three phyla,Firmicutes and Proteobacteria were most easily detected with the known primers (Fig.S2).A minor phylum,Deferribacteres,was the phylum best covered by the known primers,with the lowest average rate (0.45%)of failed detections,followed by Deinococcus and Acidobacteria.This finding suggests that the 16S rDNA sequences collected previously from the RDP and GenBank were less biased in collection of certain phyla.However,the usefulness of the known primers for Verrucomicrobia was limited,and half the known primers showed .50%failed detections,perhaps reflecting the lack of representatives of this phylum when the primers were designed.Among the known primers,U515and E517are highly recommended in light of their wide spectrum of perfect coverage.E1099F also had an overall high coverage rate,although it failed to detect most of Planctomycetes (Fig.S2).Assessment of Cyanobacteria-specific primersThe above results are useful for studies that focus on a specific phylum.By designing primers for a phylum of interest,onlytheFigure 1.Coverage rates of candidate primers within a conservative fragment.The coverage rates (%)of eight candidate primers within the conservative fragment 59-CAAGDMTGAAACTTAAAG-GAAT-39were determined using all archaeal 16S rDNA sequences (.1,200nt)as the reference dataset.The coverage rate is the percentage of the rDNA sequences that have a target fragment matching a given candidate primer.One mismatch is allowed in the match.doi:10.1371/journal.pone.0007401.g00116S rDNA of the desired bacterial species is amplified for subsequent studies.We examined three Cyanobacteria-specific primers,CYA106F,CYA359F,and CYA781R[12].The coverage rate for all Eubacteria was31.7%for primer CYA106F, 7.4%for CYA359F,and2.3%for CYA781R.We classified the identified bacteria species and found that CYA106F was not specific for the Cyanobacteria.CYA106F,CYA359F and CYA781R could be used to identify80%,98%,and92%of the 4655Cyanobacterial sequences in our collection,independently. Moreover,CYA106F and CYA359F had many targets in Firmicutes:75%of94475Firmicutes sequences were targets of CYA106F and9%were targets of CYA359F.However, CYA781R had an extremely low coverage rate(0.001%)in Firmicutes.An appropriate combination of forward and reverse primers could avoid generating a mixture of amplicons from Firmicutes.These primers designed,based on previous database collection,are still useful today.Distance of the primers to variant regions of16S rRNA genesWe put the predicted and known primers onto the same map to compare their relative distances to the16S rRNA variant regions. Three of these regions(V3,V5,and V6)in E.coli are shown in Figure4.The primers were concentrated in six narrow regions, spanning the three variant regions.For those primers with high coverage rates,the predicted and known primers overlappedTable2.The coverage rate of predicted primers.Bacteria Position Sequence Average rate Coverage rateE321–336ACTGAGACACGGYCCA95.7%96.1%E329–343ACGGYCCARACTCCT95.3%96.0%E338–358ACTCCTACGGGAGGCAGCAGT97.3%96.3%A346–361GGGGYGCAGCAGGCG94.2%94.3%E350–364GGCAGCAGTRRGGAA95.1%95.5%E505–524GGCTAACTHC GTGCCAGCAG95.3%95.1%A514–528GGTGYCAGCCGCCGC97.3%98.5%E515–532GTGCCAGCAGCCGCGGTA92.6%91.0%U515–532GTGYCAGCMGCCGCGGTA-96.9%/96.9%A519–539CAGCCGCCGCGGTAAHACCRC96.7%97.1%E683–700GTGTAGMGGTGAAATKCG92.6%90.5%E783–797CAGGATTAGATACCC97.9%97.9%E785–806GGATTAGATACCCTGGTAGTCC95.9%94.6%A785–800GGATTAGATACCCSGG98.1%98.4%U785–800GGATTAGATACCCBGG-98.4%/97.1%A884–898TGGGRAGTACGKHCG97.1%97.1%A899–913CAAGDMTGAAACTTA97.6%97.6%A905–920TGAAACTTAAAGGAA98.3%98.3%A921–936TTGGCGGGGGAGCAC98%97%E909–926ACTCAAAKGAATTGACGG98.5%97.9%U909–928ACTYAAAKGAATTGRCGGGG-93.2%/92.1%E919–939ATTGACGGGGRCCCGCACAAG96.3%96.1%A947–964GCSTGCGGYTYAATTGGA91.6%90.5%E949–964ATGTGGTTTAATTCGA93.5%93.5%A958–973AATTGGABTCAACGCC90.6%93.5%E969–984ACGCGARGAACCTTAC97.4%97.1%A1045–1059GAGGWGGTGCATGGC95.7%97.4%A1052–1071TGCATGGCCGYCGYCAGYTC96.6%95.1%E1052–1072TGCATGGYTGTCGTCAGCTCG97.1%99.0%U1052–1071TGCATGGYYGYCGYCAGYTC-95.1%/98.8%E1063–1081CGTCAGCTCGTGYCGTGAG99.2%99.3%E1096–1114CCCRYAACGAGCGCAACCC96.8%95.6%E1177–1193GGAAGGYGGGGAYGACG98.2%98.2%A1226–1242CACGCGSGCTRCAAWGG93.8%93.5%The primers in this table were fragments within the conservative fragments in Table1.If coverage rates of neighboring candidate primers were all above95%,they were merged.If no predicted primers in a fragment,the cutoff rate decreased to90%.The average coverage rate was thus calculated for the neighboring primers.Universal primers(U)were obtained by referring to archaeal(A)and eubacterial(E)predicted primers at the same positions of E.coli genome.The coverage rate was measured for the merged primer.For the universal primers,both were provided(A/E).Abbreviated names for bacteria and the positions were listed as those in Table1.doi:10.1371/journal.pone.0007401.t002strongly.The‘‘hot’’regions where the primers bind were:321–364,505–539,783–806,884–939,947–984,and1045–1081.The sizes of the amplicons from the V3region and V5–V6region were about180nt and270nt,respectively.Both could be completely sequenced with the454FLX platform.DiscussionIn this study,we predicted all the potential primers for bacterial 16S rDNA amplicon.Their positions are largely consistent with those of known primers,but the average coverage rate is higher than that of known primers.Some of the known primers used in previous studies have been found to be unsuitable for the amplification of16S rDNA fragments from uncultured samples. We also confirmed that most of the primers in hand are highly specific for a spectrum of bacterial species,and definitely cannot be used to amplify all bacteria in uncultured samples.Our result should be helpful in the design of primer for species-specific amplicons,when research interests are restricted to a certain species.As well as from16S rDNAs,the protocol provided in this study can also be applied to the detection of genetic variations in other essential genes in bacterial communities[22],all of which are important in metagenomic studies.With recent advances in massively parallel sequencing tech-niques,the bacteria world in untouched ecological niches can be explored to survey its biodiversity and niche-specific metabolic pathways.The use of16S rDNA amplicon sequencing allows us to estimate the abundance and diversity of these bacteria,whereas the exhaustive detection of rare species is difficult to achieve.In recent metagenomics studies,the number of phylotypes in the same number of16S rDNA sequences varied substantially for samples from different environments and geographical sites [23,24,25].Despite this,we cannot exclude the possibility that amplification efficacy of the different16S rDNA primers used in these studies led to the underestimation of bacterial richness. Primer usage is undoubtedly one of the most critical limiting factors affecting16S rDNA analysis[18].Although V3and V6are the most popular regions examined in recent metagenomic studies, the primers used differ[18].This may lead to different capture depths of the bacteria in environmental samples,attributable to varying amplification efficiencies and coverage rates of the primers.In an attempt to compare the results of different studies, research groups have tended to use the same primers.In several studies of microbial communities in the human gut and seawater, primers967F and1046R have been used to amplify the V6region to avoid the bias caused by primer selection[19,23,25,26].Our study provides a reliable set of candidate primers for researchers to achieve an approximately full coverage of bacterial16S rDNAs and comparable results among different studies.The recently updated Roche454Titanium platform yields about one million reads per run,with reads up to about400nt [17].The increase in read lengths allows us to analyze longer amplicons from the variant regions of16S rDNAs.However,we are still far from being able to sequence amplicons spanning both V3and V6(Figure4).Among all the primers discussed,E683–700 is important because it can be used as a reverse primer to generate amplicons of,340nt from the V3region or a forward primer designed to generate,400nt amplicons spanning the V5and V6 regions.The closest primers to it are at least100nt away,and it is the only primer that allows the full utilization of the sequencing capacity of the new454platform.However,a potential problem is its relatively low coverage rate of91%for the Eubacteria.Notably, no predicted or known primer has been found for the Archaea in this region.Therefore,the amplicons obtained with E683–700 from an uncultured environmental sample will specifically belong to Eubacteria.One limitation of this study is that the primer design depended on the data in the RDP database.The bacteria in rare biospheres can never be identified if the employed primers are not applicable to them.New primers cannot be invented in case of lack of representatives of those bacteria in the RDP database.Although numerous16S rRNA genes had been collected in databases,the real bacterial world in environmental samples will still be invisible under the current protocol for16S rDNA detection.In this study, three nearly full-length Nanoarchaeota were used as references for primer design.The unstable coverage rate observed is an obstacle to evaluating the efficiency of the predicted and known primers at all sub-levels.Fortunately,ongoing and completed metagenomic projects may help us by providing nearly full-length16S rRNA genes and by increasing the representatives of the rRNA genes particularly from rare biospheres.As the number of16S rRNATable3.Coverage rate of known primers.Primer[Ref]Primer sequence59-39Position Coverage rateA333F[16]TCCAGGCCCTACGGG333–34857.4%E334F[14]CCAGACTCCTACGGGAGGCAGC334–35674.2%A340F[16]CCCTACGGGGYGCASCAG340–35888.3%U341F[16]CCTACGGGRSGCAGCAG341–35891.1%/96.9% E343F[20]TACGGRAGGCAGCAG343–35798.7%A344F(A)[15]GGGGYGCASCAGGSG344–36090.8%A344F(B)[15]ACGGGGCGCAGCAGGCGCGA344–36374.2%U515F[16]GTGCCAGCMGCCGCGGTAA515–53463.3%/99.0% E517F[20]GCCAGCAGCCGCGGTAA517–53399.1%A519R[15]GGTDTTACCGCGGCKGCTG519–53798.0%A519F[15]CAGCMGCCGCGGTAA519–53398.6%U519F[16]CAGCMGCCGCGGTAATWC519–53796.7%/98.5% A685R[27]TTACGGGATTTCACTCCTAC685–70419.5%E685R[28]ATCTACGCATTTCACCGCTAC685–70579.8%U779F[16]GCTAASSGGATTAGATACCC779–79989.9%/5.0%E786F[14]GATTAGATACCCTGGTAG786–80395.2%U789F[16]TAGATACCCSSGTAGTCC789–80797.7%/94.8% A806R[15]GGACTACVSGGGTATCTAAT787–80696.4%E806R[14]GGACTACCAGGGTATCTAAT787–80695.1%U906F[16]GAAACTTAAAKGAATTG906–92398.3%/54.2% A906R[15]CCCGCCAATTCCTTTAAGTTTC906–92797.3%E917F[20]GAATTGACGGGRCCC917–93292.5%A915R[15]GTGCTCCCCCGCCAATTCCT915–93497.1%E939R[14]CTTGTGCGGGCCCCCGTCAATTC917–93993.1%A976R[16]CCGGCGTTGAMTCCAATT957–97692.7%A1040F[16]GAGAGGWGGTGCATGGCC1040–105895.2%U1053F[16]GCATGGCYGYCGTCAG1053–106897.2%/97.2% A1098F[16]GGCAACGAGCGMGACCC1098–111567.0%E1099F[20]GYAACGAGCGCAACCC1099–111497.0%The source of the known primers is labeled.The degenerated sites are defined in Table1.The names of Archaea-specific,Eubacteria-specific,and universal primers are started with‘A’,‘E’and‘U’,respectively.For the universal primers, the coverage rates for both the Archaea and Eubacteria are given(A/E). doi:10.1371/journal.pone.0007401.t003。


反向引物测序比对结果-概述说明以及解释1.引言1.1 概述概述部分的内容:反向引物测序比对结果是生物学和遗传学研究中的一个重要环节。
它通过对DNA序列进行测序,并将其与参考序列进行比对,从而得到反向引物的测序结果。
这项技术的发展促进了基因组学、遗传学以及其他许多领域的研究进展。
在反向引物测序的过程中,研究人员会首先合成反向引物,然后利用该引物与待测序列特异性结合,通过测序仪进行测序。
测序结果会被与已知的参考序列进行比对,以确定相对应的基因或序列信息。
比对结果的分析对于理解反向引物测序的可靠性和准确性至关重要。
通过分析比对结果,我们可以评估测序过程中的潜在错误,并确定反向引物测序的可靠性。
此外,比对结果还可以用来确定测序样本中可能存在的变异、突变或其他遗传变化。
反向引物测序比对结果的意义不仅在于验证反向引物测序的准确性,同时还提供了一种检测和分析基因组中特定区域的方法。
比对结果可以用来研究个体间的遗传差异、基因组的结构和功能等方面。
此外,比对结果还可为医学诊断、药物研发以及基因治疗等领域的研究提供重要参考。
总的来说,反向引物测序比对结果是基因组学和遗传学研究中不可或缺的一部分。
它不仅能够验证反向引物测序的准确性,还为研究人员提供了一种探索基因组和遗传变异的方法。
随着测序技术的不断发展,我们可以期待反向引物测序比对结果的应用范围将进一步拓展,并为更多科学领域带来新的突破。
1.2 文章结构文章结构:本文共分为引言、正文和结论三个部分。
引言部分主要概述了反向引物测序比对结果这一主题的背景和意义,并介绍了本文的结构和目的。
首先,我们会概述反向引物测序的原理和应用,以便读者对这一技术有一个基本的了解。
其次,我们将通过分析反向引物测序比对结果,揭示这些结果的重要性和意义。
最后,我们将总结反向引物测序比对结果,并展望其未来的发展方向。
正文部分是本文的核心内容,具体分为四个小节。
首先,我们会详细介绍反向引物测序的原理,解释其基本原理和操作流程。

学院:______ 班级:_______ 学号:_________ 姓名:__________ 成绩:______ 实验二引物设计及测序结果分析目的:1、掌握常规引物设计的原则及操作流程。
2、熟悉简并引物设计的原理及操作方法。
3、熟悉引物设计软件及在线引物设计工具的操作方法。
4、掌握使用相关软件及在线工具分析测序结果的方法。
内容:1、使用Primer Premier、Oligo、BLAST等软件及在线工具进行常规引物设计,并对引物扩增效率、特异性进行评价。
2、使用DNAMAN软件进行常规引物快速设计。
3、使用NCBI中的在线引物设计工具Primer-BLAST快速设计引物。
4、使用在线工具CODEHOP设计简并引物。
5、使用Chromas、BioEdit软件查阅测序结果峰图文件。
6、使用DNAMAN软件对测序序列进行编辑,进行序列拼接。
软硬件要求:联网计算机,预装Windows 7操作系统,预装IE或Chrome浏览器、英汉电子词典(有道词典或金山词霸),预装DNAMAN7、Primer Premier5、Oligo7、Chromas、BioEdit等生物信息学分析软件。
操作及问题:一、Primer Premier5、Oligo7、BLAST常规引物设计本部分操作将使用Primer Premier5、Oligo7、BLAST等软件及工具设计拟南芥AtBADH基因编码区全长特异引物。
(参考“第四章引物设计及测序结果分析”课件)(一)使用Primer Premier5搜索引物1、在NCBI数据中查找登录号为NM_001198470的序列记录,查阅相关信息,并下载序列将其保存为fasta格式文件。
问题1:该序列是什么类型的序列?该序列编码区在什么位置?2、打开Primer premier5软件,点击键ctrl+V将上一步中下载的序列粘贴入弹出的GeneTank窗口中(或者点击。
3、点击GeneTank窗口中左上角的Primer premier窗口中点击Search Criteria窗口中根据要求选择合适选项及参数,选定后,点击Search Progress窗口中有Search Results窗口;如没有出现数重新搜索引物。
16SrDNA测序结果分析2017-12-131.测序结果文件一般公司DNA测序结果都提供两个文档,一个是序列文档(后缀为.seq),一个是测序峰图文档(后缀.ab1),为碱基的测序质量信息。
(A).seq –序列文件,TEXT的序列文档,可由记事本或BioEdit打开。
(B).ab1-峰图文件,可由BioEdit或Chromas打开察看。
2.切除两端低质量碱基由于Sanger测序技术限制,每个测序反应一般仅有800bp左右比较准确。
一般测序结果的前端大约50个碱基的质量会不好(测序引物的原因),此部分测序峰图通常无法判读。
这是正常现象,需要把此部分碱基切除。
同理,测序后期的碱基质量也比较差(酶活降低与杂质干扰较大等原因),也需要把尾部测序峰图不规则的碱基切除。
因此留下中间碱基质量相对较好(峰图规则)的序列用于后续分析。
方法如下:•用BioEdit 打开正向测序结果峰图文件( ZB10100433 (yangpin1) 16SS(zidai)_Pw_G12.ab1),通过移动左边与左上角的比例标尺,调整峰图的高度与宽度,使DNA每个碱基的峰图大小适合观察。
•从下图看出,前面50多个碱基的峰较乱,此处选择55个开始的碱基。
同理,DNA末端由于酶活力下降等原因,测序质量也逐步变差。
根据峰图的形状,我们也需要切除尾部950bp后的碱基(约末端100bp),只保留56-950之间约900bp的高质量碱基。
••选择BioEdit 显示DNA序列的子窗口(Window菜单->DNA sequence frome…)•然后在 BioEdit 的Sequence菜单->select positions,在弹出窗口中输入56与950,点OK按钮后,就以背景黑的显示已选择的序列。
•再选edit菜单->Copy(或直接按Ctrl-C键),复制序列到一个新的文本文件,保存为16S_rDNA.fas。
增加序列的注释行”>16SF”,代表正向测序序列。
实验名称:基因构造分析实验目的:通过基因克隆、序列分析等方法,研究特定基因的结构和功能,为基因工程和分子生物学研究提供基础数据。
实验时间:2023年3月15日至2023年4月15日实验地点:XX大学分子生物学实验室实验材料:1. 模板DNA:人类基因组DNA2. 引物:针对目标基因设计的引物3. Taq DNA聚合酶4. dNTPs5. 纯化DNA模板6. PCR产物纯化试剂盒7. DNA测序试剂盒8. DNA测序仪实验方法:1. 基因克隆(1)设计引物:根据目标基因的序列,设计一对引物,分别位于目标基因的上下游。
(2)PCR扩增:将纯化后的DNA模板与引物混合,进行PCR扩增,得到目标基因的片段。
(3)克隆载体构建:将PCR产物纯化后,与克隆载体连接,转化大肠杆菌,筛选阳性克隆。
(4)测序:将阳性克隆进行测序,获得目标基因的全序列。
2. 基因序列分析(1)生物信息学分析:将测序结果与已知基因数据库进行比对,分析基因的同源性、保守性等信息。
(2)基因结构分析:根据测序结果,绘制基因结构图,分析基因的编码区、启动子、内含子等结构。
(3)基因表达分析:通过实时荧光定量PCR或RNA测序等方法,检测目标基因在不同组织或细胞中的表达水平。
实验结果:1. 基因克隆通过PCR扩增,成功得到目标基因的片段,长度与预期相符。
将PCR产物与克隆载体连接,转化大肠杆菌,筛选到阳性克隆。
2. 基因序列分析(1)生物信息学分析:将测序结果与NCBI数据库进行比对,发现目标基因与人类基因组中一个已知基因的同源性达到90%。
(2)基因结构分析:通过分析测序结果,绘制出目标基因的结构图,发现该基因包含一个编码区、一个启动子、一个内含子和一个终止子。
(3)基因表达分析:通过实时荧光定量PCR,检测到目标基因在正常组织中高表达,而在肿瘤组织中表达水平显著降低。
实验讨论:1. 本实验通过基因克隆和序列分析,成功研究了一个与人类基因组同源性较高的基因的结构和功能。
测序引物设计指南?PCR引物设计方法:1.引物最好在模板cDNA的保守区内设计。
DNA序列的保守区是通过物种间相似序列的比较确定的。
在NCBI上搜索不同物种的同一基因,通过序列分析软件(比如DNAman)比对(Alignment),各基因相同的序列就是该基因的保守区。
2.引物长度一般在15~30碱基之间。
引物长度(primerlength)常用的是18-27bp,但不应大于38,因为过长会导致其延伸温度大于74℃,不适于TaqDNA聚合酶进行反应。
3.引物GC含量在40%~60%之间,Tm值最好接近72℃。
GC含量(composition)过高或过低都不利于引发反应。
上下游引物的GC含量不能相差太大。
另外,上下游引物的Tm值(meltingtemperature)是寡核苷酸的解链温度,即在一定盐浓度条件下,50%寡核苷酸双链解链的温度。
有效启动温度,一般高于Tm 值5~10℃。
若按公式Tm=4(G+C)+2(A+T)估计引物的Tm值,则有效引物的Tm为55~80℃,其Tm值最好接近72℃以使复性条件最佳。
4.引物3′端要避开密码子的第3位。
如扩增编码区域,引物3′端不要终止于密码子的第3位,因密码子的第3位易发生简并,会影响扩增的特异性与效率。
5.引物3′端不能选择A,最好选择T。
引物3′端错配时,不同碱基引发效率存在着很大的差异,当末位的碱基为A时,即使在错配的情况下,也能有引发链的合成,而当末位链为T时,错配的引发效率大大降低,G和C错配的引发效率介于A、T之间,所以3′端最好选择T。
6.碱基要随机分布。
引物序列在模板内应当没有相似性较高,尤其是3'端相似性较高的序列,否则容易导致错误引发(Falsepriming)。
降低引物与模板相似性的一种方法是,引物中四种碱基的分布最好是随机的,不要有聚嘌呤或聚嘧啶的存在。
尤其3′端不应超过3个连续的G或C,因这样会使引物在GC富集序列区错误引发。
mirRNA引物设计2miRNA常用实验方法;一、miRNA的检测方法;miRNA的realtime-PCR检测方法;1、realtime-PCR引物设计;miRNArealtime-PCR引物设计方法:;1)stem-loopRT引物设计:基于通用的茎;GTCGTATCCAGTGCAGGGTCCGAG;2)realtime上游引物设计:miRNA序列;3)下游引物是通用的,序列miRNA 常用实验方法一、miRNA的检测方法miRNA的realtime-PCR检测方法1、realtime-PCR引物设计miRNA realtime-PCR引物设计方法:1)stem-loop RT引物设计:基于通用的茎环结构,只需要按照不同的miRNA序列修改最末端6个碱基即可。
通用茎环结构序列为:GTCGTATCCAGTGCAGGGTCCGAGGTATTCGCACTGGATACGAC 例如设计miR-1(UGGAAUGUAAAGAAGUAUGUAU)的RT引物,只需在通用茎环序列后架上miRN A3’末端的6个碱基的反向互补序列,即GTCGTATCCAGTGCAGGGTCCGAGGTATTCGCACTGGATACGACATA CAT 2)realtime 上游引物设计:miRNA序列除去3’端6个碱基的剩余部分作为上游引物,如miR-1的上游引物为(注意把U改为T):TGGAATGTAAAGAAGT.检查引物的Tm值(一般参考DNAMAN),如果Tm值较低,则在5’端加GC使Tm 值接近60度。
因此miR-1的上游引物可设计为:GCGCTGGAATGTAAAGAAGT,61.4度。
3)下游引物是通用的,序列为GTGCAGGGTCCGAGGT。
4)引物设计好后,需要通过预试验检测引物的特异性。
一般需要做溶解曲线来检测引物的特异性;同时最好将PCR产物进行电泳检测产物是否单一(因产物长度很小,需要3%以上的琼脂糖胶)。