KingdeeWay实施方法论V7.0
- 格式:pptx
- 大小:2.94 MB
- 文档页数:67


Kingdee金蝶软件实施方法Kingdee是金蝶软件实施方法论,它遵循国际最先进的项目管理理论,集金蝶全体知识工作者的集体智慧,在金蝶客户实践经验的基础上被创造性的提出。
四步实施法中每一步都详细进行了任务分解,定义了每个步骤具体的工作内容、工作时间、工作方式、责任人、工作成果等。
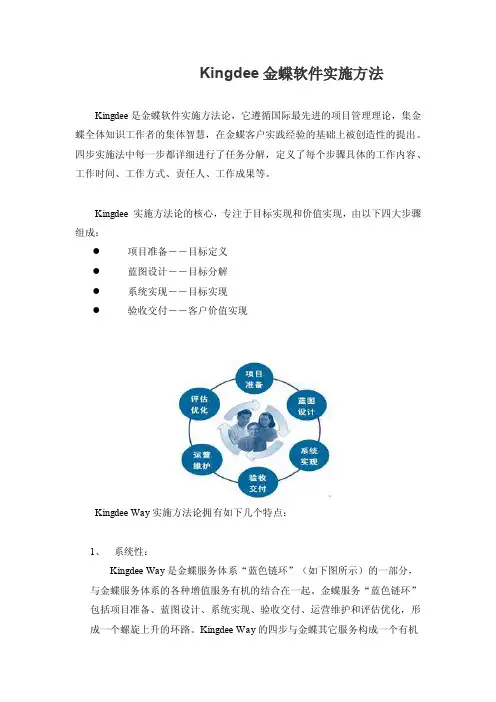
Kingdee 实施方法论的核心,专注于目标实现和价值实现,由以下四大步骤组成:●项目准备--目标定义●蓝图设计--目标分解●系统实现--目标实现●验收交付--客户价值实现Kingdee Way实施方法论拥有如下几个特点:1、系统性:Kingdee Way是金蝶服务体系“蓝色链环”(如下图所示)的一部分,与金蝶服务体系的各种增值服务有机的结合在一起。
金蝶服务“蓝色链环”包括项目准备、蓝图设计、系统实现、验收交付、运营维护和评估优化,形成一个螺旋上升的环路。
Kingdee Way的四步与金蝶其它服务构成一个有机整体,为客户提供企业全生命周期的服务,真正体现为顾客创造价值,“帮助顾客成功”的公司使命。
2、标准化:Kingdee Way规范和指导金蝶实施顾问的日常实施工作,使任何来源于金蝶的实施服务建立在一个更高的服务质量基准之上。
标准化程度反映了金蝶项目管理的成熟度,Kingdee Way规范了整个公司所有实施项目的工作方法,而且这种方法是建立在金蝶客户的实践基础之上的,并遵循国际最先进的项目管理理论。
标准化要求实施顾问必须首先掌握Kingdee Way,也就意味着进入企业的实施顾问已经拥有了先进项目管理的思想和无数间接的实践经验。
3、基于价值实现:Kingdee Way将客户价值实现和金蝶实施服务捆绑在一起,实施过程不只是简单的为客户安装了一套管理软件,而是为客户提供了超越软件本身价值的递进式累积价值,在每一步骤的实施工作都会关注客户价值的实现。
4、体现企业个性化:Kingdee Way采用标准化、规范性流程,结合企业具有核心价值的个性化管理特质,为企业提供个性化的实施服务,利用金蝶具有自主知识产权、达到国际先进水平的Apuisc应用服务器和基于服务导向架构(SOA)的商业操作平台(BOS),快速配置,快速实施,快速见效。


Chapter 7 ReportSection 1 IntroductionUsing a ReportReports are essential tools to help us reflect and record the data process and running states of production. Reports can reflect the real-time production of the system, as well as provide historical statistical data that can be analyzed by engineers to help them understand the real-time production situation.KingView provides a build-in report system with functions for data calculation, conversion, statistical analysis and report printing. You can set the report format and configure the report according to your specifications. You can make both real-time and history reports, as well as various report templates, which can be reused.Section 2 Real-time Data ReportCreating a Real-time Data ReportSetting up a real-time data report:1. Create a new picture and call it: “real-time data report picture”2. Select from toolbox, insert the following text into the text box: “real-time datareport”.3. Select from toolbox, draw a real-time data report window in the picture as figure 7-1 shows:Figure 7-1 Real-time data report windowThe “Report toolbox” will appear automatically, double-click in the gray part of the window and the following “ Design report” dialogue box will popup as figure 7-2 shows:Figure 7-2 Report design dialog boxSet the dialogue box as follows:Report control name: Report1Number of rows: 6Number of columns: 104. To input static text: select cell area from A1 to J1, from the “Report toolbox” select “Unite cells”, and insert “real-time data report “demo” into the new combined cell.Using the same method input any other static text as figure 7-3 shows:Figure7-3 Static text in real-time data report window5. Inserting the dynamic tag: combine cells B2 to C2, and in the new combined cell insert: “=\\local\$Date”. (The “Input tag” button from the “Report toolbox” can be used for inserting any predefined tag)Using the same method you can insert any other dynamic tag as figure 7-4 shows:Figure 7-4 Report window after settingNote: Without the “=” before the tag name, this means the tag will be dealt with as static text.6. Select “save all pictures” from the “File” menu to save the settings.7. Select “Switch to View” from the “File” menu to enter the running system. The default running picture of the system might not be your “real-time data report picture”, if this is the case; from the “Picture” menu select “open” and choose the right picture, it will open as figure 7-5 shows:Figure 7-5 Real-time data report when runningPrinting Real-time Data ReportHow to set the real-time data report for auto-printing:1. Add a button in the “real-time data report picture”, edit the button text: “real-time data report auto-printing”2. Input following script in button popup event as the figure 7-6 shows:Figure 7-6 Script for real-time data report auto-printing3. Select “confirm” to close the script-editing box. When the system is running, just click the button to print the data report.How to set the real-time data report to print manually:1. Add a button in the “real-time data report picture”, add the text: “real-time data report manual-printing”2. Input the following script in the button popup window as the figure 7-7 shows:Figure 7-7 Script for real-time data report manual-printing3. Select “confirm” to close script-editing box.4. When the system is running, just click the button to popup the “printing property”dialogue box as the figure 7-8 shows:Figure 7-8 Printing property dialog box5. Set the “printing property” dialogue box, click “confirm” and the data report will beprinted.How to set real-time data report page layout:1. Add a button to the “real-time data report picture”, edit the button text to: “real-time datareport page layout setting”.2. Input the following script in button popup window as the figure 7-9 shows:Figure 7-9 Script for real-time data report page layout3. Select “confirm” to close the script-editing box.4. When the system is running, just click the button to popup the “Page setup” dialogue box as the figure 7-10 shows:Figure 7-10 Dialog box for page setup5. Set report property in the “Page setup” dialogue box, and then click “confirm” to finish setting.How to set real-time data report’s print preview:1. Add a button to the “real-time data report picture”, edit the button text to: “real-time data report preview printing”.2. Input the following script in the button popup window as the figure 7-11 shows:Figure 7-11 Script for real-time data report’s print preview3. Select “confirm” to close the script-editing box.4. When the system is running, just click the button to automatically hide the development and running system window and enter the print preview window as figure 7-12 shows:Figure 7-12 Preview print window5. Click “close” to end print preview, the system will automatically return to the development and running system window.Saving a Real-time Data ReportHow to save a real-time data report to an appointed folder using the current time as the file name:1. Create a folder in the current project called: “real-time data folder”2. Add a button on the “real-time data picture”, change the button text to: “save real-time data report”3. Insert the following scripts in the button dialogue box as the figure 7-13 shows:Figure 7-13 Script of saving real-time data reportScript is shown as follows:String filename;Filename = InfoAppDir() + “\real data folder\” +StrFromReal(\\local\$Year, 0, “f”) +StrFromReal(\\local\$Month, 0, “f”) +StrFromReal(\\local\$Date, 0, “f”) +StrFromReal(\\local\$Hour, 0, “f”) +StrFromReal(\\local\$Minute, 0, “f”) +StrFromReal(\\local\$Second, 0, “f”) + “.rtl”;ReportSaveAs (“Report”, filename);4. Select “confirm” to close the script-editing box. Using this button when the system is running will save the real-time data report using the current time as the file name.Search for a Real-time Data ReportUsing the script offered by the system you can easily save a real-time data report to an appointed folder, using the current time as the file name, you can then search for the report file in KingView as follows:The search is carried out using a drop list combo box and the report control.1. Define a memory string tag in the tagname dictionaryTag name: Report_SelectTag type: memory stringInitial value: empty2. Create a new picture called “search for real-time data report”3. Select from the toolbox, insert the following text in the picture: “search for real-time data report”4. Select from the toolbox, draw a real-time data report window in the picture, control name is: “Report2”.5. Select from the toolbox, insert a “Drop list combo box” control in the picture, control property’s settings are as shown in figure 7-14 shows:Figure 7-14 Dialog box of the dropdown menu6. Right click in the picture and insert the following script in “Picture scripts” as figure 7-15 shows:Figure 7-15 Report file script in dropdown boxScript is shown as follows:String filename;Filename=InfoAppDir()+”\ real-time data folder \*.rtl”;ListClear(“List1”);ListLoadFileName(“List1”,filename);The function of the above script is to display the file name of the real-time report, which has been saved to the “real-time data folder in the current project path” from the dropdown combo box.7. Add a button to the picture and insert the following text “search for real-time data report”8. Input the following script in button popup window as figure 7-16 shows:Figure 7-16 Script of selected file in search dropdown boxScript is shown as follows:String filename1;String filename2;Filename1=InfoAppDir()+”\real-time data folder\”+\\local\Report_Select;ReportLoad(“Report2”,filename1);Filename2=InfoAppDir()+”\real-time data folder\*.rtl”;ListClear(“List1”);ListLoadFileName(“List1”, filename2);The function of the above script is to display the report file data for the filename that is selected from the dropdown menu in the Report2 window. The value of the “\\local \Report_Select” is the filename selected from the dropdown menu.9. Select “Save all pictures” from “file” menu to save the settings.10. Then select “Switch to View” from the “File” menu to run this picture. The report file names in the appointed path will be displayed when you click the dropdown menu select any of the report file names, the report file data will then be displayed in the report window. Then click the “search for real-time data report” button; you are now able to query the real-time data report.Section 3 Historical Data ReportCreating a Historical data ReportCreating a historical data report:1. Create a new picture called “Historical data report picture”2. Select form the toolbox and insert the text “Historical data report” in the picture3. Select from the toolbox, draw a historical data report window in the picture, and name the control: Report5, the design table is as figure 7-17 shows:Figure 7-17 Historical data report designSearch for a Historical data ReportUsing the function ReportSetHistData2 offered by KingView, you can search for tag data at a specified start time and with a specified time interval from history library of KingView. Setting as follows:1. Add a button to the picture, enter “search for historical data report” as the button text2. Insert the following script in button event dialogue box as figure 7-18 shows:Figure 7-18 Script of search for historical data report3. Select “Save all” from “File” menu to save the settings.4. Then from “File” menu select “Switch to View” to enter the running system as figure 7-19shows:Figure 7-19 Dialog box of search for report historyThe dialogue box for searching a historical report has three properties: report property, timeproperty and tag property.Report property: you can set the display format of the report search as figure 7-19 shows.Time property: you can set the start/end time and the interval time of the search as figure 7-20 shows.Figure 7-20 Time property in history report search windowTag property: you can select the tags needed to query the historical data as figure 7-21 shows:Figure 7-21 Tag property in history report search window5. Click “confirm” after completing the settings; the tag “Raw_Oil_Depth” can be displayed in the control bar of the historical data report, therefore allowing you to search for results as figure 7-22 shows:Figure 7-22 Search for historical dataOther Uses of Historical data ReportsOne-minute data report demo:A one-minute data report can be obtained using the report window tool combined with script offered by KingView, the process is:1. Create a new picture called “One-minute data report picture”.2. Select form tool box, insert the following text into the picture: “One-minute datareport”.3. Select from tool box, draw a report window in the picture (row: 64, column: 5), and the control name is: Report6, table design as figure 7-23 shows:Figure 7-23 Report design of one-minute data4. From the “project catalogue display zone” on the left of the TouchExplorer window select “script” and then “data change script” and then double-click the “new” icon on the right of the“catalogue content display zone”, insert the following script in the edit popup box as figure 7-24 shows:Figure 7-24 Data change scriptScript shown as follows: execute script when systems tag \\local\$second changing.Long row;Row=\\local\$second+4;ReportSetCellString(“Report6”,2,2,\\local\$date);ReportSetCellString(“Report6”,row,1,\\local\$time);ReportSetCellString(“Report6”,row,2,\\local\Raw_Oil_Depth);ReportSetCellString(“Report6”,row,3,\\local\Catalyst_Depth);ReportSetCellString(“Report6”,row,4,\\local\Refined_Oil_Depth);If (row= =63)ReportSetCellString2 (“Report6”, 4, 1, 63, 5, “”);The function of the above script is to write the value of the tag \\local\Raw_Oil_Depth, \\local\Catalyst_Depth, \\local\Refined_Oil_Depth per second to the report automatically.5. Select “Save all” from “File” menu to save the settings.6. From the “File” menu select ‘Switch to View” to enter the running system; the system will write data to the report automatically as figure 7-25 shows:Figure 7-25 One-minute data report demoOne-minute data search:Using KingView’s search for historical data function ReportSetHistData(), you can search for historical data with automatically, and obtain average values for one-minute data, the process is:1. Create a new picture called “search for one-minute data report picture”.2. Select form tool box, insert the following text into the picture: “search for one-minute data report”.3. Select from tool box, draw a report window in the picture (row:33, column:5), and the control name is: Report7, table design as figure 7-26 shows:Figure 7-26 Report design of searching for one-minute data4. Fill in “=Average (‘b3:b32’)” in cell b33 of report window, and fill in “=Average (‘c3:c32’)” in cell c33, and fill in “=Average (‘d3:d32’)” in cell d33 as figure 7-27 shows:Figure 7-27 Fill in cell in report window5. In “project catalogue display” zone on the left of the TouchExplorer window select “script” and then “data change script” and then double-click the “new” icon on the right of the “catalogue content display” zone, insert the following script in the edit popup box as figure 7-28 shows:Figure 7-28 Script of data changeData change scripts is shown as follows: execute script when system tag \\local\$second changing.Long StartTime;StartTime=HTConvertTime (\\local\$year, \\local\$month, \\local\$date, \\local\$hour, \\local\$minute, 0);StartTime=StartTime-60;ReportSetTime (“Report7”, StartTime, 2, “a3:a32”);ReportSetHistData (“Report7”, “\\local\Raw_Oil_Depth”, StartTime, 2, “b3:b32”);ReportSetHistData (“Report7”, “\\local\Catalyst_Depth”, StartTime, 2, “c3:c32”);ReportSetHistData (“Report7”, “\\local\Refined_Oil_Depth”, StartTime, 2, “d3:d32”);The function of above the script is to search the tag \\local\Raw_Oil_Depth, \\local\Catalyst_Depth, \\local\Refined_Oil_Depth for one-minute at 2 second intervals. The time is displayed in cell of Report7 from a3 to a32 and the results are displayed respectively in cell of Report7 from b3 to b32, from c3 to c32, from d3 to d32.6. Select “Save all” from “File” menu to save the settings.7. From the “File” menu select ‘Switch to View” to enter the running system; the system will write data to the report automatically as figure 7-29 shows:Figure 7-29 Report demo of searching for one-minute data8. In a one-minute data report, the average value of the tag \\local\Raw_Oil_Depth, \\local\Catalyst_Depth, \\local\Refined_Oil_Depth is displayed respectively in cell b33, c33, d33, as figure 7-30 shows:Figure 7-30 Average value of one-minute dataReview1. Design a day report using the auto-save, auto-print functions and manually searches for saved reports etc.。