布兰查德《宏观经济学》课后习题及详解(汇率制度)【圣才出品】
- 格式:pdf
- 大小:784.32 KB
- 文档页数:17
第5章商品市场和金融市场:IS-LM模型一、概念题1.IS曲线(IS curve)答:IS曲线是指在商品的总产出等于总需求的情况下利率与总产出之间关系的曲线,它表示了产品市场的均衡条件,在IS曲线上的每一点都满足产品的总需求等于总产出。
财政扩张使得IS曲线向右移动,导致产出增长和利率上升;财政紧缩使得IS曲线向左移动,导致产出减少和利率下降。
2.LM曲线(LM curve)答:LM曲线是指在货币需求量等于货币供给量的情况下总产出与利率之间关系的曲线,它表示了金融市场的均衡条件,在LM曲线上的每一点均满足货币需求等于货币供给。
货币扩张使得LM曲线向下移动,产出增加,利率下降;货币紧缩使得LM曲线向上移动,产出减少,利率上升。
3.财政紧缩(fiscal contraction,fiscal consolidation)答:财政紧缩,是指政府在财政支出规模不变的前提下增加税收或是在财政收入规模不变的前提下减少政府支出,或是既增税又减少支出来收缩总需求的财政政策。
这是与扩张性财政政策相对应的财政政策,它可以通过减少公共支出或提高税收两条途径来实现。
(1)在减少公共支出方面,财政政策需要在维持债务性支出和基金性支出不变的前提下,减少经常性支出和建设性支出。
为了减少经常性支出,政府需要压缩国家机关和人员的支出、非营利性社会事业及其人员的支出、社会保障体系及其人员的支出。
为了减少建设性支出,政府需要大力压缩公共工程支出。
当然,政府在压缩公共支出总量的同时,还要根据经济建设的需要调整公共支出的结构。
(2)在提高税收方面,紧缩性财政政策可以从扩大税基(如缩小减免税或退税的企业范围、降低个人所得税的收入起征点)和提高税率(如提高个人所得税累进税率和将企业的消费型增值税改为生产型增值税)两方面着手。
财政支出的减少和税收的提高,既直接减少了投资和消费需求,又通过降低民间的收入而间接收缩了消费需求。
在财政预算上,财政支出降低和税收提高同步进行,意味着财政盈余的出现或赤字的减少。
第14章预期:基本工具一、概念题1.名义利率(nominal interest rates)答:名义利率又称“货币利率”,是包含了对通货膨胀风险补偿的利率。
与“实际利率”相对而言,是包括了物价变动的利息率,表现为银行挂牌执行的存款、贷款的利率。
现实的经济生活中物价水平具有不稳定性,并且物价水平的上涨是一种普遍的趋势。
划分名义利率和实际利率的理论意义在于其提供了分析通货膨胀条件下利率变动的工具。
在经济管理中,能操作的是名义利率,但对经济关系产生实质影响的是实际利率。
名义利率近似值的计算公式为:i=π+r。
其中,i为名义利率,r为实际利率,π为借贷期内物价的变动率(通货膨胀率)。
由于通货膨胀还会使利息部分贬值,名义利率还应作向上的调整。
这样,名义利率的计算公式可以写成:i=(1+π)(1+P)-1。
名义利率随通货膨胀的变化而变化并非同步的。
由于人们对价格变化的预期往往滞后于通货膨胀的变化,所以相对于通货膨胀率的变化,名义利率的变化也往往有滞后的特点,但也不是绝对的。
2.实际利率(real interest rates)答:实际利率,与“名义利率”相对而言,是指名义利率扣除通货膨胀因素后的利率。
实际利率为正值时,有利于吸收储蓄、降低通货膨胀率;实际利率为负值时,则会减少储蓄、刺激金融投机、恶化通货膨胀。
其计算公式为:1-=+名义利率通货膨胀率实际利率通货膨胀率当通货膨胀率很低时,可近似记为:实际利率=名义利率-通货膨胀率。
3.通货紧缩陷阱(deflation trap )答:通货紧缩陷阱是指较低的经济活动水平使经济陷入通货紧缩后,由于与产出下降,实际利率升高将导致投资和消费下降,从而导致产出进一步下降,经济陷入通货紧缩的恶性循环之中的现象。
4.自然利率(natural interest rate )答:自然利率是指假设所有价格具有充分弹性,令总需求与总供给永远相等时的利率水平,即与产出的自然水平相对应的利率值。
第14章 预期:基本工具一、概念题1.名义利率(nominal interest rates )答:名义利率又称“货币利率”,是包含了对通货膨胀风险补偿的利率。
与“实际利率”相对而言,是包括了物价变动的利息率,表现为银行挂牌执行的存款、贷款的利率。
现实的经济生活中物价水平具有不稳定性,并且物价水平的上涨是一种普遍的趋势。
划分名义利率和实际利率的理论意义在于其提供了分析通货膨胀条件下利率变动的工具。
在经济管理中,能操作的是名义利率,但对经济关系产生实质影响的是实际利率。
名义利率近似值的计算公式为:其中,为名义利率,为实际利率,为借贷期内物价的变动率(通货膨胀率)。
由于通货膨胀还会使利息部分贬值,名义利率还应作向上的调整。
这样,名义利率的计算公式可以写成:名义利率随通货膨胀的变化而变化并非同步的。
由于人们对价格变化的预期往往滞后于通货膨胀的变化,所以相对于通货膨胀率的变化,名义利率的变化也往往有滞后的特点,但也不是绝对的。
2.实际利率(real interest rates )i r π=+i r π()()111i P π=++-答:实际利率,与“名义利率”相对而言,是指名义利率扣除通货膨胀因素后的利率。
实际利率为正值时,有利于吸收储蓄、降低通货膨胀率;实际利率为负值时,则会减少储蓄、刺激金融投机、恶化通货膨胀。
其计算公式为:当通货膨胀率很低时,可近似记为:3.预期贴现值(expected present discounted value )答:预期贴现值,即贴现值或称现值,是指按现行利率为获得一个既定的未来货币量而在现期所需要的货币量。
现值可用倒求本金的方法计算。
由终值求现值,称为贴现。
在贴现时使用的利息率称为贴现率。
令为第期的价值,为现值,则现值的计算公式可由终值的计算公式导出:上述公式中的称为现值系数或贴现系数,可以写成,现值的计算公式可以写为: 。
4.贴现因子(discount factor )答:贴现因子也称折现系数、折现参数。
第17章 预期、产出和政策一、概念题1.总私人支出(aggregate private spending ,or private spending ) 答:总私人支出包括消费和投资两部分,表示为:。
总私人支出是收入的递增函数:收入越高,消费和投资越高;它是税收的递减函数:高税收使得消费下降;它是实际利率的递减函数:高实际利率使得投资下降。
2.动物精神(animal spirits )答:动物精神又称为“血气冲动”、“本能冲动”、“动物本能”、“创业冲动”,是指用来说明企业家作出投资决策时的心理状态,以及这种心理状态对投资的影响。
凯恩斯认为,企业家是否进行一项投资,并不是十分理性地进行冷静周密的计算后作出决定,而是一时“动物本能”的结果。
因此,投资是一种动物本能影响的活动。
私人投资不仅取决于企业家对未来投资收益的估算,而且还受到企业家一时一地的心理状态和情绪的影响。
以后,英国经济学家J.罗宾逊在分析投资问题时,也运用了动物本能这一概念。
3.适应性预期(adaptive expectations )答:适应性预期是一种预期形成理论,指对某一经济变量,不仅依据其现期的实际值,而且依据其现期实际值与在上一期对其做出的本期的估计值之间的误差,进行相应调整,得()()(),,,A Y T r C Y T I Y r ≡-+Y T r出对其未来估计值的预期。
适应性预期产生于20世纪50年代,是由菲利普·卡甘在一篇讨论恶性通货膨胀的文章中提出来的,很快在宏观经济学中得到广泛的应用。
适应性预期假定经济人根据以前的预期误差来修正以后的预期。
适应性预期模型的要点是预期变量依赖于该变量的历史信息。
某个时期的适应性预期价格等于上一时期预期的价格加上常数与上期价格误差(上个时期实际价格与预期价格之差)之和。
即预期价格是过去所有实际价格的加权平均数,权数是常数的函数。
适应性预期在物价较为稳定的时期能较好地反映经济现实。
第19章 开放经济中的物品市场一、概念题1.国内产品的需求(demand for domestic goods )答:在开放经济中,对国内产品的需求可表示为:其中,前面的三项——消费()、投资()和政府支出()——构成了产品的国内需求;是实际汇率,即用国内产品形式表示的国外产品的价格,因此就是用国内产品表示的进口价值;是出口价值。
部分为对国内产品的国内需求,X 是对国内产品的国外需求,两者相加即表示对国内产品的总需求。
2.产品的国内需求(domestic demand for goods )答:假定消费与可支配收入()正相关;投资与产出()正相关,与实际利率()负相关;政府支出()是给定的,暂时不考虑预期对影响支出的作用。
则产品的国内需求可以表示为:3.协调,七国集团(coordination ,G7)答:协调是指为了减少国际间的经济波动或金融动荡,政府间所进行的一系列谈判、合/Z C I G IM X ε≡++-+C I G ε/IM εX /C I G IM ε++-Y T -Y r G ()()()(),国内需求 C I G C I GY T Y r =++=++-++-,作、妥协的过程。
从实际情况看,由于各国间的利益冲突,国家间的宏观协调非常有限。
这可能有以下原因:①协调就意味着一些国家可能比其他国家贡献得更多,但它们可能并不愿意这样做。
②假定只有一些国家处于衰退中,那些并没有处于衰退之中的国家可能就不愿意提高它们自己的需求;但是如果它们不这么做,那些扩张的国家相对于不扩张的国家就可能会出现贸易赤字。
③假定一些国家已经有巨大的贸易赤字。
这些国家可能就不愿意削减税收或者进一步提高支出,因为这样会更加提高它们的贸易赤字。
它们会要求其他国家作出更多的调整,然而其他的国家可能并不愿意这么做。
④各个国家都会承诺协调,然后并不实现其诺言。
一旦所有的国家都同意提高支出,那么,每一个国家都会有不实行的动机,以从其他国家的需求提高中获益,从而改善其贸易状况。
Chapter 11. a.True. b.True. c.False. d.True. e.False. f.False.2. a. 1960-98 1997-99-------------------US 3.1% 3.8%EU 3.1% 2.5%Japan 5.8%-1.0%While the US growth rate higher than its long-run average over the period, the growth rate has slowed relative to long-run averages in both the EU and Japan over the last few years.b. Sometimes the economy is growing quickly, other times it is growing slowly or even contracting. The last few years of rapid growth in the US do not imply that the long-run average rate of growth has increased back to its pre-1974 level.3. a. The data in the web page are: Real Gross Domestic Product,Real Final Sales of Domestic Product, and Real Gross National Product, Quarterly, 1959-96[Percent change from preceding quarter]--------------------------------------------------------Gross Final sales Grossdomestic of domestic nationalproduct product product-------------------------------------------------------1959: I 8.6 9.2 8.6II11.27.311.1III-0.3 5.3-0.2IV 1.7-1.3 1.91996: I 1.8 2.6 1.8II 6.0 5.2 5.7III 1.00.20.6IV 4.3 4.5 4.9--------------------------------------------------------suggesting that recessions typically last two-three quarters and that the most severe recessions in that period were the recessions of 1974-75 and 1981-82.b. Percentage Changes in:Output GrowthInflation1968: 4.7 4.4I7.5 4.7II7.1 4.1III 3.0 3.8IV 1.8 5.51969: 3.0 4.7I 6.2 3.8II 1.0 5.0III 2.3 5.8IV-2.0 5.11970: 0.1 5.3I-0.7 6.0II0.6 5.7III 3.7 3.4IV-3.9 5.41971: 3.3 5.2I11.3 6.4II 2.3 5.5III 2.6 4.4IV 1.1 3.3If history simply repeats itself, the United States might have a short recession (lasting perhaps oneyear) accompanied by an acceleration in the rate of inflation by about one percentage point.4. a. Banking services, business services.b. Not only has the relative demand for skilled workers increased but the industries wherethis effect is the strongest are making up a greater fraction of the economy.5. 1. Low unemployment might lead to an increase in inflation.2. Although measurement error certainly contributes to the measured slowdown ingrowth, there are other issues to consider as well, including the productivity of newresearch and accumulation of new capital.3. Although labor market rigidities may be important, it is also important to consider thatthese rigidities may not be excessive, and that high unemployment may arise from flawed macroeconomic policies.4. Although there were serious problems with regard to the management of Asian financial systems, it is important to consider the possibility that the flight of foreign capital from thesecountries worsened the situation by causing a severe stock market crash and exchange rate depreciation.5. Although the Euro will remove obstacles to free trade between European countries,each country will be forced to give up its own monetary policy.* 6. a. From Chapter 1: US output 1997=$8b; Ch ina output 1996=$.84b. Note that China’s outputin 1997 is $(.84)*(1.09) b. Equating output for some time t in the future:8*(1.03)t=(.84*1.09)*(1.09)t8/(.84*1.09)=(1.09/1.03)t8.737=(1.058)tt =ln(8.737)/ln(1.058) H38yrsb. From Chapter 1: US output/worker in 1997=$29,800; China output/per worker in1996=$70029.8*(1.03)t=(.7*1.09)*(1.09)tt H65 yearsChapter 21. a. False.b. Uncertain: real or nominalGDP. c. True.d. True.e. False. The level of the CPI means nothing. Its rate of change tells us about inflation.f. Uncertain. Which index is better depends on what we are trying to measure—inflationfacedby consumers or by the economy as a whole.2. a. +$100; Personal ConsumptionExpenditures b. nochange:intermediategoodc. +$200 million; Gross PrivateDomesticFixedInvestmentd. +$200 million; Net Exportse. no change: the jet was already counted when it was produced, i.e., presumably whenDelta(or some other airline) bought it new as an investment.*3. a. Measured GDP increases by $10+$12=$22.b. True GDP should increase by much less than $22 because by working for an extra hour,you are no longer producing the work of cooking within the house. Since cooking within the house is a final service, it should count as part of GDP. Unfortunately, it is hard to measure the value of work within the home, which is why measured GDP does not include it.4. a. $1,000,000 the value of the silver necklaces.b. 1st Stage:$300,000.2ndStage:$1,000,00-$300,000=$700,000.GDP: $300,000+$700,000=$1,000,000.c. Wages: $200,000 + $250,000=$450,000.Profits: ($300,000-$200,000)+($1,000,000-$250,000-300,000)=$100,000+$450,000=$550,000.GDP:$450,000+$550,000=$1,000,000.5. a. 1998 GDP: 10*$2,000+4*$1,000+1000*$1=$25,0001999 GDP: 12*$3,000+6*$500+1000*$1=$40,000Nominal GDP has increased by 60%.b. 1998 real (1998) GDP: $25,0001999 real (1998) GDP: 12*$2,000+6*$1,000+1000*$1=$31,000Real (1998) GDP has increased by 24%.c. 1998 real (1999) GDP: 10*$3,000+4*$500+1,000*$1=$33,0001999 real (1999) GDP: $40,000.Real (1999) GDP has increased by 21.2%.d. True.6. a. 1998 base year:Deflator(1998)=1; Deflator(1999)=$40,000/$31,000=1.29Inflation=29%b. 1999 base year:Deflator(1998)=$25,000/$33,000=0.76; Deflator(1999)=1Inflation=(1-0.76)/0.76=.32=32% c. Yes7. a. 1998 real GDP = 10*$2,500 + 4*$750 + 1000*$1 = $29,0001999 real GDP = 12*$2,500 + 6*$750 + 1000*$1 = $35,500b. (35,500-29,000)/29,000 = .224 = 22.4%c. Deflator in 1998=$25,000/$29,000=.86Deflator in 1999=$40,000/$35,500=1.13Inflation = (1.13 -.86)/.86 = .314 = 31.4%.8. a. The quality of a routine checkup improves over time. Checkups now may includeEKGs, for example. Medical services are particularly affected by this problem due toconstant improvements in medical technology.b. You need to know how the market values pregnancy checkups with and withoutultra-sounds in that year.c. This information is not available since all doctors adopted the new technologysimultaneously. Still, you can tell that the quality adjusted increase will be lower than20%.*9. a. approximately 2.5% b. 1992 real GDP growth: 2.7%;unemployment rate Jan 92: 7.3%; unemployment rate Jan 93: 7.3%Supports Okun's law because the unemployment rate does not change when the growth rate of real GDP is near 2.5% c. -2 percentage points change in the unemployment rate; 5percent GDP growth d. The growth rate of GDP must increase by 2.5 percentage points.Chapter 31. a. True.b. False. Government spending was 18% if GDP without transfers.c. False. The propensity to consume must be less than one for our model to be welldefined.d.True.false.f. False. The increase in output is one times the multiplier.2. a. Y=160+0.6*(Y-100)+150+150 0.4Y=460-60 Y=1000b. Y D=Y-T=1000-100=900c. C=160+0.6*(900)=7003. a. No. The goods market is not in equilibrium. Frompart 2a, Demand=1000=C+I+G=700+150+150b. Yes. The goods market is in equilibrium.c. No. Private saving=Y-C-T=200. Public saving =T-G=-50. National saving (or inshort, saving) equals private plus public saving, or 150. National saving equalsinvestment.4. a. Roughly consistent. C/Y=700/1000=70%; I/Y=G/Y=150/1000=15%.b. Approximately -2%.c. Y needs to fall by 2%, or from 1000 to 980. The parameter c0needs to fall by20/multiplier,or by 20*(.4)=8. So c0needs to fall from 160 to 152.d. The change in c0(-8) is less than the change in GDP (-20) due to the multiplier.5. a. Y increases by 1/(1-c1) b. Y decreases by c1/(1- c1)c. The answers differ because spending affects demand directly, but taxes affectdemand through consumption, and the propensity to consume is less than one.d. The change in Y equals 1/(1-c1) - c1/(1- c1) = 1. Balanced budget changes in G and Tare not macroeconomically neutral.e. The propensity to consume has no effect because the balanced budget tax increase abortsthe multiplier process. Y and T both increase by on unit, so disposable income, and hence consumption, do not change.*6. a. The tax rate ilessthanone.b.Y=c0+c1Y D+I+G impliesY=[1/(1-c1+c1t1)]*[c0-c1t0+I+G]c. The multiplier = 1/(1-c1+c1t1) <1/(1- c1), so the economy responds less to changes inautonomous spending when t1is positive.d. Because of the automatic effect of taxes on the economy, the economy responds less tochanges in autonomous spending than in the case where taxes are independent of income. So output tends to vary less, and fiscal policy is called an automatic stabilizer.*7. a. Y=[1/(1-c1+c1t1)]*[c0-c1t0+I+G] b. T = c1t0+ t1*[1/(1-c1+c1t1)]*[c0-c1t0+I+G]c. Both Y and T decrease.d. If G is cut, Y decreases even more.Chapter 41.a.True.b.Fals.c.True.d.True.e.False.f.False.g.True.2. a. i=0.05: Money demand = $18,000; Bond demand = $32,000i=.1: Money demand = $15,000; Bond demand = $35,000b. Money demand decreases when the interest rate increases; bond demand increases. Thisis consistent with the text.c. The demand for money falls by 50%. d. The demand formoney falls by 50%.e. A 1% increase (decrease) in income leads to a 1% increase (decrease) in money demand.This effect is independent of the interest rate.3. a. i=100/$P B–1; i=33%; 18%; 5% when $P B=$75; $85; $95.b. Negative.c. $P B=100/(1.08) $934. a. $20=M D=$100*(.25-i) i=5%b. M=$100*(.25-.15)M=$105. a. B D= 50,000 - 60,000 (.35-i)An increase in the interest rate of 10% increases bond demand $6,000.b. An increase in wealth increases bond demand, but has no effect on money demand.c. An increase in income increases money demand, but decreases bond demand.d. When people earn more income, this does not change their wealth right away. Thus,they increase their demand for money and decrease their demand for bonds.6. a. Demand for high-powered money=0.1*$Y*(.8-4i)b. $100 b = 0.1*$5,000b*(.8-4i) i=15%c. M=(1/.1)*$100 b=$1,000 b M= M d at the interest derived in part b.6. d. If H increases to $300, falls to 5%.e. M=(1/.1)*$300 b=$3,000 b7. a. $16 is withdrawn on each trip to the bank.Money holdings—day one: $16; day two: $12; day three: $8; day four: $4.b. Average money holdings are $10.c. $8 dollar withdrawals; money holdings of $8; $4; $8; $4.d. Average money holdings are $6.e. $16 dollar withdrawals; money holdings of $0; $0; $0; $16.f. Average money holdings are $4.g. Based on these answers, ATMs and credit cards have reduced money demand.8. a. velocity=1/(M/$Y)=1/L(i)b. Velocity roughly doubled between the mid 1960s and the mid 1990s.c. ATMS and credit cards reduced L(i) so velocity increased.Chapter 51.a.Trub.Truc.Fal.d. False. The balanced budget multiplier is positive (it equals one), so the IS curve shiftsright.e. False.f. Uncertain. An increase in G leads to an increase in Y (which tends to increaseinvestment), but an increase in the interest rate (which tends to reduce investment).g. True.*2. Firms deciding how to use their own funds will compare the return on bonds to the return on investment. When the interest rate on bonds increases, they become more attractive, and firms are more likely to use their funds to purchase bonds, rather than to finance investment projects.a.Y=[1/(1-c1)]*[c0-c1T+I+G]The multiplier is 1/(1-c1).b. Y=[1/(1-c1-b1)]*[c0-c1T+ b0-b2i +G]The multiplier is 1/(1-c1-b1). Since the multiplier is larger than the multiplier in part a, the effect of a change in autonomous spending is bigger than in part a.c. Substituting for the interest rate in the answer to partb: Y=[1/(1-c1-b1+ b2d1/d2)]*[c0-c1T+ b0+(b2*M/P)/d2+G]The multiplier is 1/(1-c1-b1+ b2d1/d2).d. The multiplier is greater (less) than the multiplier in part a if (b1- b2d1/d2) is greater (less)than zero. The multiplier is big if b1is big, b2is small, d1is small, and/or d2is big, i.e., if investment is very sensitive to Y, investment is not very sensitive to i, money demand is not very sensitive to Y, money demand is very sensitive to i.4. a. The IS curve shifts left. Output and the interest rate fall. The effect on investmentis ambiguous because the output and interest rate effects work in opposite directions: the fall in output tends to reduce investment, but the fall in the interest rate tends to increase it.b. From 3c: Y=[1/(1-c1-b1)]*[c0-c1T+ b0-b2i +G]c. From the LM relation: i= Y*d1/d2–(M/P)/d2To obtain the equilibrium interest rate, substitute for Y from part b.d. I= b0+ b1Y- b2i= b0+ b1Y- b2Y* d1/d2+ b2(M/P)/d2To obtain equilibrium investment, substitute for Y from part b.e. Holding M/P constant, I increases with equilibrium output when b1>b2d1/d2.Since a decrease in G reduces output, the condition under which a decrease in G increases investment is b1<b2d1/d2.f. The interpretation of the condition in part e is that the effect on I from Y has to be lessthan the effect from i after controlling for the endogenous response of i and Y, determined by the slope of the LM curve, d1/d2.5. a. Y=C+I+G=200+.25*(Y-200)+150+.25Y-1000i+250Y=1100-2000ib.M/P=1600=2Y-8000i i=Y/4000-1/5c. Substituting b into a: Y=1000d. Substituting c into b: i=1/20=5%e. C=400; I=350; G=250; C+I+G=1000f. Y=1040; i=3%; C=410; I=380. A monetary expansion reduces the interest rate andincreases output. The increase in output increases consumption. The increase in output and the fall in the interest rate increase investment.g. Y=1200; i=10%; C=450; I=350. A fiscal expansion increases output and the interestrate. The increase in output increases consumption.h. The condition from problem 3 is satisfied with equality (.25=1000*(2/8000)), socontractionary fiscal policy will have no effect on investment. When G=100: i=0%;Y=800; I=350; and C=350.*6. a. The LM curve is flatb. Japan was experiencing a liquidity trap. c. Fiscal policy is more effective.7. a. Increase G (or reduce T) and increase M.b. Reduce G (or increase T) and increase M. The interest rate falls. Investment increases,since the interest rate falls while output remains constant.CHAPTER 61.a.Fals.b.Fals.c.Falsd.False.Truf.Falsg.Uncertaih.True.i. False.2. a. (Monthly hires+monthly separations)/monthly employment =6/93.8=6.4%b. 1.6/6.5=25%c. 2.4/6.5=37%. Duration is 1/.37 or 2.7 months.d. 4.9/57.3=9%.e. new workers: .35/4.9=7%; retirees: .2/4.9=4%.3. a and b. Answers will depend on when the page is accessed.c. The decline in unemployment does not equal the increase in employment, because thelabor force is not constant. It has increased over the period.4. a. 66%; 66%*66%*66%= 29%; (66%)6= 8%b. (66%)6= 8%c. (for 1998): 875/6210= .145. a. Answers will vary.b and c. Most likely, the job you will have ten years later will pay a lot more thanyour reservation wage at the time (relative to your typical first job).d. The later job is more likely to require training and will probably be a much harderjob to monitor. So, as efficiency wage theory suggests, your employer will be willing to pay a lot more than your reservation wage for the later job, to ensure low turnover and low shirking.6. a. The computer network administrator has more bargaining power. She is muchharder to replace.6. b. The rate of unemployment is a key statistic. For example, when there are manyunemployed workers it becomes easier for firms to find replacements. This reduces the bargaining power of workers.7. a. W/P=1/(1+ )=1/1.05=.95 b. Price setting: u=1-W/P=5%c. W/P=1/1.1=.91; u=1-.91=9%. The increase in the markup lowers the real wage.From the wage-setting equation, the unemployment rate must rise for the real wage to fall.So the natural rate increases.CHAPTER 71.a.Trub.Trc.Falsd.Fale.Truf.Falg.Fal2. a. IS right, AD right, AS up, LM up, Y same, i up, P upb. IS left, AD left, AS down, LM down, Y same, i down, P down3. a.WS PS AS AD LM IS Y i PShort run:up same up same up same down up upMedium run:up same up same up same down up upb.WS PS AS AD LM IS Y i PShort run:same up down same down same up down downMedium run:same up down same down same up down down4. a. After an increase in the level of the money supply, output and the interest-rate eventually return to the same level. However, monetary policy is useful, because it can accelerate the return to the natural level of output.b. In the medium run, investment and the interest rate both change with fiscal policy.c. False. Labor market policies, such as unemployment insurance, can affect the naturallevel of output.*5. a. Open answer. Firms may be so pessimistic about sales that they do not want to borrow at any interest rate.b. The IS curve is vertical; the interest rate does not affect equilibrium output.c. No change.d. The AD curve is vertical; the price level does not affect equilibrium output.e. The increase in z reduces the natural level of output and shifts the AS curve up. SincetheAD curve is vertical, output does not change, but prices increase. Note that output is above its natural level.f. The AS curve shifts up forever, and prices keep increasing forever. Output does notchange, and remains above its natural level forever.6. a. The natural level of output is Y n. Assuming that output starts at is naturallevel, P0= M0- (1/c)*Y nb. Assuming that P e=P0: Y = 2cM0-cP=2cM0-cP0-cdY+cdY nRecalling that Y n=c(M0-P0): Y= Y n+ (c/(1+c d))*M0c. Investment goes up because output is higher and the interest rate is lower.d. In the medium run, Y = Y ne. In the medium run, investment returns to its previous level, because output and the interestrate return to their previous levels.CHAPTER 81.a.Trb.Fac.Fad.Tre.Faf.Tr2. a. No. In the 1970s, we experienced high inflation and high unemployment. The expectations- augmented Phillips curve is a relationship between inflation and unemployment conditional on the natural rate and inflation expectations. Given inflation expectations,increases in the natural rate (which result from adverse shocks to labor market institutions—increases in z—or from increases in the markup—which encompass oil shocks) lead to an increase in both theunemployment rate and the inflation rate. In addition, increases in inflation expectations imply higher inflation for any level of unemployment and tend to increase the unemployment rate inthe short run (think of an increase in the expected price level, given last period’s price,in the AD-AS framework). In the 1970s, both the natural rate and expected inflation increased, so both unemployment and inflation were relatively high.b. No. The expectations-augmented Phillips curve implies that maintaining a rate ofunemployment below the natural rate requires increasing (not simply high) inflation. This is because inflation expectations continue to adjust to actual inflation.3. a. u n=0.1/2 =5%b. t=0.1-2*.03 = 4% every year beginning with year t.c. e= 0 and =4% forever. Inflation expectations will be forever wrong. This isunlikely.t td. ⎝ might increase because pe ople’s inflation expectations adapt to persistently positiveinflation. The increase in ⎝ has no effect on u n.e. 5= 4+.1-.06=4%+4%=8%For t>5, repeated substitution implies, t= 5+(t-5)*4%.So, 10=28%; 15=48%.f. Inflation expectations will again be forever wrong. This is unlikely.4. a. t= t-1+ 0.1 - 2u t= t-1+ 2%t=2%; t+1=4%; t+2=6%; t+3=8%.b. t=0.5 t+ 0.5 t-1+ 0.1 - 2u tor, t= t-1+ 4%4. c. t=4%; t+1=8%; t+2=12%; t+3=16%d. As indexation increases, low unemployment leads to a larger increase in inflation overtime.5. a. A higher cost of production means a higher markup.b. u n=(0.08+0.1⎧)/2; Thus, the natural rate of unemployment increases from 5% to 6% as⎧increases from 20% to 40%.6. a. Yes. The average rate of unemployment is down. In addition, the unemploymentrate is at a historical low and inflation has not risen.b. The natural rate of unemployment has probably decreased.7. An equation that seems to fit well is: t- t-1=6-u t, which implies a natural rate of approximately 6%.8. The relationships imply a lower natural rate in the more recent period. CHAPTER 91. F TT F FT TT2. a. The unemployment rate will increase by 1% per year when g=0.5%. Unemploymentwill increase unless the growth rate exceeds the sum of productivity growth and labor force growth.b. We need growth of 4.25% per year for each of the next four years.c. Okun’s law is likely to beco me: u t-u t-1=-0.4*(g yt-5%)3. a. u n= 5%b. g yt= 3%; g mt=g yt+ t= 11%c. u g yt g mtt-1:8%5%3%11%t:4%9%-7%-3%t+1:4%5%13%17%t+2:4%5%3%7%4. a. t- t-1= -(u t-.05)u t- u t-1= -.4*(g mt- t-.03)b. t=6.3%; u t=8.7%t+1=1%; u t+1=10.3%c. u=5%; g y=3%; =-3%;5. a. See text for full answer. Gradualism reduces need for large policy swings, with effectsthat are difficult to predict, but immediate reduction may be more credible and encourage rapid, favorable changes in inflation expectations. On the other hand, the staggering ofwagedecisions suggests that, if the policy is credible, a gradual disinflation is the optionconsistent with no change in the unemployment rate.b. Not clear, probably fast disinflation, depending on the features inc.5. c. Some important features: the degree of indexation, the nature of the wage-settingprocess, and the initial rate of inflation.*6. a. u n=K/2; sacrifice ratio=.5 b. t=10%; t+1=8%; t+2=6%; t+3=4%; t+4=2%c. 5 years; sacrifice ratio=(5 point years of excess unemployment)/(10 percentage pointreduction in inflation)=.5d. t=7.5%; t+1=4.125%; t+2=1.594%; 3 years of higher unemployment for a reduction of10%: sacrifice ratio=0.3 e. t+1f. Take measures to enhance credibility.7. a. Inflation will start increasing.b.It should let unemployment increase to its new, higher, natural rate.Chapter 101. TTTFFFTU2. a. Example: France: (1.042)48*5.150=$37.1 k.Germany: $43.4 k; Japan: $76.5 k; UK: $22.5 k; U.S.:$31.7k b. 2.4c. yes.3. a. $5,000b. 2,500 pesos c. $500d. $1,000e. Mexican standard of living relative to the U.S.—exchange rate method:1/10; PPP method: 1/54. a. Y=63b. Y doubles. c. Yes.d. Y/N=(K/N)1/2e. K/N=4 implies Y/N=2. K/N=8 implies Y/N=2.83. Output less than doubles.f. No.g. No. In part f, we are looking at what happens to output when we increasecapital only, not capital and labor in equal proportion. There are decreasing returns tocapital.h. Yes.5. The United States was making the most important technical advances. However, theother countries were able to make up much of their technological gap by importing thetechnologies developed in the United States, and hence, have higher technological progress.6.Convergence for the France, Belgium, and Italy; no convergence for the second set ofcountriesChapter 111. a. Uncertain. True if saving includes public and private saving. False if saving onlyincludes private saving.b. False.c.Uncert UTFFd2. a. No. (1) The Japanese rate of growth is not so high anymore. (2) If the Japanesesaving rate has always been high, then this cannot explain the difference between the rate of growth inJapan and the US in the last 40 or 50 years. (3) If the Japanese saving rate has been higher thanit used to be, then this can explain some of the high Japanese growth. The contribution of high saving to growth in Japan should, however, come to an end.3. After a decade: higher growth rate. After five decades: growth rate back to normal, higher level of output per worker.4. a. Higher saving. Higher output per workerb. Same output per worker. Higher output per capita.5.*YYYd. Y/N = (K/N)1/3e. In steady state, sf(K/N) = ™K/N, which, given the production function in part d,implies: K/N=(s/™)3/2f. Y/N =(s/™)1/2g. Y/N = 2h. Y/N = 21/26.* a. 1b. 1c. K/N=.35; Y/N=.71d. Using equation (11.3), the evolution of K/N is: 0.9, 0.82, 0.757. a. K/N=(s/(2™))2; Y/N=s/(4™) b. C/N=s(1-s)/(4™)c-e. Y/N increases with s; C/N increases until s=.5, then decreases. CHAPTER 121.TFTFTFTUF2. a. Lower growth in poorer countries. Higher growth in rich countries.b. Increase in R&D and in output growth.c. A decrease in the fertility of applied research; a (small) decrease in growth.d. A decrease in the appropriability of drug research. A drop in the development of newdrugs. Lower technological progress and lower growth.3. See discussion in section 12.2.4. Examples will vary. Weakening patent protection would accelerate diffusion, but mightalso discourage R&D.5. a. Year 1: 3000; Year 2: 3960b. Real GDP: 3300; output growth: 10%c. 20%d. Real GDP/Worker=30 in both years; productivity growth is zero.e. RealGDP:3990;outputgrowth:33%.f. -0.8%g. Proper measurement implies real gdp/worker=36.3 in year 2. With improper measurement, productivity growth would be 21 percentage points lower and inflation 21% points higher.6. a. Both lead to an initial decrease in growthb. Only the first leads to a permanent decrease in growth7. a. (K/(AN))*=(s/(™+g A+g N))2=1; (Y/(AN))*=(1)1/2; g Y/(AN)=0; g Y/N=4%; g Y=6%b. (K/(AN))=(4/5)2; (Y/(AN))*=(4/5); g Y/(AN)=0; g Y/N=8%; g Y=10%c. (K/(AN))=(4/5)2; (Y/(AN))*=(4/5); g Y/(AN)=0; g Y/N=4%; g Y=10%People are better off in case a. Given any set of initial values, the level of technology is the same in cases a and c, but the level of capital per effective worker is higher atevery point in time in case a. Thus, since Y/N=A*(Y/(AN))=A*(K/(AN))1/2, output per worker is always higher in case a.8. There is a slowdown in growth and the rate of technological progress in the modernperiod. Japan’s growth rate of technological progress is higher because it is catching upto the U.S. level of technology. Not all of the difference in growth rates of output per worker is attributable to the difference in rates of technological progress. A big part is attributable to the difference in rates of growth of capital per worker.9.* a. ProbablyaffectsA.Thinkofclimate.b.Affects H.c. Affects A. Strong protection tends to encourage more R&D but also to limit diffusion of technology.d. May affect A through diffusion.e. May affect K, H, and A. Lower tax rates increase the after-tax return on investment,and thus tend to lead to more accumulation of K and H and more R&D spending.f. If we interpret K as private capital, than infrastructure affects A—e.g., bettertransportation networks may make the economy more productive by reducing congestion time.g. Assuming no technological progress, lower population growth implies highersteady-state level of output per worker. Lower population growth leads to higher capital per worker. Ifthere is technological progress, there is no steady-state level of output per worker. In this case, however, lower population growth implies that output per worker will be higher at every point in time, for any given path of technology. See the answer to problem 7c.Chapter 131.FFTTTTTTF2. a. u=1-(1/(1+⎧))(A/A e)b. u=1-(1/(1+⎧))=4.8%c. No. Since wages adjust to expected productivity, an increase in productivityeventuallyleads to equiproportional increases in the real wage implied by wage setting and price setting, at the original natural rate of unemployment. So equilibrium can bemaintained without any change in the natural rate of unemployment.3.* a. P=P e(1+⎧)(A e/A)(Y/L)(1/A)b. AS shifts down. Given A e/A=1, an increase in A implies a fall in P, given Y. Thisoccurs because for a given level of Y, unemployment is higher, so wages are lower and so, in turn, is the price level.c. There is now an additional effect, a fall in A e/A. In effect, workers do not receive asmuchof an increase in wages as warranted by the increase in productivity. Compared to part b, nominal wages are lower, leading to a lower value of P given Y.4. Discussion question.5. a. Reduce the gap, if this leads to an increase in the relative supply of skilled workers.b. Reduce the gap, since it leads to a decrease in the relative supply of unskilled workers.c. Reduce the gap, since it leads to an increase in the relative supply of skilled workers.d. Increase the gap, if U.S. firms hire unskilled workers in Central America, since itreduces the relative demand for U.S. unskilled workers.6. a. Textiles production is moving to low wage countries.b. Possibly demographic changes, increased availability of child care outside the home,decline in labor supply for these positions.c. Technological progress.7. Discussion question.CHAPTER 14。
第10章增长的事实一、概念题1.增长(growth)答:增长,是经济增长的简称,是指一个国家(地区)物品和劳务生产总量的增加。
通常以国内生产总值或人均国内生产总值的增加来衡量。
如果考虑到人口的增加和价格变动的情况,衡量经济增长的较好标准是实际人均国内生产总值的增加。
在物价上升的特定年份中,以当时价格计算的国内生产总值中有相当大的部分是由价格上升造成的,必须消除掉通货膨胀因素的影响才能求得实际经济增长速度。
一国的经济增长水平取决于其生产的能力或潜力。
生产能力的决定因素有资本(或称“物质资本”)、劳动(或称“人力资本”)、自然资源和技术进步。
其中技术进步和由此引起的生产率提高,对经济增长具有重要作用。
此外,政治、社会、文化、管理、制度、国际环境等方面的因素,也对经济增长有重要影响。
经济增长与经济发展是两个不同的概念。
经济发展既包括社会物质生产的发展,也包括人们物质生活福利的改善,还包括环境质量的提高。
在这层含义上,经济发展包括经济增长,还包括经济结构和收入分配的变革。
一般来说,经济发展以经济增长为必要条件,没有经济增长不可能有经济发展。
但是有经济增长不一定有经济发展。
所以,经济发展必须是大多数人参与和分享收入及福利增加的经济增长。
2.对数坐标(logarithmic scale)答:对数坐标,是与线性坐标相对的概念,指纵轴坐标是取相应变量的对数值的坐标系统。
相比于线性坐标,对数坐标的优点是如果使用对数坐标来画出随时间增长的变量图形,通过考察斜率,可以容易地看到增长率发生的变化。
原因如下:假定一个变量随时间增长的增长率是常数(如每年3%),那么,变量越大,从一年到下一年增量就越大。
如果使用线性纵轴坐标来画出图形,增量将会随时间越变越大。
使用对数坐标,相同比例的增加由坐标轴上相同的垂直距离表示。
也就是说,当使用线性坐标时,以不变速度增长的变量行为就被表示为一条变得越来越陡峭的曲线;但使用对数坐标时,就被表示成了一条直线,而且直线的斜率等于增长率,比如说如果变量每年增长3%,直线的斜率就是0.03。
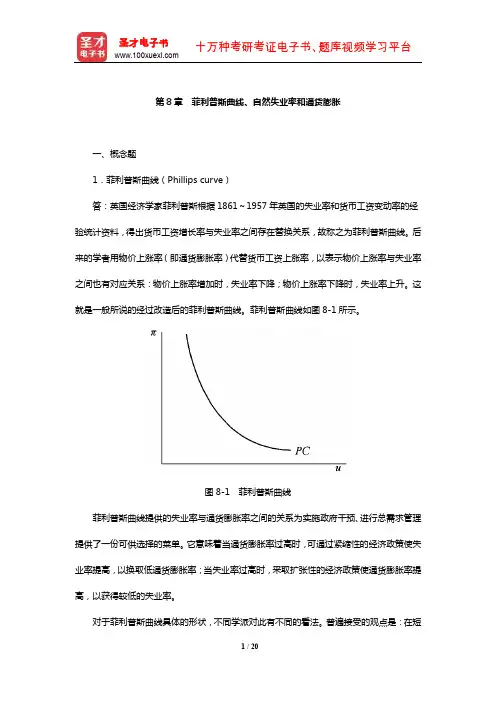
第8章菲利普斯曲线、自然失业率和通货膨胀一、概念题1.菲利普斯曲线(Phillips curve)答:英国经济学家菲利普斯根据1861~1957年英国的失业率和货币工资变动率的经验统计资料,得出货币工资增长率与失业率之间存在替换关系,故称之为菲利普斯曲线。
后来的学者用物价上涨率(即通货膨胀率)代替货币工资上涨率,以表示物价上涨率与失业率之间也有对应关系:物价上涨率增加时,失业率下降;物价上涨率下降时,失业率上升。
这就是一般所说的经过改造后的菲利普斯曲线。
菲利普斯曲线如图8-1所示。
图8-1 菲利普斯曲线菲利普斯曲线提供的失业率与通货膨胀率之间的关系为实施政府干预、进行总需求管理提供了一份可供选择的菜单。
它意味着当通货膨胀率过高时,可通过紧缩性的经济政策使失业率提高,以换取低通货膨胀率;当失业率过高时,采取扩张性的经济政策使通货膨胀率提高,以获得较低的失业率。
对于菲利普斯曲线具体的形状,不同学派对此有不同的看法。
普遍接受的观点是:在短期内,菲利普斯曲线向右下方倾斜,而长期菲利普斯曲线是一条垂直线,表明在长期失业率与通货膨胀率之间不存在替换关系。
2.工资-价格螺旋(wage-price spiral)答:工资—价格螺旋又称为“工资—物价螺旋式上升”,是一种关于工资与物价相互促进而引起持续通货膨胀的理论。
给定预期价格,工人认为就是去年的价格,更低的失业导致更高的名义工资,更高的名义工资导致更高的价格,更高的价格导致更高的通货膨胀。
这一机制被称为工资—价格螺旋。
其作用机制为:(1)低失业引起更高的名义工资。
(2)作为对更高工资的反应,企业提高它们的价格,价格就升高了。
(3)作为对更高价格的反应,工人要求更高的名义工资。
(4)更高的名义工资致使企业进一步提高价格,最终价格进一步提升。
(5)作为对价格进一步提升的反应,在他们再次制定工资的时候,工人进一步要求更高的名义工资。
价格和工资之间的这种竞赛,导致持续的工资和价格膨胀。
第24章政策制定者是否应当受到限制一、概念题1.微调(fine-tuning)答:微调是指政府在宏观调控中,针对经济运行中的小冲击、小波动而相机地作出轻微的政策调整以保持产出和失业恒定的政策行为。
微调是针对经济运行中所发生的较小波动,为防止较大波动的出现而在宏观调控政策及其目标变量上不断地加以小幅度相机调整的政策操作。
通过宏观经济的微调,一方面增强了经济的稳定性,另一方面也起到对经济危机防微杜渐的作用。
由于经济中经常发生的是较小的波动,如果对这些较小的波动不及时采取措施加以调整,就会酿成不稳定因素,因此需要经常地、及时地用小的政策变动来消除经济中的小波动。
微调中应注意政策的时间一致性,前后出台的政策要求做到逻辑一致,不存在内在矛盾。
微调可以是财政政策,也可以是货币政策。
在进行微调时要尽量缩短政策时滞,以便更好地稳定经济。
凯恩斯主义认为,微调政策无论在长期还是在短期中对稳定经济都有积极作用;货币主义者认为,微调政策在短期内有用,但因政策本身的多变和不稳定性,在长期中不仅无用,反而会破坏市场经济本身的稳定机制。
在现实的政策操作中,诸多大型的宏观计量模型对于未来经济前景的预测有时大相径庭,因此如何精确地把握微调的力度和方向是进行微调所面临的重大课题。
2.最优控制(optimal control)答:从广义上讲,最优控制是现代控制理论的一个组成部分。
其基本内容和常用方法是动态规划、最大值原理和变分法;其主要工具是庞特里亚金极大值原理和贝尔曼动态规划。
最优控制的主要研究内容是:在被控对象数学模型已知且满足一定的约束条件下,寻求一个最优控制规律(或最优控制函数),使系统从某一个初始状态到达最终状态,并使性能指标(泛函)为极大或极小,即使控制系统的性能在某种意义下是最优的。
从狭义上讲,最优控制是指经济学中用于设计宏观经济政策的一种最佳控制方法。
这种方法最初是为控制和引导火箭而开发的,后来逐渐被用于设计宏观经济政策。
第2章本书之旅一、概念题1.国民收入和生产账户(national income and product accounts)答:国民收入和生产账户,简称国民收入账户,是指对一国一定时期(通常为一年)内国民收入进行系统记录的账户。
国民收入指一个国家在一定时期(通常为一年)内物质资料生产部门的劳动者新创造的价值的总和,即社会总产品的价值扣除用于补偿消耗掉的生产资料价值的余额。
反映国民收入的两个主要统计数字是GDP和GNP,前者计算一段特定时期本地进行的生产,而后者则计算本地居民的总体收入。
衡量国民收入的方法有三种:收入法、支出法和产出(产品)法。
常用的两个核算公式为:①国内生产总值=消费(C)+私人投资(I)+政府支出(G)+净出口(X-IM);②国内生产总值=工资或其他劳动收入+利息、租金及其他财产收入+间接税+折旧+利润。
其经济意义为:①国民收入的生产结构和经济成分结构指标综合地反映出一国的国民经济结构;②国民收入指标综合地反映社会再生产中各种错综复杂的经济关系;③反映了国民收入的生产、分配和使用中的各种比例关系;④国民收入是反映宏观经济效益的综合指标。
2.总产出(aggregate output)答:总产出是指一个国家或地区一定时期内(核算期内)全部生产活动的总成果,即全部生产单位生产的物质产品和服务的总价值之和,包括本期生产的已出售和可供出售的物质产品和服务、在建工程以及自产自用消费品和自制固定资产价值。
一般按生产价格计算。
经济总产出的主要衡量指标有国内生产总值(GDP)、国民生产总值(GNP)等。
3.国内生产总值(gross domestic product,GDP)答:国内生产总值是指一个国家(地区)的领土范围内,本国(地区)居民和外国居民在一定时期内所生产和提供的最终使用的产品和劳务的价值总和。
国内生产总值之所以称为总值,是因为它包含了生产中的固定资产消耗(固定资产折旧)。
其一般通过支出法、增值法和收入法三种方法进行核算。
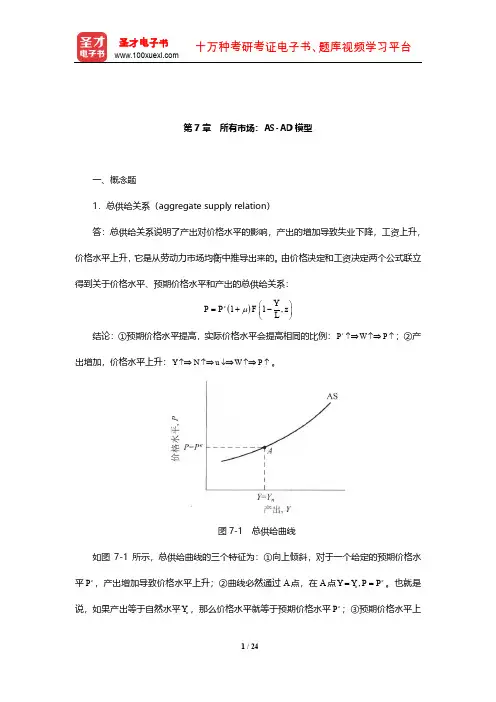
第7章 所有市场:AS-AD 模型一、概念题1.总供给关系(aggregate supply relation )答:总供给关系说明了产出对价格水平的影响,产出的增加导致失业下降,工资上升,价格水平上升,它是从劳动力市场均衡中推导出来的。
由价格决定和工资决定两个公式联立得到关于价格水平、预期价格水平和产出的总供给关系:()11,e Y P P F z L μ⎛⎫=+- ⎪⎝⎭ 结论:①预期价格水平提高,实际价格水平会提高相同的比例:e P W P ↑⇒↑⇒↑;②产出增加,价格水平上升:Y N u W P ↑⇒↑⇒↓⇒↑⇒↑。
图7-1 总供给曲线如图7-1所示,总供给曲线的三个特征为:①向上倾斜,对于一个给定的预期价格水平e P ,产出增加导致价格水平上升;②曲线必然通过A 点,在A 点,e n Y Y P P ==。
也就是说,如果产出等于自然水平n Y ,那么价格水平就等于预期价格水平e P ;③预期价格水平上升使得总供给曲线向上移动,相反,预期价格水平下降使得总供给曲线向下移动。
2.总需求关系(aggregate demand relation )答:总需求关系说明了价格水平对产出的影响,价格水平的上升减少了实际货币存量,提高了利率,减少了产出。
它是从物品和金融市场均衡推导而来。
(物品市场)IS :()(),Y C Y T I Y i G =-++;(金融市场)LM :()M YL i P=; 总需求曲线的表达式:,,M Y Y G T P -++⎛⎫ ⎪= ⎪⎝⎭产出是实际货币存量的增函数,政府支出的增函数和税收的减函数,其推导过程如图7-2所示。
图7-2(a )画出了IS 和LM 曲线,最初的均衡点为A 点。
当价格水平从P 上升到'P 时,LM 曲线向上移动。
均衡从A 点移动到'A 点,利率从i 上升到'i ,产出从Y 下降到'Y 。
价格水平上升导致产出下降。
第25章后记:宏观经济学的故事说明:本章只有概念题,没有计算与分析题。
1.经济周期理论(business cycle theory)答:经济周期理论是指研究经济周期的成因及其治理对策的理论。
在西方,对经济周期的成因及其治理对策的研究,始于19世纪初,形成了许多不同的理论、学派、模型或方法。
大致可以按四个时期归纳出具有代表性的、在学术界有影响的30种流派:(1)供求自然均衡论、早期消费不足论,这两个流派属经济周期研究的第一个时期,即19世纪初至60年代末。
这时正值西方主要资本主义国家工业化初期,也是资本主义社会经济周期波动的初期,因此对经济周期的研究尚处于早期阶段。
(2)太阳黑子周期理论,或称“农业收成周期理论”、纯货币周期理论、货币投资过度论,或称“生产结构纵向失调论”、“资本不足论”、“储蓄不足论”、非货币投资过度论,或称“固定资本重置周期理论”、消费品需求引致投资过度论、熊彼特周期理论,或称“创新周期理论”、生产结构横向失调论、负债过度论、近代消费不足论(含“储蓄过度论”或“过度储蓄论”)、心理周期理论、米切尔-伯恩斯实证方法。
这11种理论属于第二阶段,即19世纪70年代至20世纪30年代上半期,此时正值西方主要资本主义国家工业化中期。
这一时期经济周期呈现出剧烈波动的特点。
这一时期的各种流派已经涉及到了形成经济周期的许多可能的因素。
(3)凯恩斯周期理论、线性乘数—加速数动态周期模型、非线性乘数—加速数动态增长周期模型、卡尔多非线性动态增长周期模型、哈罗德—多马动态增长周期模型、存货周期模型、菲利普斯曲线、奥肯定理、随机经济周期模型。
这9种理论属于第三阶段,即20世纪30年代下半期至60年代末。
这时西方主要资本主义国家处于工业化后期。
1929~1933年的大萧条,打破了资本主义市场经济本身可以自行调节、自行均衡、自行解决危机的梦想。
这一时期经济周期研究的主要特点是凯恩斯主义的崛起及其在宏观调控政策中的应用。
第1篇导论第1章世界之旅一、概念题1.欧洲联盟(欧盟)(European Union,EU)答:欧洲联盟(European Union),简称欧盟(EU),总部设在比利时首都布鲁塞尔,是由欧洲共同体(European Community,又称欧洲共同市场)发展而来的,它建立在经济与货币联盟、外交与安全政策、协调各国内政与司法事务三项内容的基础上。
欧盟是一个集政治实体和经济实体于一身、在世界上具有重要影响的区域一体化组织。
1991年12月,欧洲共同体马斯特里赫特首脑会议通过《欧洲联盟条约》,通称《马斯特里赫特条约》(简称《马约》)。
1993年11月1日,《马约》正式生效,欧盟正式诞生。
至今,欧盟现有成员国27个,分别是:英国、法国、德国、意大利、荷兰、比利时、卢森堡、丹麦、爱尔兰、希腊、葡萄牙、西班牙、奥地利、瑞典、芬兰、马耳他、塞浦路斯、波兰、匈牙利、捷克、斯洛伐克、斯洛文尼亚、爱沙尼亚、拉脱维亚、立陶宛、罗马尼亚、保加利亚等。
这27个国家一起形成了一股强大的经济力量。
这些国家的联合产出几乎等于美国的产出,其中许多国家的生活水平以人均衡量接近美国。
2.共同货币区(Common Currency Area)答:共同货币区是指使用同一种货币的所有国家和地区所构成的区域,如欧元区。
共同货币区,能够加强区域内成员之间的经济联系,消除贸易壁垒,促进要素的自由流动,从而推动共同货币区成员的经济发展。
但与此同时,共同货币区一般会设立统一的央行并实施统一的货币政策,从而使成员国丧失货币政策的独立性。
3.欧元区(Euro area)答:欧元区是指欧洲联盟成员中使用欧盟的统一货币——欧元的国家区域。
1999年1月1日,欧盟国家开始实行单一货币欧元和在实行欧元的国家实施统一货币政策。
欧元区共有19个成员,另有9个国家和地区采用欧元作为当地的单一货币。
但是作为美元的世界储备货币的竞争者,欧元的流通已经不限于上述地区。
二、计算与分析题1.运用本章学到的知识,判断以下陈述属于“正确”、“错误”和“不确定”中的哪一种情况,并简要解释。
布兰查德《宏观经济学》(第6版)笔记和课后习题详解完整版>精研学习䋞>无偿试用20%资料全国547所院校视频及题库全收集考研全套>视频资料>课后答案>往年真题>职称考试第1篇导论第1章世界之旅1.1复习笔记1.2课后习题详解第2章本书之旅2.1复习笔记2.2课后习题详解第2篇核心部分第3章商品市场3.1复习笔记3.2课后习题详解第4章金融市场4.1复习笔记4.2课后习题详解第5章商品市场和金融市场:IS-LM模型5.1复习笔记5.2课后习题详解第6章劳动力市场6.1复习笔记6.2课后习题详解第7章所有市场集中:AS-AD模型7.1复习笔记7.2课后习题详解第8章菲利普斯曲线、自然失业率和通货膨胀8.1复习笔记8.2课后习题详解第9章美国次贷危机9.1复习笔记9.2课后习题详解第10章增长的事实10.1复习笔记10.2课后习题详解第11章储蓄、资本积累和产出11.1复习笔记11.2课后习题详解第12章技术进步与增长12.1复习笔记12.2课后习题详解第13章技术进步:短期、中期与长期13.1复习笔记13.2课后习题详解第3篇扩展部分第14章预期:基本工具14.1复习笔记14.2课后习题详解第15章金融市场和预期15.1复习笔记15.2课后习题详解第16章预期、消费和投资16.1复习笔记16.2课后习题详解第17章预期、产出和政策17.1复习笔记17.2课后习题详解第18章商品市场和金融市场的开放18.1复习笔记18.2课后习题详解第19章开放经济中的商品市场19.1复习笔记19.2课后习题详解第20章产出、利率和汇率20.1复习笔记20.2课后习题详解第21章汇率制度21.1复习笔记21.2课后习题详解第22章政策制定者是否应当受到限制?22.1复习笔记22.2课后习题详解第23章财政政策:一个总结23.1复习笔记23.2课后习题详解第24章货币政策:一个总结24.1复习笔记24.2课后习题详解第25章后记:宏观经济学的故事25.1复习笔记25.2课后习题详解。
第25章货币政策总结一、概念题1.皮鞋成本(shoe-leather costs)答:皮鞋成本是指中期内通胀率越高,名义利率越高,持有货币的机会成本越大,因而人们减少货币余额,更频繁地到银行存取款而造成的时间和其他损失。
如果通胀率很低,皮鞋成本很低,人们会更多地工作或有更多的闲暇时间;若发生恶性通胀,皮鞋成本则可能非常大;在通胀适中时,皮鞋成本也很小。
2.货币幻觉(money illusion)答:货币幻觉是人们在评估名义变化和实际变化时所犯的系统性错误。
在价格稳定的情况下,很多计算会非常简单;但是在有通胀的情况下,这些计算变得更复杂。
由于此时难以区分实际利率与名义利率,导致人们和企业做出不正确的决策,产生货币幻觉。
3.通胀目标(inflation targeting)答:通胀目标,即通货膨胀目标,是政府所采取的一种治理通货膨胀的政策,即由官方确定通货膨胀的目标、宣布通货膨胀率波动的范围,并明确表示货币政策的首要目标是实现较低而且稳定的通货膨胀。
世界上许多工业国都曾采用过强硬或灵活的通货膨胀目标政策。
通胀目标政策是一种建立中央银行可信度的政策选择,中央银行可以通过通胀目标自我约束以减少政策的时间不一致性问题,从而建立起中央银行的信誉。
具体地说,通胀目标硬化了中央银行的目标,因此有助于避免货币政策的主观随意性,有助于人们树立对物价稳定的信心。
但这一规则同时也使央行失去了政策操作的灵活性,在某些特殊情况下束缚了央行的手脚。
通胀目标具体作法是货币当局事先向社会公众宣布年度物价上涨目标,并通过观察包括货币供应量、失业率、股票指数在内的一系列指标来定期分析经济态势和物价走势,做出适当的货币政策操作,确保实际物价水平维持在公布的通货膨胀预期目标之内。
通货膨胀目标作为一种货币政策策略包含了五个基本因素:①公开宣布中期通货膨胀目标值;②在制度上承诺把物价稳定作为货币政策的首要目标,其他目标置于从属地位;③除了货币总量和汇率外,其他信息变量亦能决定政策工具的操作环境;④货币当局的计划、目标、决议对公众有更多的透明度;⑤中央银行对通货膨胀目标的达到有更多的责任。
第4章金融市场一、概念题1.联邦储备银行(联储)(Federal Reserve Bank,Fed)答:联邦储备银行是指属于美国联邦储备系统的,执行中央银行职能的区域性金融机构。
美国联邦储备银行,实际上包括十二家银行及其分布在全美各地的二十五家地区分行,通过运用公开市场业务、存款储备金率和再贴现率三大政策工具,调控美国的经济状况。
其目的是帮助消除通货膨胀和通货紧缩的影响,并积极参与创造环境,促进高就业率、稳定物价、促进国民经济增长和不断提高消费水平,推动资金在银行系统内安全高效地流转。
联邦储备银行对美国经济有着举足轻重的影响。
2.货币(money)答:货币一般是指在交换商品或清算债权债务时被广泛用作媒介的物品。
人们广泛接受货币这种物品并不是因为其本身的自然属性,而是因为它能够用来交换商品或清算债权债务。
在实际经济生活中,由于多种信用工具在不同程度上充当了货币的角色,因而如何准确界定货币的范围一直是困扰西方经济学者的难题。
西方学者界定货币遵循着两条思路:(1)先验法。
从货币的内涵着眼,以货币所具备的职能为基础界定货币范围。
理论上M表示:认为货币的主要职能是交换媒介或支付手段的人主张狭义的货币定义,用1银行体系外流通的货币银行体系内的活期存款1M=+理论上认为货币的主要职能是价值贮藏职能的人则主张广义的货币定义,用2M表示:商业银行的储蓄存款商业银行的定期存款。
=++21M M(2)实证法。
由于在理论上长期无法形成共识,许多人转而从实际政策或实验方法角度来认识货币定义。
著名经济学家凯恩斯就主张根据不同的政策用途拟定不同的货币定义。
这一主张为大多数金融当局所接受,各国实际上均从本国货币政策出发给出多种货币定义。
以弗里德曼为代表的另一派经济学家则主张以严格的经济计量学方法测定货币定义。
总之,M作为基本货币的观念已为广大经济学家所接受。
货币的定义在理论界尚未统一,但13.通货(currency)答:通货即是流通中的货币,在商品流通过程中充当一般等价交换物,包括纸币、铸币等有形实体货币和信用货币。
第21章汇率制度一、概念题1.金本位(gold standard)答:金本位是“国际金本位制”的简称,是指以黄金作为本位货币的一种货币制度。
金本位制包括“金币本位制”、“金块本位制”、“金汇兑本位制”,其中金币本位制是金本位制中较为典型的一种形式,因此通常金本位制就是金币本位制,即法律确定金铸币为本位币。
其主要特征在于:金币可以自由铸造;银行券可以自由兑换金币或黄金;黄金对外可以自由输入输出。
金本位制是一种相对稳定的货币制度,其相对稳定性表现为两方面:①国内流通中通货的币值对金币不发生贬值的现象;②在国外则是外汇行市的相对稳定。
1816年英国最早实行金本位制,其后西方其他国家也相继采用这一货币制度。
金本位制促进了各国商品生产与流通的快速发展,也促进了国际贸易与信用业的发展。
第一次世界大战后,金本位制的稳定性因素遭到破坏。
其原因在于:①金币自由铸造与自由流通的基础已受到削弱;②银行券自由兑换黄金的可能性也已受削弱;③黄金在国际上自由输出输入受到限制。
这就导致许多国家先后放弃了作为典型金本位制的金币本位制。
在1924~1928年的战后相对稳定时期内,英国、法国、比利时、荷兰等经济实力较强的国家开始转而实行金块本位制,德国、意大利、奥地利等国则和一些殖民地、半殖民地国家改行金汇兑本位制。
直至1929~1933年世界性经济危机期间和以后,西方各国相继放弃各种金本位制,开始实施不兑现的信用货币制度。
2.最优货币区域(optimal currency area)答:最优货币区又称“最佳货币区”,指各有关国家通过实现国际贸易和生产要素流动的一体化而组成的最适合于相互间实行固定汇率的地区。
每一个实现了经济一体化的地区都可以成为一个最优货币区。
比如欧洲联盟各国经济一体化程度较高,适合于组成一个最优货币区。
最优货币区理论是有关固定汇率最适合于那些通过国际贸易和生产要素流动而实现一体化的地区的理论。
该理论由诺贝尔经济学奖获得者、美国经济学家蒙代尔于20世纪60年代初提出。
该理论可以分析一国加入固定汇率区之后的所得与所失。
得与失主要取决于该国经济与区域内贸易伙伴的一体化程度。
从“得”的方面来说,一国加入固定汇率区的货币效率收益为:①加入国可避免由汇率浮动而带来的不确定性、复杂性,以及国际结算成本等损失。
一国与固定汇率区成员之间的贸易量越大,这种收益就越高。
同时,该国与固定汇率区成员之间在生产要素方面的自由流动性越大,其新获得的货币效率收益也越高。
②该国对固定汇率区成员进行投资(跨国资本流动)时,可以增加其投资回报的可预测性。
③该国居民到固定汇率区成员处工作(跨国劳动力流动)时,所获工资收入也更加稳定。
从“失”的方面来说,在固定汇率制下,一国的货币政策不能影响本国的产出。
当本国处于经济衰退时,就难以运用货币政策来稳定经济。
由固定汇率所引起的这种不稳定性,称为“经济稳定性损失”。
区域的一体化程度越高,通过增加区域内的贸易以及国内资本和劳动力向成员的流动来克服本国经济衰退的效果就越好,由此经济稳定性损失就越小。
区域经济一体化程度越高,一国加入固定汇率区的货币效率收益超过经济稳定性损失的部分就越大。
最优货币区理论为说明欧洲货币一体化和欧元的诞生,提供了一种分析框架。
蒙代尔的最优货币区理论的合理性和预见性已被欧元区建立的实践所证明。
蒙代尔因此而被称为“欧元之父”。
3.欧元(Euro)答:欧元,是指欧洲联盟的统一货币,于1999年1月1日在欧盟的12个成员国中正式启用。
欧元由纸币和硬币组成。
根据《马斯特里赫特条约》(简称《马约》)的规定,欧盟成员国正式启用欧元必须达到四个趋同标准:①物价稳定趋同标准。
这是《马约》规定的最主要的经济趋同标准。
具体内容是:成员国的通货膨胀率不得高于欧盟内三个物价最平稳的成员国的平均通货膨胀率再加上1.5个百分点的水平。
②政府预算趋同标准。
此标准要求成员国具有稳健的政府财政。
具体指标是:成员国的政府预算赤字不能超过当年GDP的3%,公债余额不能超过GDP的60%。
③汇率趋同标准。
《马约》规定所有成员国都要加入欧洲货币体系中的汇率机制,并且汇率在最近两年内没有出现持续性的贬值。
④长期利率趋同标准。
具体要求是:成员国的长期利率不能超过欧盟内三个物价最平稳的成员国的平均利率再加上2个百分点的水平。
按照这四个标准审查,欧盟15个成员国有12个国家达到了要求:德国、法国、比利时、西班牙、爱尔兰、意大利、卢森堡、荷兰、奥地利、希腊、葡萄牙和芬兰。
因此,这12个国家于1999年1月1日率先正式启用欧元。
根据《马约》的安排,1999年1月1日到2002年1月1日是欧元的转换期。
1999年1月1日,欧元成为流通货币,欧洲货币单位废止。
从这一天开始,欧元和各成员国货币之间的兑换率不可更改地固定下来,欧元以1:1的比价代替欧洲货币单位。
2002年1月1日起,欧元纸币和硬币正式在欧元区流通。
同年3月1日,各成员国的纸币和硬币彻底退出市场,以后,无论是大额的交易还是零星的小额商品支付,欧元是惟一的价值尺度、流通手段和支付手段。
4.马斯特里赫特条约(Maastricht Treaty)答:《马斯特里赫特条约》简称《马约》,于1991年12月9日至10日在荷兰的马斯特里赫特举行的首脑会议上签订。
当时通过并草签了《欧洲经济与货币联盟条约》和《政治联盟条约》,这两项条约又合称为《欧洲联盟条约》。
其中《货币联盟条约》在1992年2月7日由欧共体12国外长和财政部长正式签订。
《马约》于1993年正式生效,标志着欧洲共同体成为欧盟。
《马约》的主要内容是为建立欧洲经济与货币联盟确定了时间表和步骤。
《马约》规定:1990年7月1日至1993年12月31日为第一阶段,要求各成员国取消外汇管制,实现资本的自由流动,加强财政、货币、金融政策的协调一致;第二阶段从1994年1月1日开始,主要是建立欧洲中央银行的雏形——欧洲货币局;第三阶段最早于1997年1月开始,最晚于1999年1月1日开始,逐步建立一种“真正”的单一货币和独立的欧洲中央银行。
为了建立统一的货币体系,《马约》规定了经济趋同条款,主要内容是:①各国财政赤字占其国内生产总值的比率在3%以下;②各国政府债务总额占其国内生产总值的比率低于60%;③各国消费价格上涨率不得超出欧共体三个最低国的平均上涨率1.5个百分点;④各国长期利率不得超出三个物价最平稳的成员国的平均利率2个百分点;⑤各国货币在过去两年内处于欧洲外汇汇率机制的正常变动范围内。
此外,《马约》还就共同外交与安全政策、社会政策等方面提出了新的目标,为建立欧洲联盟奠定了基础。
1999年1月1日欧元正式启动,表明《马约》已经得到基本的贯彻执行。
5.欧洲中央银行(European Central Bank,ECB)答:欧洲中央银行是指欧洲联盟的中央银行,其前身为欧洲货币局。
该货币局于1994年1月在德国法兰克福成立,是未来欧洲中央银行的货币政策运作设计框架。
1998年6月1日,欧盟理事会正式任命欧洲中央银行行长、副行长以及执行董事会的其他四位成员,标志欧洲中央银行正式成立。
其总部仍设在法兰克福。
欧洲中央银行与欧盟成员国的中央银行共同组成“欧洲中央银行体系”。
1992年,《马斯特里赫特条约》对欧洲中央银行体系的决策机构的设置做出明确规定。
欧洲中央银行行长理事会和执行董事会是其主要决策机构。
行长理事会负责制定欧元区的货币政策和实施货币政策的指导纲要,确定欧元区的货币政策目标、主要利率水平和中央银行体系准备金数量等。
行长理事会由执行董事会成员和欧元区成员国中央银行行长组成,欧洲中央银行行长担任行长理事会主席。
执行董事会主要负责货币政策的实施,由欧洲中央银行行长和其他五位成员组成,任期八年。
欧洲中央银行体系的两个主要原则是:保持价格稳定和维护欧洲中央银行的独立性。
6.硬钉住汇率制度(hard peg)答:硬钉住汇率制度属于固定汇率制度的范畴,是指一国货币与被钉住国的货币实行严格的比价关系,并且货币当局会采取各种手段维护这种制度。
其极端形式就是美元化,还有一种形式就是货币局制度。
7.美元化(dollarization)答:美元化是指某些国家放弃本国货币而采用美元作为主要流通货币的行为。
美元化包括三层涵义:事实美元化、过程美元化和政策美元化。
事实美元化是指作为一种事实,美元在世界各地已经扮演了重要角色;过程美元化是指作为一种过程,美元在美国境外的货币金融活动中无论是深度还是广度,都将发挥越来越重要的作用;政策美元化是指作为一种政策,一国或经济体的政府让美元取代自己的货币并最终自动放弃货币或金融主权的行为。
8.货币局制度(currency board)答:货币局制度是一种汇率机制,它有两项基本原则:一是本国货币钉住一种强势货币,与之建立货币联系,此货币成为锚货币;二是本国通货发行以外汇储备——特别是锚货币的外汇储备为发行保证,保证本国货币与外币随时可按固定汇率兑汇。
货币局制度是一种特殊的固定汇率制。
通常要求在货币发行时必须以一定的(通常是100%)外国货币作为准备金,并且要求在货币流通中始终满足这一准备金的要求。
这一制度中的货币当局被称为货币局。
二、计算与分析题1.用本章学到的知识,判断下面的描述是正确、错误,还是不确定,并解释。
a.英国恢复到金本位引发了很多年的高失业。
b.在一个实行固定汇率的国家中,如果投资者突然希望会有一次大的贬值,那么他们将真的面临一场经济危机。
c.既然经济在中期倾向于回归到自然产出水平,所以没有理由贬值。
d.在欧洲,劳动力的高流动性使得使用共同货币成为欧元区很好的选择。
e.在很远的将来,汇率预期的变化对当前汇率水平的影响非常小。
答:a.正确。
英国恢复到金本位制使得英国货币估价大大提高,从而引发了英国经济的衰退,造成了多年的高失业率。
b.正确。
因为汇率贬值预期使既定利率下利率平价条件失衡,引起资本外流,央行损。