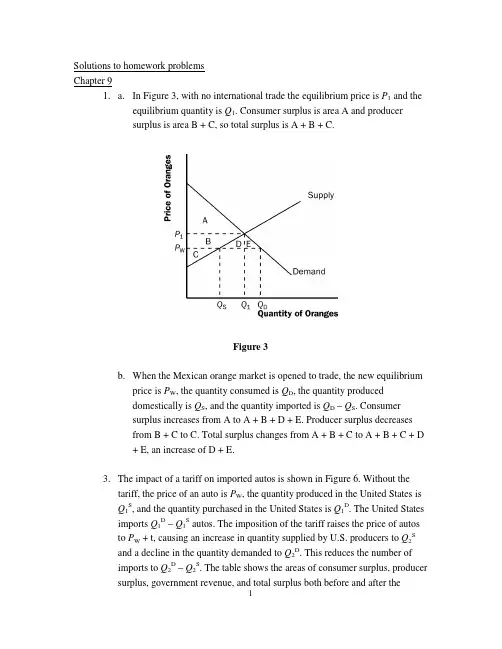
Solutions to homework problemsChapter 91. a. In Figure 3, with no international trade the equilibrium price is P1 and theequilibrium quantity is Q1. Consumer surplus is area A and producersurplus is area B + C, so total surplus is A + B + C.Figure 3b. When the Mexican orange market is opened to trade, the new equilibriumprice is P W, the quantity consumed is Q D, the quantity produceddomestically is Q S, and the quantity imported is Q D – Q S. Consumersurplus increases from A to A + B + D + E. Producer surplus decreasesfrom B + C to C. Total surplus changes from A + B + C to A + B + C + D+ E, an increase of D + E.3. The impact of a tariff on imported autos is shown in Figure 6. Without thetariff, the price of an auto is P W, the quantity produced in the United States isQ1S, and the quantity purchased in the United States is Q1D. The United Statesimports Q1D – Q1S autos. The imposition of the tariff raises the price of autosto P W + t, causing an increase in quantity supplied by U.S. producers to Q2Sand a decline in the quantity demanded to Q2D. This reduces the number ofimports to Q2D – Q2S. The table shows the areas of consumer surplus, producersurplus, government revenue, and total surplus both before and after theimposition of the tariff. Because consumer surplus declines by C + D + E + Fwhile producer surplus rises by C and government revenue rises by E, thedeadweight loss is D + F. The loss of consumer surplus in the amount C + D +E +F is split up as follows: C goes to producers, E goes to the government,and D + F is deadweight loss.Figure 6Before Tariff After Tariff CHANGE Consumer Surplus A + B + C + D + E + F A + B –(C + D + E + F) Producer Surplus G C + G +C Government Revenue 0 E +EA +B +C + E + G –(D + F)Total Surplus A + B + C + D + E + F +G4. a. For a country that imports clothing, the effects of a decline in the worldprice are shown in Figure 7. The initial price is P w1 and the initial level ofimports is Q d1 – Q s1. The new world price is P w2 and the new level ofimports is Q d2 – Q s2. The table below shows the changes in consumersurplus, producer surplus, and total surplus. Domestic consumers are made better off, while domestic producers are made worse off. Total surplusrises by areas D + E + F.Figure 7 Figure 8P w1P w2CHANGE Consumer Surplus A+B A+B+C+D+E+F C+D+E+FProducer Surplus C+G G –CD+E+F Total Surplus A+C+G A+B+C+D+E+F+Gb. For a country that exports clothing, the effects of a decline in the worldprice are shown in Figure 8. The initial price is P w1 and the initial level ofexports is Q s1 – Q d1. The new world price is P w2 and the new level ofexports is Q s2 – Q d2. The table below shows the changes in consumersurplus, producer surplus, and total surplus. Domestic consumers are made better off, while domestic producers are made worse off. Total surplusfalls by area D.P w1P w2CHANGE Consumer Surplus A A + B + C B + C Producer Surplus B + C + D + E + F + G + H E + F + G + H –B – C – D–DTotal Surplus A + C + G A + B + C + E + F + G +Hc. Overall, importing countries benefit from the fall in the world price ofclothing, while exporting countries are harmed.5. The tax on wine from California is just like a tariff imposed by one country onimports from another. As a result, Washington producers would be better offand Washington consumers would be worse off. The higher price of wine inWashington means producers would produce more wine, so they would hiremore workers. Tax revenue would go to the government of Washington. Soboth claims are true, but it is a bad policy because the losses to Washingtonconsumers exceed the gains to producers and the state government.6. a. There are many possible answers.b. There are many possible answers.7. Senator Hollings is correct that the price of clothing is the world price. Whentrade is allowed, the domestic price of clothing is driven to the world price.The price is lower than it would be in the absence of trade, so consumersurplus is higher than it would be without trade and this means that consumersdo benefit from lower-priced imports.8. a. Figure 9 shows the market for T-shirts in Textilia. The domestic price is$20 Once trade is allowed, the price drops to $16 and three millionT-shirts are imported.Figure 9b. Consumer surplus increases by areas A + B + C. Area A is equal to ($4)(1million) +(0.5)($4)(2 million) = $8 million. Area B is equal to (0.5)($4)(2million) = $4 million. Area C is equal to (0.5)($4)(1 million) = $2 million.Thus, consumer surplus increases by $14 million.Producer surplus declines by area A. Thus, producer surplus falls by $8million.Total surplus rises by areas B + C. Thus, total surplus rises by $6 million.9. a. Figure 10 shows the market for grain in an exporting country. The worldprice is P W.Figure 10b. An export tax will reduce the effective world price received by theexporting nation.c. An export tax will increase domestic consumer surplus, decrease domesticproducer surplus, and increase government revenue.d. Total surplus will fall because the decline in producer surplus is less thanthe sum of the changes in consumer surplus and government revenue.Thus, there is a deadweight loss as a result of the tax.10. a. This statement is true. For a given world price that is lower than thedomestic price, quantity demanded will rise more when demand is elastic.Therefore, the rise in consumer surplus will be greater when demand iselastic.b. This statement is false. Quantity demanded would remain unchanged, butbuyers would pay a lower price. This would increase consumer surplus.Domestic producer surplus will fall, but by less than the rise in consumersurplus. Gains from trade will increase.c. This statement is false. Even though quantity demanded does not risewhen trade is allowed, consumer surplus rises, because consumers arepaying a lower price.11. a. Figure 11 shows the market for jelly beans in Kawmin if trade is notallowed. The market equilibrium price is $4 and the equilibrium quantityis 4. Consumer surplus is $8, producer surplus is $8, and total surplus is$16.Figure 11b. Since the world price is $1, kawmin will become an importer of jellybeans. Figure 12 shows that the domestic quantity supplied will be 1,quantity demanded will be 7, and 6 bags will be imported. Consumersurplus is $24.50, producer surplus is $0.50, so total surplus is $25.Figure 12c. The tariff raises the world price to $2. This reduces domestic consumptionto 6 bags and raises domestic production to 2 bags. Imports fall to 4 bags(see Figure 12). Consumer surplus is now $18, producer surplus is $2,government revenue is $4, and total surplus is $24.d. When trade was opened, total surplus increases from $16 to $25. Thedeadweight loss of the tariff is $1 ($25 − $24).13. a. When a technological advance lowers the world price of televisions, theeffect on the United States, an importer of televisions, is shown in Figure13. Initially the world price of televisions is P1, consumer surplus is A + B,producer surplus is C + G, total surplus is A + B + C + G, and the amountof imports is shown as “Imports1”. After the improvement in technology,the world price of televisions declines to P2 (which is P1 – 100), consumersurplus increases by D + E + F, producer surplus declines by C, totalsurplus rises by D + E + F, and the amount of imports rises to “Imports2”.Figure 13P1P2CHANGE Consumer Surplus A + B A + B + C + D + E + F C + D + E + F Producer Surplus C + G G –CTotal Surplus A + B + C + G A + B + C + D + E + F + G D + E + Fb. The areas are calculated as follows: Area C = 200,000($100) +(0.5)(200,000)($100)= $30 million. Area D = (0.5)(200,000)($100) = $10 million. Area E =(600,000)($100) = $60 million. Area F = (0.5)(200,000)($100) = $10million.Therefore, the change in consumer surplus is $110 million. The change inproducer surplus is -$30 million. Total surplus rises by $80 million.c. If the government places a $100 tariff on imported televisions, consumerand producer surplus would return to their initial values. That is, consumer surplus would fall by areas C + D + E + F (a decline of $110 million).Producer surplus would rise by $30 million. The government would gaintariff revenue equal to ($100)(600,000) = $60 million. The deadweightloss from the tariff would be areas D and F (a value of $20 million). Thisis not a good policy from the standpoint of U.S. welfare because totalsurplus is reduced after the tariff is introduced. However, domesticproducers will be happier as they benefit from the tariff.d. It makes no difference why the world price dropped in terms of ouranalysis. The drop in the world price benefits domestic consumers morethan it harms domestic producers and total welfare improves.14. An export subsidy increases the price of steel exports received by producersby the amount of the subsidy, s, as shown in Figure 14. The figure shows the world price, P W, before the subsidy is put in place. At that price, domesticconsumers buy quantity Q1D of steel, producers supply Q1S units, and thecountry exports the quantity Q1S – Q1D. With the subsidy put in place,suppliers get a total price per unit of P W + s, because they receive the world price for their exports P W, and the government pays them the subsidy of s.However, note that domestic consumers can still buy steel at the world price, P W, by importing it. Domestic firms do not want to sell steel to domesticcustomers, because they do not get the subsidy for doing so. So domesticcompanies will sell all the steel they produce abroad, in total quantity Q2S.Domestic consumers continue to buy quantity Q1D. The country imports steel in quantity Q1D and exports the quantity Q2S, so net exports of steel are the quantity Q2S – Q1D. The end result is that the domestic price of steel isunchanged, the quantity of steel produced increases, the quantity of steelconsumed is unchanged, and the quantity of steel exported increases. As thefollowing table shows, consumer surplus is unaffected, producer surplus rises, government revenue declines, and total surplus declines.Figure 14Thus, it is not a good policy from an economic standpoint because there is a decline in total surplus.Without Subsidy With Subsidy CHANGE Consumer Surplus A + B A + B 0 Producer Surplus E + F + G B + C + E + F + G +(B + C)0 –(B + C + D) –(B + C + D) GovernmentRevenueTotal Surplus A + B + E + F + G A + B – D + E + F + G –D。