六级图表作文
- 格式:ppt
- 大小:215.00 KB
- 文档页数:42
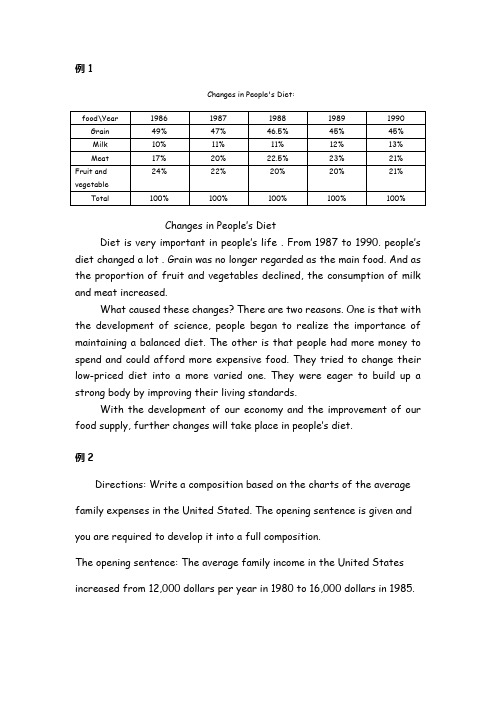
例1Changes in People's Diet:Changes in People’s DietDiet is very important in people’s life . From 1987 to 1990. people’s diet changed a lot . Grain was no longer regarded as the main food. And as the proportion of fruit and vegetables declined, the consumption of milk and meat increased.What caused these changes? There are two reasons. One is that with the development of science, people began to realize the importance of maintaining a balanced diet. The other is that people had more money to spend and could afford more expensive food. They tried to change their low-priced diet into a more varied one. They were eager to build up a strong body by improving their living standards.With the development of our economy and the improvement of our food supply, further changes will take place in people’s diet.例2Directions: Write a composition based on the charts of the average family expenses in the United Stated. The opening sentence is given and you are required to develop it into a full composition.The opening sentence: The average family income in the United States increased from 12,000 dollars per year in 1980 to 16,000 dollars in 1985.The Average Family ExpensesThe average family income in the United States has increased from 12,000 dollars per year in 1980 to 16,000 dollars in 1985. In the meantime, the structure of the average family expenses has changed, too. These graphs show the change clearly.The biggest part of the average family expenses was housing. In 1980, the average family spent 25 percent of its income on housing. In 1985, expenses on housing rose to 32 percent. Food and drink were the second biggest part of the average family expenses .In 1980, about 18% of the average income was spent on this item. In 1985, the figure grew to 22%. As a result of such increase in the expenses on housing and food, expenses on other items have been reduced from 57% in 1980 to 46% in 1985.Thus, a conclusion can be drawn that as income increases, people can improve their living step by step. But still the average family has to spend a large part of income to meet the essential needs.例3Health Gains in Developing Countries①以下图为依据,描述发展中国家的期望寿命(life expectancy)和婴儿死亡率(infant mortality)的变化情况。

六级图表类作文范文
范文:
第一段,图表揭秘。
一看这图表,就知道近几年那城市居民出行方式可变了不少。
私家车越来越多,公共交通和走路的人越来越少。
第二段,私家车火爆。
说起私家车,那可真是火得一塌糊涂。
从2018年到2023年,
私家车的使用率从30%一路飙升到快50%了。
这背后啊,肯定是大家
生活好了,都想开车方便点。
第三段,公共交通遇冷。
可另一边呢,公共交通就没那么受欢迎了。
图表显示,用公共
交通的人越来越少,可能和私家车多了、公交服务没跟上都有关系。
第四段,步行渐少。
再来说说步行。
以前大家都爱走路,现在可不一样了。
城市的节奏越来越快,大家都想快点到达目的地,所以走路的人就少了。
第五段,环境与健康小忧。
这出行方式一变,环境和健康也跟着受影响。
私家车多了,空气和噪音污染都加重了;走路的人少了,大家运动也少了,健康自然就受影响了。
第六段,未来咋办。
那未来怎么办呢?城市管理者可得好好想想了。

六级图表写作真题及范文六级图表写作真题及范文Part V Writing 图表作文,关于一个美国大学图书馆的图书流动量,给出他们的’流动比例对比,说明原因,并说明你自己喜欢阅读什么样的书。
[范文] From the table based on a survey we made of the reading preferences of students in an American university in 2002, we learnt that, of all kinds of bookds, contemporary university students like ficitions best, which has 65.9 percent of book circulation in library while other kinds of books have low percentage: general nonfiction --18.2, science/technology/education-10.8,art/literature/poetry--5.1. It suggests that contemporary students are much more easily influenced by the fashion than ever before. Its a reasonable and good phenomenon because it reveals that university students like to keep up with the development of society. Thus they will easily adapt themselves into the new life after they graduate from school. Generally, I like reading nonfictions, for it is tightly connected with the reality. To some degree, its no use reading too much fictions which sometimes will take you into fancy fantasy. Fast life pace also dont allow me to read books on art or poetry. To me, nonfiction is even helpful in analyzing society and humanity.。

六级各类型作文万能模板六级议论文万能模板。
一、图表作文。
Recently, there has been a heated discussion about the issue of (图表中的具体内容). According to the chart/table, it is clear that (图表中的具体内容). The reasons for this phenomenon are as follows. Firstly, (原因一). Secondly, (原因二). Thirdly, (原因三). Therefore, it is reasonable to predict that (预测).From my perspective, the reasons for (图表中的具体内容) are not limited to the above-mentioned ones. On the one hand, (进一步的观点一). On the other hand, (进一步的观点二). What's more, (进一步的观点三).In conclusion, (总结). Therefore, it is imperative for us to take drastic measures to put an end to (图表中的具体内容).二、图画作文。
The picture depicts a scene where (图画中的具体内容). This picture serves as a thought-provoking reflection of (图画主题). From my perspective, the picture conveys a profound message that (图画的寓意).There are a number of reasons contributing to this phenomenon. Firstly, (原因一). Secondly, (原因二). Thirdly, (原因三). Therefore, it is reasonable to predict that (预测).From my perspective, the reasons for (图画中的具体内容) are not limited to the above-mentioned ones. On the one hand, (进一步的观点一). On the other hand, (进一步的观点二). What's more, (进一步的观点三).In conclusion, (总结). Therefore, it is imperative for us to take drastic measures to put an end to (图画中的具体内容).三、图表作文。

英语六级图表类作文真题英文回答:Bar charts are a common and versatile type of graphic used to represent data. They are typically used to compare different categories or values, and can be used to show trends or patterns over time. Bar charts are relatively easy to understand, and can be used to present data in a clear and concise way.To create a bar chart, you will need to first collect your data. Once you have your data, you will need to decide how you want to organize it. You can organize your data by category, by value, or by time. Once you have organized your data, you can begin to create your chart.To create a bar chart in Excel, you can follow these steps:1. Select the data that you want to chart.2. Click on the "Insert" tab.3. Click on the "Bar" chart type.4. Choose the type of bar chart that you want to create.5. Click on "OK".Your bar chart will be created and you can nowcustomize it to your liking. You can change the colors ofthe bars, the labels on the x and y axes, and the title of the chart. You can also add a legend to your chart to makeit easier to understand.中文回答:条形图是一种常见且用途广泛的图表类型,用于表示数据。

瑞思拜六级新版作文模板一、图表作文。
图表作文是瑞思拜六级新版作文中的一种常见题型,要求考生根据提供的图表信息进行分析和描述。
在写作时,考生可以按照以下模板进行组织:1. 介绍图表内容。
首先,要简要介绍图表的内容,包括图表的类型(饼状图、柱状图、折线图等)、数据来源和所反映的主题。
2. 分析数据趋势。
接下来,要对图表中的数据进行分析,包括数据的起伏变化、趋势走向等。
可以使用一些数据的比较和对比,突出数据之间的关联。
3. 提出原因和解决方法。
在分析数据的基础上,要提出数据变化的原因和可能的解决方法。
可以结合实际情况和相关知识进行分析,提出合理的观点和建议。
4. 总结观点。
最后,要对整篇文章进行总结,重申观点和建议,并指出可能的影响和未来的发展趋势。
二、观点对立作文。
观点对立作文是瑞思拜六级新版作文中的另一种常见题型,要求考生就一个话题进行讨论,提出自己的观点,并对立的观点进行反驳。
在写作时,考生可以按照以下模板进行组织:1. 提出话题。
首先,要明确提出讨论的话题,简要介绍话题的背景和相关信息。
2. 提出自己的观点。
接下来,要提出自己对于这个话题的观点,并给出理由和论据。
可以结合自身经验和相关知识进行阐述。
3. 反驳对立观点。
在提出自己观点的同时,要对对立的观点进行反驳,指出其不足之处,并给出相应的论据和例子。
4. 总结观点。
最后,要对整篇文章进行总结,重申自己的观点,并指出可能的影响和解决方法。
三、议论文。
议论文是瑞思拜六级新版作文中的另一种常见题型,要求考生就一个话题进行深入的讨论和分析。
在写作时,考生可以按照以下模板进行组织:1. 提出话题。
首先,要明确提出讨论的话题,简要介绍话题的背景和相关信息。
2. 分析话题。
接下来,要对话题进行深入的分析,包括话题的现状、存在的问题和可能的解决方法。
可以使用一些具体的例子和论据进行阐述。
3. 提出观点和建议。
在分析话题的基础上,要提出自己的观点和建议,指出可能的解决方法和改进措施。
六级图表作文
近年来,随着我国国际化进程不断加速,越来越多的外国留学生
选择到中国留学。
下面是一张关于2010年至2017年中国和美国留学
生数量变化的柱状图,我们可以从中看到留学生数量的变化趋势。
从图表中可以看出,2010年到2017年期间,中国和美国留学生数量都有了显著的增长。
其中,中国留学生数量从2010年的27.4万人
上升到了2017年的49.5万人,增长了80.25%。
而美国留学生数量也
从2010年的76.1万人增长到了2017年的106.5万人,增长了40%左右。
可以看出,中国和美国都是拥有较多留学生的国家,但是中国的
留学生增长速度更快,达到了80.25%的增长率,远高于美国的40%左右。
这主要得益于中国的经济实力和对外开放程度的提高,以及中国
在国际舞台上的影响力不断提升。
同时,中国高等教育质量不断提高,国内大学与国际知名高校的交流也越来越频繁,吸引了越来越多的外
国留学生来到中国学习。
相比之下,美国的留学生增长速度虽然较低,但留学生总量依然居于全球第一位。
这主要得益于美国在教育领域的强大实力和学术水平,以及美国在世界范围内所具有的较高的知名度和品牌效应。
总的来说,中国和美国作为全球最大的两个留学目的地,在各自的发展之路上都取得了重要成果。
未来,我们可以预见,中美两国之间的教育交流合作还将不断深化和拓展,为各自的发展和两国人民之间的友好交往做出更多贡献。
英语六级图表作文模板英文回答:Introduction.Begin with a general statement about the topic. State the purpose of the chart.Body Paragraph 1。
Describe the first aspect of the chart.Provide specific examples from the data.Body Paragraph 2。
Describe the second aspect of the chart.Provide specific examples from the data.Body Paragraph 3 (Optional)。
If necessary, describe a third aspect of the chart.Provide specific examples from the data.Conclusion.Summarize the main findings of the chart.Restate the purpose of the chart.Example Essay.Topic: The Impact of Social Media on Teenagers.Introduction.In today's digital age, social media has become an integral part of teenagers' lives. It offers a platform for communication, self-expression, and entertainment. However,concerns have been raised about the potential impact of social media on their well-being and development. This chart analyzes data from a recent survey that examined the relationship between social media use and teenage behavior.Body Paragraph 1。
六级英语图表类范文英文回答:The provided chart illustrates the significant decline in the number of wildlife species in different regions of the world between 1970 and 2018, as reported by the World Wildlife Fund (WWF). The WWF's Living Planet Index (LPI), which measures the abundance of vertebrate species in various biomes, has decreased by an alarming 68% duringthis period.In 1970, the LPI stood at 100, indicating no change from the baseline year. However, by 2018, the index had plummeted to 32, signifying a catastrophic loss of wildlife populations. The decline is particularly pronounced in tropical regions, with the LPI in the Amazon rainforest mengalami a staggering 94% drop and the Congo Basin suffering an 83% reduction.The decline in wildlife populations is primarilyattributed to human activities such as habitat loss, overfishing, and climate change. Deforestation for agriculture, logging, and development has destroyed vast areas of natural habitats, depriving wildlife of their homes and food sources. Overfishing has depleted fish stocks, disrupting marine ecosystems and threatening the livelihoods of coastal communities. Climate change isfurther exacerbating these threats by altering temperatures and precipitation patterns, affecting species' habitats and their ability to survive.The consequences of wildlife decline are far-reaching. Healthy wildlife populations are essential for maintaining ecosystem balance, pollinating plants, and dispersing seeds. Their loss can ripple through entire food webs, leading to the collapse of entire ecosystems. Moreover, wildlifedecline has severe implications for human well-being, as it affects food security, water quality, and the availabilityof natural resources.Addressing wildlife decline requires a concerted effort from governments, organizations, and individuals.Protecting and restoring natural habitats, implementing sustainable fishing practices, and mitigating climate change are crucial steps towards safeguarding wildlife populations. Additionally, raising awareness about the importance of wildlife and encouraging responsible consumption patterns can contribute to reducing humanimpact on the environment.中文回答:根据世界自然基金会(WWF)的报告,图表显示了全球不同地区野生动物种群数量在 1970 年至 2018 年间大幅下降。
图表作文图表是科学文献中常用的一种表达手段。
四六级图表作文利用图形〔figure〕、表格〔table〕、曲线图〔graph〕、柱状图〔pie chart〕和饼状图〔pie chart〕等作为写作提示,并以此为依据要求用简洁生动的语言把图标中所给出的信息完整而准确地表达出来。
这一类作文通常前半局部说明图标所表达的信息,后半局部进行议论,不管以何种方式出现,图标作文还是遵循一定的模式。
最常见的模式是:第一段:描述现状。
简要地描述图表,概括图表所表现的社会问题。
第二段:分析原因。
剖析图表所反映的深层次问题。
用图表来论证第一段提出的主题,或者分析各个数据产生的原因。
第三段:结论和启示。
从图表中所表达的现象获得结论或者启示,或者对图标所表现的趋势加以预测。
图表作文模式Model 1①As is shown/depicted/described in the picture/chart/cartoon, 概括图表内容。
②For one thing, 支持这一内容的一个方面。
③For another, 支持这一内容的另外一个方面。
④It is obvious that图表所反映的内容。
⑤Many remarkable factors contribute to主题。
⑥First of all, 理由一。
⑦In addition, 理由二。
⑧Thirdly,理由三。
⑨Considering all these, I believe that我的看法或偏好。
⑩First of all, 个人看法的依据一。
⑾Furthermore, 个人看法的依据二。
⑿Therefore, 个人的结论或文章的结论。
Model 2Para1 (同上)⑤The reasons of主题lie in several aspects. ⑥First of all, 理由一。
⑦In addition, 理由二。
⑧Thirdly,理由三。
⑨As I understand, 我的看法或偏好。