用户体验度量表
- 格式:xlsx
- 大小:24.68 KB
- 文档页数:1
对用户体验(User Experience)进行量化的4维度量方法用户体验(User Experience),正在成为判断一个网站或Web应用是否成功的关键标志。
通常,对用户体验只能作定性表述,带有比较强的主观色彩。
下面这篇文章勾勒了一个关于用户体验的简易的量化分析模型。
可以比较快速、相对客观地对站点的用户体验进行可视化的表示。
What is the User Experience?The term "user experience" refers to a concept that places the end-user at the focal point of design and development efforts, as opposed to the system, its applications or its aesthetic value alone. It's based on the general concept of user-centered design.The user experience is primarily made up of a four factors: ∙branding∙usability [1]∙functionality∙contentIndependently, none of these factors makes for a positive user experience; however, taken together, these factors constitute the main ingredients for a website's success.adTake, for example, a brilliantly designed site that routinely gives server errors, or times-out. Or imagine a fantastic, database-driven application that, for some reason or other, is never used because it's buried deep within the bowels of the site's information architecture. In both cases, we see that the independent elements of branding, usability, functionality and content structure aren't necessarily indicative of a site's success. Yet, when taken together, these core elements provide the basis for the user experience.The Need for an Objective Analysis ToolSay you've got a new lead -- they're unhappy with their Website in its current form and want you to help steer the site in the right direction. If you're like me, the first thing you'll do is take a look at the site and make some cursory mental notes. How then do you convey these ideasand notes back to the client without simply ripping the current site apart?The problem is that each of our perceptions of how 'good' or 'bad' a Website is, is skewed by our personal backgrounds and specialties within the industry. Asked to evaluate a Website's benefits and constraints, a developer, usability professional, designer or information architect may come up with an entirely different critique.An objective tool for measurement and analysis helps you provide your clients with fact-based recommendations, as opposed to mere conjecture and opinion. The methodology we'll explore in this article will help you to:∙Remove your personal preferences (subjectivity) from the equation as much as possible.∙Enable persons with different backgrounds (designers, developers, clients) to share a common understanding of the site.∙Create ground rules for comparisons of the site to those of competitors, or past development efforts.∙Provide your clients with a fact-based, visual representation of their site's benefits and limitations.Measuring the User ExperienceAs mentioned above, the user experience is made up of four interdependent elements:∙branding∙usability∙functionality∙contentBut, how can we quantify and measure these seemingly intangible elements?The methodology is quite simple. We separate our analysis into four sections -- one for each of the four elements of the user experience. For each of these elements, we create a series of statements or parameters against which the Website in question will be measured. A scale of 1 to X is created for each of the statements; we give each statement a score within this range.Once you've completed this first part of the analysis, you should have a score for each of the statements in each of the four sections.In the sample analysis attached to this article, we only used five statements or parameters for each element. Consequently, we work with a 20-point scale, so that the maximum total score of the site is 100. So, if we added an extra five statements or parameters to each element, we'd rate each on a 10-point scale.Below, find a brief explanation of each of the elements and the statements or parameters used in the sample analysis.BrandingBranding includes all the aesthetic and design-related items within a Website. It entails the site's creative projection of the desired organizational image and message. Statements used to measure branding can include:The site provides visitors with an engaging and memorable experience.∙The visual impact of the site is consistent with the brand identity.∙Graphics, collaterals and multimedia add value to the experience.∙The site delivers on the perceived promise of the brand.∙The site leverages the capabilities of the medium to enhance or extend the brand.FunctionalityFunctionality includes all the technical and 'behind the scenes' processes and applications. It entails the site's delivery of interactive services to all end users, and it's important to note that this sometimes means both the public as well as administrators. Statements used to measure a site's functionality can include:∙Users receive timely responses to their queries or submissions.∙Task progress is clearly communicated (e.g., success pages or email updates).∙The Website and applications adhere to common security and privacy standards.∙Online functions are integrated with offline business processes.∙The site contains administration tools that enhance administrator efficiency.UsabilityUsability entails the general ease of use of all site components and features. Sub-topics beneath the usability banner can include navigation and accessibility [2]. Statements used to measure usability might include:∙The site prevents errors and helps the user recover from them.∙Overall page weight is optimized for the main target audience.∙The site helps its visitors accomplish common goals and tasks.∙The site adheres to its own consistency and standards.∙The site provides content for users with disabilities.ContentContent refers to the actual content of the site (text, multimedia, images) as well as its structure, or information architecture. We look to see how the information and content are structured in terms of defined user needs and client business requirements. Statements used to measure content can include:∙Link density provides clarity and easy navigation.∙Content is structured in a way that facilitates the achievement of user goals.∙Content is up-to-date and accurate.∙Content is appropriate to customer needs and business goals.∙Content across multiple languages is comprehensive.In most instances, I use from 10-20 separate statements for each of these four elements. I suggest you use the statements above as a basis for creating your own analysis. Remember that if you add more statements, you must also refine the 20-point scale so that each element's total score is 100. For example, if you used 10 statements for each element, then your rating scale would be 1-10. If you used 20 statements for each element, your scale would be 1-5.For a example of this style of analysis download this sample Excel file [3].Displaying Your ResultsOnce you've completed your analysis and have values for each of the statements or parameters, it's time to put this data into a clear, communicative format.The first thing we want to do is add up all the values for each element. Because we've set the point scale to provide with a maximum score of 100 for each element, what we really have is a percentage score. Once we have these percentage values, what I've found works best is to create a Spider chart to visually represent them. Microsoft's Excel or Open Office Calcboth work well here, although any spreadsheet program with graphing capabilities will do.Using your spreadsheet program, you can generate a host of visual representations of the data. See the sample file you downloaded above for more examples.Get Creative with Your AnalysisThe great thing about the analysis and methods described in this article is that they can be catered to your specific client or project needs.There's no reason why you couldn't add a fifth category to the analysis to describe accessibility or business metrics. For example, say you've got a government client that needs to adhere to Section 508 regulations (for the U.S.). You could easily create a set of statements or parameters that deal exclusively with the accessibility element, modifying your charts to display accordingly. Likewise, it would be very easy to create a category that deals exclusively with your client's important business metrics, for example, ROI, click-through rates, conversions, or repeat customers.Alternatively, this platform of analysis can enable you to add greaterweight to particular elements of your choice. Say you have a client who's a luxury goods manufacturer, and is heavily focused on branding and look and feel. There's no reason why you couldn't create a modified measurement system that gave greater weight to the branding elements and less to, say, the usability elements.Practical UsesI've incorporated this analysis into a number of different projects on which I've worked. Often, I include a 'quick and dirty' analysis as an appendix to a new client proposal, to provide the prospective clients a snapshot view of where their site stands vis-à-vis the competition.Providing this kind of review also gives you an excellent chance to display your professionalism. Chances are that other firms bidding on the RFP in question will not include such 'free' consulting services -- and your inclusion of this report in your proposal may be a decisive factor in your favor.In other instances, I've had clients pay for an in-depth analysis of their site complete with recommendations. This type of report includes, for each of the statements or parameters, several descriptive paragraphs complete with examples or screen shots. If I'm ultimately hired to follow through on my recommendations, I often schedule another evaluation six months after the launch of the site as a means of showing improvement, while at the same time reinforcing the value of my services.This type of analysis can also serve as a gateway project that leads to further business. If you price the analysis well, it can be a great tool for getting your foot in the door and showing the new client the benefits of your services.。
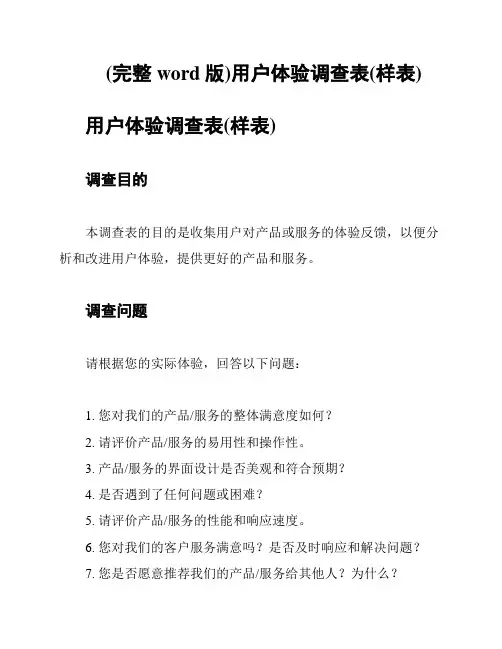
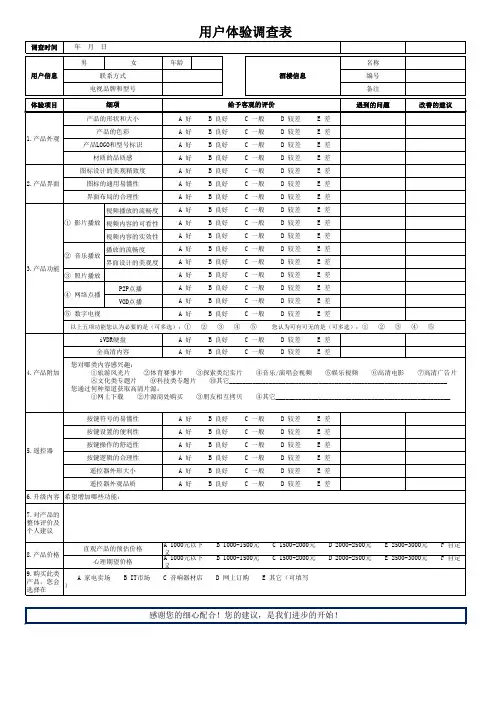
(完整word版)用户体验调查表(样表)用户体验调查表(样表)
调查目的
本调查表的目的是收集用户对产品或服务的体验反馈,以便分析和改进用户体验,提供更好的产品和服务。
调查问题
请根据您的实际体验,回答以下问题:
1. 您对我们的产品/服务的整体满意度如何?
2. 请评价产品/服务的易用性和操作性。
3. 产品/服务的界面设计是否美观和符合预期?
4. 是否遇到了任何问题或困难?
5. 请评价产品/服务的性能和响应速度。
6. 您对我们的客户服务满意吗?是否及时响应和解决问题?
7. 您是否愿意推荐我们的产品/服务给其他人?为什么?
调查填写方式
请您根据上述问题,选择适当的答案或提供相关意见。
您的反馈对我们非常重要,感谢您花费宝贵时间参与本次调查。
答案选项:
1. 非常满意
2. 满意
3. 一般
4. 不满意
5. 非常不满意
调查结果分析
我们将根据您的反馈收集、分析和归纳调查结果。
反馈将帮助我们了解用户的需求和意见,并通过改进和优化来提高产品和服务的体验。
谢谢您的参与!
---
*注意:本调查表仅供样例参考,实际使用时请根据实际情况进行调整。
*。
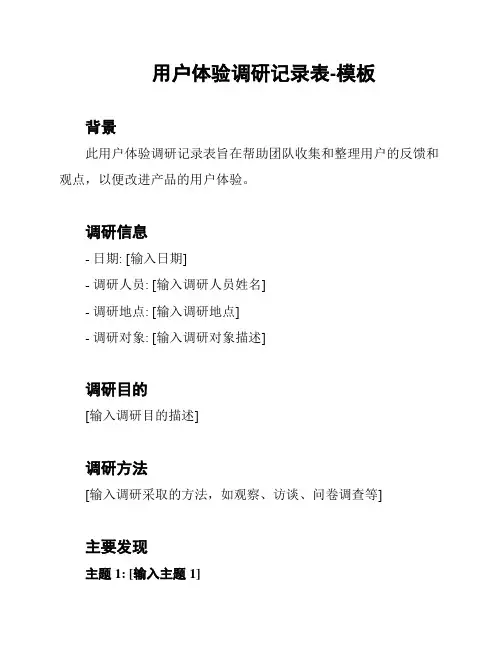
用户体验调研记录表-模板
背景
此用户体验调研记录表旨在帮助团队收集和整理用户的反馈和观点,以便改进产品的用户体验。
调研信息
- 日期: [输入日期]
- 调研人员: [输入调研人员姓名]
- 调研地点: [输入调研地点]
- 调研对象: [输入调研对象描述]
调研目的
[输入调研目的描述]
调研方法
[输入调研采取的方法,如观察、访谈、问卷调查等]
主要发现
主题1: [输入主题1]
- 发现1: [输入发现1描述]
- 发现2: [输入发现2描述]
- ...
主题2: [输入主题2]
- 发现1: [输入发现1描述]
- 发现2: [输入发现2描述]
- ...
主题3: [输入主题3]
- 发现1: [输入发现1描述]
- 发现2: [输入发现2描述]
- ...
结论
根据上述调研结果,我们得出以下结论:- 结论1: [输入结论1描述]
- 结论2: [输入结论2描述]
- ...
建议
基于以上结论,我们提出以下改进建议:
- 建议1: [输入建议1描述]
- 建议2: [输入建议2描述]
- ...
下一步计划
我们将根据以上结论和建议,制定以下下一步行动计划:
- 计划1: [输入计划1描述]
- 计划2: [输入计划2描述]
- ...
参考资料
[列出参考资料,如调研报告、采访记录等]
以上为用户体验调研记录表的模板,可根据具体需求进行相应调整和填写。
感谢您的使用!。
客户体验度量案例
客户体验度量是评估客户在购买、使用和与公司互动的过程中所感受到的满意度和忠诚度的指标。
以下是10个客户体验度量案例的例子:
1. 客户满意度调查:通过定期的调查问卷,了解客户对产品或服务的满意度,并根据反馈结果改进产品或服务。
2. 客户投诉率:统计客户投诉的数量和比例,作为衡量客户体验的指标,高投诉率可能意味着客户体验不佳。
3. 客户忠诚度:通过跟踪客户的重复购买行为和口碑传播,评估客户对品牌的忠诚度,忠诚度高的客户通常意味着他们对产品或服务的体验较好。
4. 客户续约率:衡量客户是否继续购买该产品或服务的比例,续约率高意味着客户对产品或服务的体验较好。
5. 客户推荐率:通过测量客户愿意向他人推荐该产品或服务的比例,评估客户对产品或服务的满意度。
6. 客户体验指数(CXI):通过综合多个指标,如满意度、忠诚度、投诉率等,计算客户体验的综合指数。
7. 客户接触点满意度:评估客户在与公司的各个接触点,如电话、网站、社交媒体等,的体验满意度。
8. 服务响应时间:衡量客户提交问题或请求后,公司给出回应的时间,快速响应能提高客户体验。
9. 产品退货率:统计客户对产品的退货数量和比例,高退货率可能意味着产品质量或功能不符合客户期望。
10. 客户参与度:评估客户参与公司活动、调查或反馈的程度,高参与度意味着客户对与公司的互动体验较好。
以上是10个客户体验度量案例,通过这些指标可以全面衡量客户体验的质量,从而改进产品或服务,提升客户满意度和忠诚度。
顾客体验调查表最新版
调查目的
本次调查的目的是了解顾客对于我们公司提供的产品或服务的体验和满意度,以便我们能够针对顾客的反馈进行改进和优化,提升顾客满意度和忠诚度。
调查方法
我们将采用问卷调查的方式进行顾客体验调查。
调查问卷将涵盖以下几个方面的内容:
1. 产品质量:请您评价我们产品的质量,包括产品的可靠性、耐用性和性能等方面。
2. 服务质量:请您评价我们公司提供的售前服务、售后服务和客户支持服务的质量和效率。
3. 交付速度:请您评价我们产品的交付速度,包括订单处理时间、物流配送时间等方面。
4. 价格合理性:请您评价我们产品的价格是否合理,是否与产
品的性能和质量相符。
5. 顾客体验:请您对购物体验、客户体验等方面给予评价,包
括网站界面易用性、客户沟通交流等。
6. 其他意见与建议:如果您还有其他对我们公司的建议和意见,请在此提出。
隐私保护
我们承诺对您的个人信息进行保护,所有的调查结果将被匿名
处理,仅用于内部分析和改进,不会用于其他商业目的。
特别鸣谢
您的参与对于我们的调查非常重要,感谢您抽出宝贵的时间帮
助我们改进产品和服务。
如果您有任何疑问或需要进一步了解,请
联系我们的客户服务部门。
如何参与
感谢您的支持和合作!。
用户体验调查
背景信息
本次用户体验调查旨在了解用户在使用我们的产品或服务时的
感受和反馈意见,以帮助我们不断优化产品和提升用户体验。
调查目的
- 了解用户对产品的整体满意度
- 发现用户在使用过程中遇到的问题和困惑
- 收集用户对产品功能和界面的改进建议
调查内容
1. 产品满意度评估:
- 请您从1到5打分,其中1表示非常不满意,5表示非常满意。
请您评价以下方面:
- 产品的易用性
- 产品的性能和稳定性
- 产品的外观和设计
- 产品的功能丰富程度
2. 使用体验反馈:
- 请您简要描述您在使用产品或服务时的感受和体验,包括优点和不足之处。
3. 问题和困惑:
- 在使用产品或服务过程中,您是否遇到过任何问题或困惑?请详细描述。
4. 改进建议:
- 请提供您对产品功能和界面的改进建议,包括您认为可以增加的功能或改善的地方。
调查方法
2. 个人访谈:如果您愿意参与个人访谈以更深入地分享您的体验和建议,请在调查表中留下您的联系方式,我们将与您取得联系并安排访谈时间。
数据保密
我们将严格保护您的个人信息和反馈内容,并仅用于内部分析
和产品优化的目的。
同时,我们将对您的反馈进行汇总和匿名处理,以确保您的隐私和匿名性。
感谢您的参与!您的反馈对我们改进产品和提升用户体验至关
重要。
请您在调查中如实分享您的意见和建议。
如果您有任何其他
问题或需要进一步的帮助,请随时与我们联系。
客户满意度汇总表概述这是一份客户满意度汇总表,旨在记录客户对我们公司的各项服务的评价,为我们更好地了解客户需求、改善服务提供基础数据。
本文将详细介绍我们的调查方法、结果汇总、分析及改进计划。
调查方法我们通过在线问卷的方式收集客户对我们服务的反馈意见,问卷包括以下几个方面:1.产品质量2.服务态度3.价格合理性4.交付速度5.客户体验感问卷采用五级评分制,评分从一分到五分,分别对应完全不满意、不满意、一般、满意和非常满意。
我们在问卷的最后留下了一个自由意见反馈区,供客户留言建议。
调查结果汇总我们在一个月内收到了300份有效问卷,根据五级评分制,我们对各个方面的评价指数进行了统计,结果如下表所示:方面平均分产品质量 4.2服务态度 4.3价格合理性 4.1交付速度 4.0客户体验感 4.2根据评价指数可以看出,我们产品质量和服务态度得到了客户的较高评价,但在价格合理性和交付速度方面表现一般。
而客户体验感得分也仅达到了4.2分,说明我们还有进一步提升客户体验的空间。
分析及改进计划通过对调查结果的分析,我们认为客户对我们产品和服务的总体评价还是较高的,但在价格合理性和交付速度方面表现一般,这也是我们需要重点改进的方面。
另一方面,我们的客户体验感得分较高,但仍有一些客户体验方面的问题需要解决。
针对问题,我们拟定了以下改进计划:1.价格合理性问题:我们将积极控制成本,同时不降低产品质量的前提下适当优化价格,提高价格合理性。
2.交付速度问题:我们将深入对接供应商和物流公司,优化采购及交付流程,缩短交付时间。
3.客户体验问题:我们将加强售前、售后服务的培训,提高服务态度和效率;我们将对客户反馈意见进行及时回复和处理,不断优化服务流程,提高客户满意度。
结论本文介绍了我们的客户满意度调查、结果汇总及分析,通过对调查结果的分析,我们发现我们的产品质量和服务态度得到客户的较高评价,但在价格合理性和交付速度方面表现一般。
客户体验同业对标体验情况表通常,企业会使用一些客户体验指标(Customer eXperience Metrics )来衡量其产品或服务带给客户的体验数据,从而优化不足。
但是,如何在众多选择中挑选最适合的指标,却常常困扰着各大企业。
本指南根据目的和最佳用例分类,分上、中、下三篇,阐释最广泛使用的客户体验指标。
如果您是资深CX专业人士,可以使用此指南来提升业务成果;如果您还是一名小白,本指南可以帮助您制定客户体验计划。
客户体验指标客户体验的三个核心指标是净推荐值(NPS)、客户满意度得分(CSAT)和客户费力度(CES),大多数企业至少会使用其中一个指标衡量客户体验。
1. 净推荐值(NPS)净推荐值(NPS)紧紧围绕着一个问题:“您有多大意愿会把xx 推荐给亲友?”受访者将按意愿程度从0到10进行评分(0表示非常不愿意,10表示非常愿意)。
CustomerThink的一项研究表明,NPS还是客户体验计划中最常用的一项指标,使用频率高达83%。
只需用推荐者的百分比减去贬损者的百分比,就可以得到NPS 得分(%推荐者-%贬损者=NPS)。
在NPS调查中提出一个开放式问题可以让客户阐释评分理由,或分享调查中未涉及的问题,让企业更好地收集体验反馈。
一般来说,NPS得分高于0即为优良企业,高于50即为优秀企业,75及以上则为顶级企业。
如果企业想打造以客户为中心的企业文化,那么使用NPS绝不失为一个好办法。
首先,净推荐值(NPS)是一种关系指标,换言之,它最适用于评估整体客户关系和端到端体验。
净推荐值指标能够有效地衡量客户对企业的整体感受以及客户与企业的关系。
在收集到NPS得分后,企业需要根据各个环节的NPS得分采取行动才能看到改进效果。
比如,如果贬损者经常提及客服及售后等问题,那么您应该让对应的CS部门加入到讨论中来。
其次,企业一方面要想办法与推荐者建立联系。
邀请推荐者分享正面反馈,鼓励推荐者加入客户咨询委员会或定期的客户活动;另一方面,企业不要回避贬损者,而应该听听他们的投诉与建议。
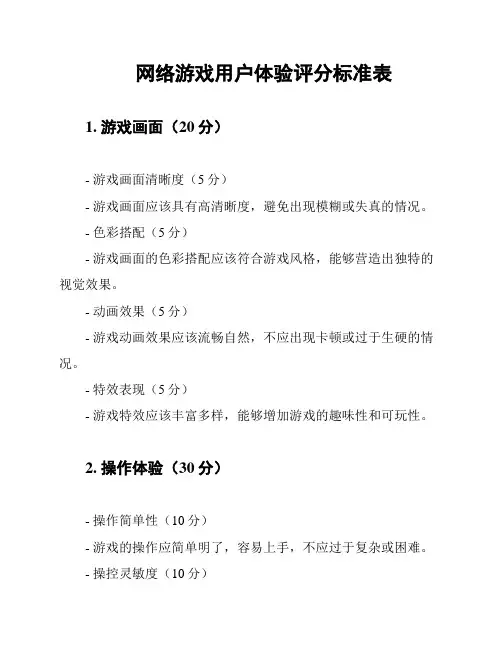
网络游戏用户体验评分标准表1. 游戏画面(20分)- 游戏画面清晰度(5分)- 游戏画面应该具有高清晰度,避免出现模糊或失真的情况。
- 色彩搭配(5分)- 游戏画面的色彩搭配应该符合游戏风格,能够营造出独特的视觉效果。
- 动画效果(5分)- 游戏动画效果应该流畅自然,不应出现卡顿或过于生硬的情况。
- 特效表现(5分)- 游戏特效应该丰富多样,能够增加游戏的趣味性和可玩性。
2. 操作体验(30分)- 操作简单性(10分)- 游戏的操作应简单明了,容易上手,不应过于复杂或困难。
- 操控灵敏度(10分)- 游戏的操控应该灵敏,能够准确地响应玩家的操作。
- 反馈及时性(10分)- 游戏应该及时反馈玩家的操作结果,不应有明显的延迟或卡顿现象。
3. 游戏可玩性(25分)- 游戏目标明确性(8分)- 游戏应该有明确的目标和任务,玩家能够清楚知道自己要做什么。
- 游戏难度适宜性(9分)- 游戏的难度应该适中,既挑战性又不会让玩家过于沮丧。
- 游戏关卡设计(8分)- 游戏的关卡设计应该有足够的变化和挑战性,让玩家保持兴趣并有持续的进步感。
4. 社交互动(15分)- 多人模式(5分)- 游戏应该提供多人模式,让玩家能够与其他玩家进行互动和竞技。
- 好友系统(5分)- 游戏应该有好友系统,让玩家能够和好友一起玩游戏,并互相支持、竞争。
- 社交功能(5分)- 游戏应该提供社交功能,如聊天、分享等,增强玩家之间的交流和合作。
5. 游戏收费(10分)- 免费度(5分)- 游戏应该提供免费的基础服务和玩法,让玩家能够免费体验游戏的核心内容。
- 收费方式(5分)- 游戏的收费方式应该合理公正,不应过度依赖于付费元素影响玩家的游戏体验。
以上是网络游戏用户体验评分标准表,用于评价游戏的画面、操作、可玩性、社交互动和收费情况。
标准表中的每个指标都有不同的分数,评分越高代表游戏在该方面的表现越出色。
希望该评分标准能够帮助游戏开发者提升游戏的用户体验,满足玩家的需求和期望。
网络用户体验满意度调查表个人信息请首先提供一些基本信息。
1. 姓名:2. 年龄:3. 性别:4. 联系方式:问题调查请回答以下问题,选择一个适用的选项或在适当的位置填写相关信息。
1. 您使用网络的频率是:- [ ] 每天多次- [ ] 每天一次- [ ] 每周几次- [ ] 每月几次- [ ] 偶尔使用- [ ] 很少使用2. 您在以下哪些方面使用网络?- [ ] 浏览网页- [ ] 购物- [ ] 社交媒体- [ ] 视频/音频娱乐- [ ] 研究/工作- [ ] 其他(请注明):3. 您使用的主要设备是:- [ ] 电脑- [ ] 手机- [ ] 平板电脑- [ ] 其他(请注明):4. 您认为以下因素中哪些对于网络用户体验至关重要?(可多选)- [ ] 网络速度- [ ] 网站界面设计- [ ] 内容质量- [ ] 用户友好性- [ ] 安全性- [ ] 手机端适配性- [ ] 其他(请注明):5. 您使用过的网络服务商有:- [ ] 中国电信- [ ] 中国移动- [ ] 中国联通- [ ] 其他(请注明):6. 您对目前使用的网络服务商的满意度如何?- [ ] 非常满意- [ ] 满意- [ ] 一般- [ ] 不满意- [ ] 非常不满意7. 您认为网络服务商有哪些需要改进的地方?请提供您的意见或建议。
8. 您的其他意见或建议:感谢您参与此次调查!请将填写完毕的调查表提交给我们。
您的反馈对我们非常重要,感谢您的支持与配合!。
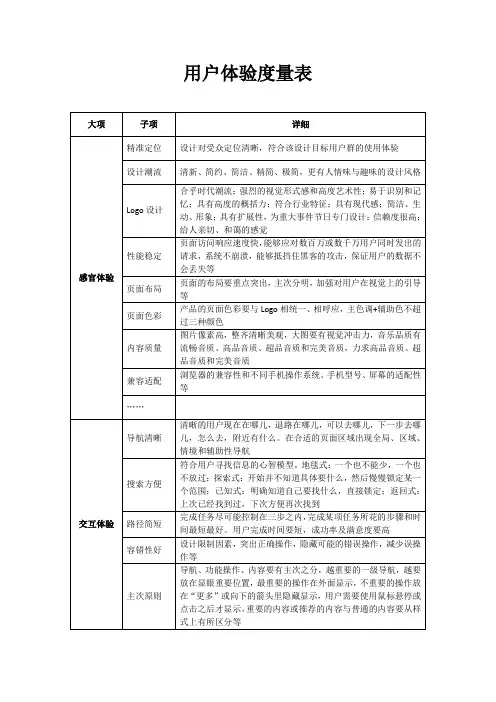
描述分值范围分值网站提供给访客有吸引力的和难忘的体验1~20网站的视觉效果与品牌特征保持一致1~20图像、附加内容和多媒体对于体验的增值1~20网站传达出品牌的感知预示1~20网站利用了媒体的能力来增强和扩展品牌1~20品牌总分0描述分值范围分值网站防止错误发生,并帮用户从错误中恢复1~20整体网页侧重针对主要受众优化1~20网站帮助访问者达成一般目标和任务1~20网站遵循它自己的一致性和标准1~20网站为残疾用户提供内容1~20可用性总分0◦尽可能消除个人偏见(主观因素)◦让不同背景的人(设计人员,开发人员,客户)能够在理解网站上有统一的共识◦创建基准规则,以便于网站与其竞争者或过去的开发努力作比较◦供一个关于网站的优缺点的事实依据和可视化的展示可用性带来的是所有网站元素和特性的总体易用性。
可用性之下的二级主题包括导航和易用性(友好度)(注释:易用性处理的是使在线内容可用于用户的体验,享受和使用的问题)。
可用性的描述:品牌品牌包括在网站中所有审美的、设计相关的项目。
它带给网站想要的组织形象或信息的创意。
用于测量品牌的描述:可用性解网站上有统一的共识作比较内容指的是网站的实际内容(文本,多媒体,图像)及其结看信息和内容是如何按照定义的用户需要和客户的商业需求组织的。
测量内容的描述:内容分值范围分值1~201~201~201~201~200候同时意味着前台公众用户和后台管理员分值范围分值1~201~201~201~201~200及其结构,或信息架构。
我们来客户的商业需求组织的。
测量内容的描。
网站用户体验评分表
介绍
本文档为网站用户体验评分表,旨在评估用户在访问网站时的整体体验。
通过填写以下评分表,我们可以了解用户对网站的满意度,并从中收集反馈,以改进和优化用户体验。
用户体验评分表
使用说明
请根据您的实际体验,在每个评分项后面填写相应的评分,1代表非常不满意,5代表非常满意。
如果您有任何额外的评论或建议,请在“备注”栏中写下。
结论
通过使用本用户体验评分表,我们将能够更好地了解用户对我们网站的感受,并发现差距与改进的空间。
我们将根据评分结果,采取相应的措施来提升用户体验,为用户提供更好的服务。
感谢您参与评分,我们期待您的宝贵反馈!。
游戏行业用户体验度量指标解析在游戏行业中,用户体验度量指标(User Experience Metrics)是评估和监测游戏产品的关键指标之一。
通过对用户体验进行监测和度量,游戏开发者可以了解用户对游戏的满意程度,进而进行优化和改进,提升游戏品质。
本文将解析游戏行业常用的用户体验度量指标,帮助游戏开发者更好地了解和应用这些指标。
一、用户行为数据分析用户行为数据分析是评估游戏用户体验的重要工具之一。
通过分析玩家的行为数据,游戏开发者可以了解玩家在游戏中的表现、行为习惯以及游戏的吸引力等方面的数据。
常用的用户行为数据分析指标包括:1. 留存率(Retention Rate):留存率是指用户在一定时间内持续使用游戏的比例。
较高的留存率表明游戏在保留用户方面表现出色。
2. 流失率(Churn Rate):流失率是指用户在一定时间内停止使用游戏的比例。
较低的流失率表明游戏在留住用户方面做得好。
3. 活跃度(Engagement):活跃度是指用户在游戏中的参与程度。
通过统计玩家的登录频率、游戏时长等数据,可以了解游戏的吸引力和用户参与程度。
二、用户满意度调查用户满意度调查是评估用户体验的常用方法之一。
通过用户满意度调查,游戏开发者可以直接获得用户对游戏的评价和反馈。
常用的用户满意度调查指标包括:1. 游戏评分(Game Ratings):游戏评分是用户对游戏的整体评价,通常以数字分数形式表示。
游戏评分可以作为用户满意度的重要参考指标。
2. 反馈意见(Feedback):通过用户的反馈意见,游戏开发者可以了解用户对游戏的具体问题和改进建议。
这种定性的反馈信息对游戏的优化非常有价值。
三、游戏性能指标游戏性能指标是评估游戏用户体验的重要依据。
游戏性能指标主要关注游戏的流畅性、稳定性以及画面表现等方面。
常用的游戏性能指标包括:1. 帧率(Frame Rate):帧率是指游戏画面在单位时间内显示的帧数。
较高的帧率能够提供更加流畅的游戏体验。