英语考试作文-29日雅思写作考试小作文范文:饼图
- 格式:doc
- 大小:15.03 KB
- 文档页数:3
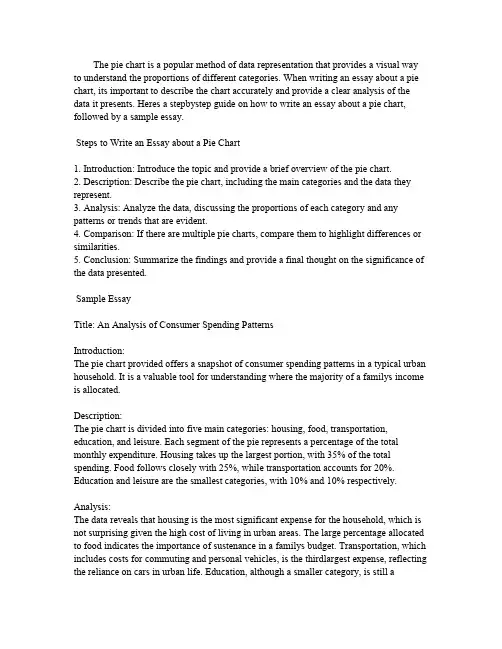
The pie chart is a popular method of data representation that provides a visual way to understand the proportions of different categories.When writing an essay about a pie chart,its important to describe the chart accurately and provide a clear analysis of the data it presents.Heres a stepbystep guide on how to write an essay about a pie chart, followed by a sample essay.Steps to Write an Essay about a Pie Chart1.Introduction:Introduce the topic and provide a brief overview of the pie chart.2.Description:Describe the pie chart,including the main categories and the data they represent.3.Analysis:Analyze the data,discussing the proportions of each category and any patterns or trends that are evident.parison:If there are multiple pie charts,compare them to highlight differences or similarities.5.Conclusion:Summarize the findings and provide a final thought on the significance of the data presented.Sample EssayTitle:An Analysis of Consumer Spending PatternsIntroduction:The pie chart provided offers a snapshot of consumer spending patterns in a typical urban household.It is a valuable tool for understanding where the majority of a familys income is allocated.Description:The pie chart is divided into five main categories:housing,food,transportation, education,and leisure.Each segment of the pie represents a percentage of the total monthly expenditure.Housing takes up the largest portion,with35%of the total spending.Food follows closely with25%,while transportation accounts for20%. Education and leisure are the smallest categories,with10%and10%respectively.Analysis:The data reveals that housing is the most significant expense for the household,which is not surprising given the high cost of living in urban areas.The large percentage allocated to food indicates the importance of sustenance in a familys budget.Transportation,which includes costs for commuting and personal vehicles,is the thirdlargest expense,reflecting the reliance on cars in urban cation,although a smaller category,is still asignificant portion of the budget,highlighting the value placed on stly,the leisure category,which includes entertainment and hobbies,is a smaller but essential part of the familys spending,suggesting a balance between necessities and personal enjoyment.Comparison:If we were to compare this pie chart with one from a rural area or a different country,we might expect to see differences in the proportions allocated to categories like housing and transportation.For instance,housing costs might be lower in rural areas,and transportation might be less of a concern due to the proximity of essential services.Conclusion:In conclusion,the pie chart provides a clear picture of the priorities and spending habits of an urban household.It underscores the importance of housing and food as the primary expenses,with education and leisure also playing a role in the familys budget.This visual representation is a useful tool for financial planning and understanding economic behavior.Remember,when writing about a pie chart,its crucial to be precise with your descriptions and to provide a thorough analysis of the data presented.This will help your readers understand the significance of the information and the insights it can provide.。
雅思小作文饼图范文在雅思小作文中,饼图是一种常见的数据呈现方式。
接下来我们将会给大家提供一篇关于饼图范文的示例,希望能够帮助大家更好地理解和掌握这种写作方式。
饼图范文示例:The pie chart illustrates the proportion of different types of energy production in a certain country in 2018. Overall, it can be seen that the majority of energy production comes from fossil fuels, while renewable energy sources contribute a relatively small portion.Fossil fuels, including coal, natural gas, and oil, accounted for the largest share of energy production at 65%. Among them, oil was the most dominant, making up 35% of the total energy production. Natural gas and coal followed, with 20% and 10% respectively. This indicates that traditional energy sources still play a crucial role in meeting the country's energy demands.In contrast, renewable energy sources only contributed to 20% of the total energy production. Among them, hydroelectric power was the primary source, accounting for 15%. Meanwhile, wind and solar energy made up 3% and 2% respectively. Despite the growing global emphasis on renewable energy, it is clear that in this particular country, the reliance on fossil fuels remains significantly higher.Nuclear energy, on the other hand, made up the remaining 15% of the energy production. This suggests that while it is not as dominant as fossil fuels, nuclear energy still plays a substantial role in the country's energy mix.In conclusion, the pie chart provides a clear overview of the energy production composition in the given country. It highlights the dominance of fossil fuels, the relatively small contribution of renewable energy sources, and the significant role of nuclear energy. This information is crucial for policymakers and stakeholders in making informed decisions about the country's energy future.。
雅思写作-小作文-饼图(精选五篇)第一篇:雅思写作-小作文-饼图雅思考试优秀作文范文:是否禁烟?Version 122 Some people claim that using tobacco has brought severe social problems and smoking should be banned.T o what extent do you agree with theabove statement?Introduction(56 words)Since the discovery of tobacco related to a number of health problems, an increasing number of people have called for prohibiting smoking.It is undeniable that still a considerable amount of smokers exist in this world.I would like to examine the advantages and disadvantages of smoking cigarettes as following and then offer my own opinion.Body1(95words) There are some advantages to taking tobacco.(topic sentence)First, tobacco industry contributes a great proportion of revenue to the nation.Extremely high taxation imposed on tobacco yielding and cigarette manufacturing has released the financial burden for both the government and the individual taxpayergeneration by generation.Second, the soothing effects of smoking has been confirmed by ordinary smokers;particularly those who have hard-brain-working jobs are in favor of it;they claim that smoking cigarettes can make them calm and stimulate brain cells to work more efficiently.Finally, cigarettes play an important role in social activities.Body2(106words)On the other hand, smoking demonstrates numerous negative effects.(topic sentence)Initially, nicotine may bring takers a number of diseases.Second-hand smoking also doesharm to your health.Moreover, hatred from non-smokers always grow against smokers hence some conflicts arise frequently.We then look at the statistics showing that thousands of fire accidents worldwide occur each year due to the litter of non-extinguished cigarette ends, not to mention the related deaths and st but not least, expenses have to be taken into consideration.Fine cigarettes are not cheap.If you get addicted to them, your daily amount of cigarette consumption will increase inevitably, emptying your pocket money.Conclusion(88words) After all, so far no direct evidence has been provided that smoking can definitely result in takers' death of lung cancer, and those fire accidents are the result of carelessness or irresponsibility of the smokers, not tobacco to be laid blames.Also, spending pocket money can never be considered as a financial burden.In addition, I suggest more restricted smoking areas be planned so as not to violate non-smokers' rights.After weighing the pros and cons of using tobacco, I, for one, am against the act to ban smoking.声明:本范文为赖老师专供无忧雅思作品,转载请注明作者和出处!范文仅供参考,切不可背诵,否则可能得非常低的分数,甚至0分。
雅思小作文饼状图英文回答:The pie chart illustrates the percentage of various sources of energy consumed in a particular region during a specific year. The data is presented in a clear and concise manner, with each slice of the pie representing a different energy source.Upon examining the pie chart, it becomes evident that non-renewable energy sources dominate the region's energy consumption. Fossil fuels, including coal, natural gas, and oil, account for a substantial 80% of the total energy usage. This heavy reliance on non-renewable resources highlights the region's dependence on finite energy sources, which raises concerns about future energy security and environmental sustainability.In contrast, renewable energy sources play a relatively minor role in the region's energy mix. Solar and wind powercombined contribute a mere 10% to the total energy consumption. This low percentage suggests a lack of investment in renewable energy infrastructure and a reluctance to transition towards cleaner and more sustainable energy sources.Hydroelectricity stands out as the most significant renewable energy source, accounting for 5% of the region's energy consumption. However, this figure is stillrelatively low compared to the potential hydroelectric resources that the region may possess. The untapped potential of hydroelectricity presents an opportunity for the region to increase its reliance on renewable energy and reduce its dependence on fossil fuels.Overall, the pie chart provides valuable insights into the region's energy consumption patterns. The dominance of non-renewable energy sources raises concerns about the region's long-term energy security and environmental sustainability. The underutilization of renewable energy sources, particularly hydroelectricity, suggests a need for increased investment and a shift towards a more sustainableenergy future.中文回答:此饼状图展示了某个地区在某一年中各种能源消耗所占的百分比。
饼图英语作文3例饼图英语作文范文3例饼图英语作文范文篇一:1.雅思饼图写作范文一饼图写作范文一ThepiechartindicateshowtheU.S.budgetisspentinsixaspectsin cludinghumanresources,generalgovernment,physicalresources,c urrentandpastmilitaryandIraq&Afghanwarsin2004.Moneyspentinhumanresourcesaccountsfor32percentoftheto tal,occupyingthelargestshareinthewholebudget.Thesecondlarge stoneisgiventocurrentmilitarywith27percentofthebudget.Pastmil itaryreceivesmoneytenpercentlessthancurrentmilitary,followedb ygeneralgovernmentwhichconstitutes13percent.Thetwoaspects offeredtheleastmoneyinthebudgetarephysicalresourcesandIraq &Afghanwars,makingup8and3percentrespe(出自::饼图英语作文范文)ctively.Currentmilitary,pastmilitaryandIraq&Afghanwars,ifconsidere dseparately,arenotthelargestmoneyreceiverinthebudget.Thethre easpectsintotal,however,accountfor49percentofthebudget,much higherthanhumanresources,letalonegeneralgovernmentandphys icalresources.FromthechartitcanbeseenclearlythatthemajorityoftheU.S.bu dgetin2004isspentinmilitarywhiletherestisallocatedtohumanreso urces,generalgovernmentandphysicalresources.饼图英语作文范文篇二:雅思小作文饼图范文智课网IELTS备考资料雅思小作文饼图范文摘要:雅思小作文饼图范文。
多个饼图比较雅思小作文各位烤鸭们!今天咱们来唠唠雅思小作文里那种有多个饼图的情况。
这就像是一场饼图大聚会,每个饼图都有自己的小秘密要告诉我们呢。
比如说,我们拿到了三个饼图,分别是关于不同年份一个小镇居民的消费习惯的。
首先呢,咱得先整体扫一眼这几个饼图,看看有没有那种特别突出的部分,就像是人群里那个特别高的大个儿,一眼就能瞧见。
咱们先看第一个饼图,可能会发现住房支出占了最大的一块儿,就像一个大饼里最大的那块儿披萨。
也许有百分之四十呢,这说明啥?这就表示这个小镇的居民把相当大一部分钱都花在住的地方啦,可能这个小镇的房价或者房租不便宜呀。
再看第二个饼图,可能是几年后的情况了。
这时候你发现,哟呵,住房支出那块儿变小了一点,变成了百分之三十五。
而娱乐支出那块儿呢,变大了不少,从之前的百分之十涨到了百分之十五。
这就有点意思了,这可能意味着这个小镇的居民生活水平提高了一点,开始有更多的闲钱去享受生活了,去看个电影啦,唱个K啦之类的。
然后看第三个饼图,情况又有了新变化。
食品支出的占比突然增加了,从原来的百分之二十变成了百分之二十五。
这时候我们就得琢磨琢磨为啥了。
也许是这个小镇新开了好多美食店,各种美味的食物在诱惑居民们的味蕾,让他们忍不住把更多的钱花在吃上了呢。
在比较这些饼图的时候啊,咱们还得注意那些占比一直比较小的部分。
比如说教育支出,在这三个饼图里可能一直都只占百分之五左右,就像个小不点儿。
这可能反映出这个小镇在教育资源方面有一些状况,也许是教育资源比较有限,居民们也没太多钱投入到教育上,或者是这个小镇有一些比较便宜的公立教育体系,不需要居民花太多钱。
而且啊,我们描述的时候可不能干巴巴地只说数字。
比如说“食品支出在第三个饼图里是百分之二十五”,这可太无聊了。
咱们得说“哇塞,你看第三个饼图里,食品支出就像个突然膨胀的小气球,一下子占到了百分之二十五呢,比之前多了不少,感觉这个小镇的居民都变成吃货啦!”另外,我们在比较的时候还可以按照占比的大小顺序来说。
雅思小作文饼图范文下载温馨提示:该文档是我店铺精心编制而成,希望大家下载以后,能够帮助大家解决实际的问题。
文档下载后可定制随意修改,请根据实际需要进行相应的调整和使用,谢谢!并且,本店铺为大家提供各种各样类型的实用资料,如教育随笔、日记赏析、句子摘抄、古诗大全、经典美文、话题作文、工作总结、词语解析、文案摘录、其他资料等等,如想了解不同资料格式和写法,敬请关注!Download tips: This document is carefully compiled by theeditor. I hope that after you download them,they can help yousolve practical problems. The document can be customized andmodified after downloading,please adjust and use it according toactual needs, thank you!In addition, our shop provides you with various types ofpractical materials,such as educational essays, diaryappreciation,sentence excerpts,ancient poems,classic articles,topic composition,work summary,word parsing,copy excerpts,other materials and so on,want to know different data formats andwriting methods,please pay attention!《雅思小作文饼图范文》。
嘿,小朋友们!今天咱们来瞧瞧一个好玩的饼图哟!这个饼图是讲一些动物的数量占比哒。
饼形图英语作文饼形状的图文作文,要想用英语描述出来,需要怎么做呢?下面是店铺给大家整理了饼形图英语写作范文,供大家参阅!饼形图英语作文篇1You should spend about 20 minutes on this task.Write a report for a university lecturer describing the information shown below.You should write at least 150 words.model answer:In this analysis we will examine three pie charts. The first one is headed 'World Spending.' Thesecond is 'World Population' and the third is 'Consumption of Resources.'In the first chart we can see that people spend most of their income (24%) on food. In somecountries this percentage would obviously be much higher. Transport and then housing are thenext major expenses at 18% and 12% respectively. Only 6% of income is spent on clothing.In the second chart entitled 'World Population', it is not surprising to find that 57% of peoplelive in Asia. In fact China and India are two of the most populated countries in the world andthey are both situated on this continent. Europe and the Americans account for nearly 30% ofthe total, whilst 10% of people live in Africa.Finally, the third chart reveals that the USA and Europe consume a huge 60% of the world'sresource.To sum up, the major expenditure is on food, the population figures are the highest for Asiaand the major consumers are the USA and Europe.(182 words)雅思小作文的要点就是理解图或者表想要表达的东西,然后用文字正确的阐述出来即可。
雅思写作饼图小作文满分雅思写作饼图小作文满分范文(通用20篇)饼图写作也是雅思写作常见的作文类型之一。
下面,店铺就为大家送上两篇雅思写作饼图小作文满分范文,希望对大家有用。
雅思写作饼图小作文满分篇1The pie charts compare visitors’ responses to a survey about customer service at the Parkway Hotel in 2005 and in 2010.It is clear that overall customer satisfaction increased considerably from 2005 to 2010. While most hotel guests rated customer service as satisfactory or poor in 2005, a clear majority described the hotel’s service a s good or excellent in 2010.Looking at the positive responses first, in 2005 only 5% of the hotel’s visitors rated its customer service as excellent, but this figure rose to 28% in 2010. Furthermore, while only 14% of guests described customer service in the hotel as good in 2005, almost three times as many people gave this rating five years later.With regard to negative feedback, the proportion of guests who considered the hotel’s customer service to be poor fell from 21% in 2005 to only 12% in 2010. Similarly, the proportion of people who thought customer service was very poor dropped from 15% to only 4% over the 5-year period. Finally, a fall in the number of ‘satisfactory’ ratings in 2010 reflects the fact that more people gave positive responses to the survey in that year. 雅思写作饼图小作文满分篇2The charts compare Korea, Sweden and the UK in terms of the methods used in each country to dispose of harmful waste.It is clear that in both the UK and Sweden, the majority of dangerous waste products are buried underground. By contrast,most hazardous materials in the Republic of Korea are recycled.Looking at the information in more detail, we can see that 82% of the UK’s dangerous waste is put into landfill sites. This disposal technique is used for 55% of the harmful waste in Sweden and only 22% of similar waste in Korea. The latter country recycles 69% of hazardous materials, which is far more than the other two nations.While 25% of Sweden's dangerous waste is recycled, the UK does not recycle at all. Instead, it dumps waste at sea or treats it chemically. These two methods are not employed in Korea or Sweden, which favour incineration for 9% and 20% of dangerous waste respectively.雅思写作饼图小作文满分篇3Dear Sir or Madam,I’m writing in response to the advertisement you placed in Shanghai Daily for the position of overseas mechanical engineer on Mon. Feb.23.I would like to apply for this post. I graduated with a Master’s degree in Machine-Building and Electronics Industries in Tsinghua University in 1999 and began my career in Zhongshan ABB Company as a young mechanical engineer. In 20XX, I was promoted to be the chief engineer, taking charge of the projects in Southeast Asia. I have been seeking for chances overseas in my majored domain in the hope that I can develop my potential further.If possible, I would like to choose a mechanical company with good reputation located in Chicago. I would also prefer small private companies which allow me to enjoy a larger space of promotion.The reason I made the decision above is that my husbandhas recently been relocated to Chicago by his company and I am, therefore, seeking a position in the same area in Chicago.I have enclosed my resume that outlines in detail my qualifications and experience as well as an open letter of recommendation from my former employer.Please give me a feedback at your earliest convenience if my qualifications meet your requirements.I look forward to hearing from you soon.Yours sincerely,Lucy Liu雅思写作饼图小作文满分篇4As a result of constant media attention, sports professionals in my country have become stars and celebrities, and those at the top are paid huge salaries. Just like movie stars, they live extravagantlifestyles with huge houses and cars.Many people find their rewards unfair, especially when comparing these super salaries with those of top surgeons or research scientists, or even leading politicians who have the responsibilityof governing the country. However, sports salaries are not determined by considering the contribution to society a person makes, or the level of responsibility he or she holds. Instead, they reflect the public popularity of sport in general and the level of public support that successful stars can generate. So the notion of ‘fairness’ is not the issue.Those who feel that sp orts stars’ salaries are justified might argue that the number of professionals with real talent are very few, and the money is a recognition of the skills and dedication a person needs to be successful. Competition is constant and a player is tested every time they perform. in their relatively short career. The pressure from the media is intense and there is littleprivacy out of the spotlight. So all of thesefactors may justify the huge earnings.Personally, I think that the amount of money such sports stars make is more justified than the huge earnings of movie stars, but at the same time, it indicatesthat our society places more value on sport than on more essential professions and achievements.译文在媒体不断地推波助澜下,我国的许多职业运动员已成为了明星和名人。

雅思三个饼图作文范文
雅思饼图作文范文(口语化版)。
段落一,聊聊教育支出的那些事儿。
说到教育支出啊,学费可是大头儿,差不多占了一半呢。
这就
说明啊,在咱们现在的教育体系里,学费还是家庭和个人最得掏钱的。
不过呢,课外辅导费也不低,都快三分之一了,这说明家长们
为了孩子的学业和竞争力可是下了血本了。
教材和学习资料虽然比
较稳定,但也占了不小的比例。
其他的像交通、住宿这些费用,虽
然不多,但也是教育支出里不能少的部分。
段落二,大家平时都怎么休闲啊?
说到休闲活动,大家可真是各有各的爱好。
阅读可是个不错的
选择,很多人都喜欢通过阅读来放松和涨知识。
运动也挺受欢迎的,毕竟身体是革命的本钱嘛,大家都挺重视健康的。
不过呢,社交媒
体现在也是大家离不开的了,虽然可能占用的时间不如阅读和运动多,但影响力可不小。
当然啦,还有旅行和其他活动,这些虽然不
常做,但也让大家的休闲生活更加丰富多彩。
段落三,聊聊现在的职业选择。
说到职业选择啊,信息技术这行可是热门得很,基本上占了最
大的份额。
这也难怪,现在可是数字化时代,信息技术发展得飞快,需求也大。
金融服务和教育行业也挺不错的,稳定又有发展前景。
制造业和服务业虽然不如前面几个热门,但也吸引了不少人。
1.步骤①审题,看图②几张饼,几种类(馅)③找最值④特殊数据和比例如25%= quarter2.关键信息①最值:最大,第二,最小②相同值③特殊值如1/2, 1/3, 1/43.动词(占有)Account for; comprise; represent; make up/take up; constitute; contribute4.句型①占据型XX + account for/ make up + the largest/highest/most proportion/percentage of total, which isN%.②拥有型XX + have + the fewest/least proportion/percentage of the chart, at N%.③排序型XX + ranks the first/second, contributing N% of the chart.④被动型the majority/main part of + XXX + made up of XXX5.特殊描述①相同/相似:share equal percentage/trendIt can be seen that / it is noted that A and B share equal percentage, both at N%.比例相近的同时描写respectively/differentlyOnly 30% and 28% Chinese students choose music and art respectively/differently.②倍数5月利润是3月的三倍The profit tripled from March to May.The profit increased by twofold from March to May.There was a twofold increase in the profit from March to MayThe profit in March is tripled as much as in May.Example: 同级比较,占据型,排序型(背下)Asia is the largest continent in the world, over four times as big as Europe. Representing one fifth of the world’s surface area, Africa ranks the second.③百分比A quarter; a third; two third; half双饼图:静态(无关联);动态(有趋势的改变,例如不同年份)1.静态对比和比较(对内和对外),使用1-2次,使用倍数关系,包括相同、不同、极值写法:按图形种类分段对内比较:在段内比,自己比,用关键数据对外比较:在结尾段,彼此比,笼统结合比2.动态结尾段:N年来,XXX的变化(类似线图结尾的变化对比)中间段写法1:两个饼图分别写中间段写法2:将数据转换成线图数据,按增加项、减少向、平稳项分组三饼图:写法1 分别写写法2 按趋势写(同线图)The table compares the difference in the ratio of both males and females who received a diploma in 1993. Obviously, males and females varied considerably in level of education.In 1993, 60% of males graduated with a master’s degree in comparison with 40% of females. When it comes to the ratio of postgraduate diploma, the gap between the males and females become even more significant, the figure of males was more than twice that of females (70% and 30% respectively). In contrast, females outnumbered males in the next two categories. A slightly higher percentage of females at 53% than males at 47% was recorded in the completion of bachelor’s degree. The rise in female rate was also witnessed in the proportion of undergraduate study where females with 65% nearly doubled males with 35%.In conclusion, more males than females received higher degree.段落的描述:美国人民的消费情况In 1996, Americans spent most money on the cars consumption, which was 45%. Restaurant and food shared the same percentages (14%), following the cars. Books accounted for the least proportion of the total, only at 1%.。
饼图英文作文范文英文:Pie charts are a type of graph used to represent datain a circular form. They are commonly used in business, finance, and statistics to show the distribution of a given set of data. Pie charts are particularly useful when trying to compare the proportions of different categories or values.For example, let's say we want to represent the salesof different products in a company. We can use a pie chartto show how much of the total sales each product represents. The size of each slice of the pie represents the proportion of sales for that product. This allows us to easily see which products are the most popular and which ones are not selling as well.Another example of when a pie chart might be useful is when analyzing the budget of a household. We can use a piechart to show the percentage of the budget that is spent on different categories such as housing, food, transportation, and entertainment. This allows us to see where the majority of our money is going and where we might be able to cut back.In conclusion, pie charts are a useful tool for representing data in a visual and easy-to-understand way. They allow us to compare proportions and see patterns that might not be as clear in other types of graphs.中文:饼图是一种用于以圆形形式表示数据的图表类型。
饼图的英语作文中英文
English: A pie chart, also known as a circle chart, is a type of graph that represents data in a circular graph. The circle is divided into sectors, each representing a proportion of the whole. The size of each sector is proportional to the quantity it represents, making it easy to visualize the different proportions. Pie charts are commonly used to show percentages, where the entire circle represents 100%, and each sector represents a different percentage of the total. This type of graph is useful for comparing data at a glance and identifying trends or patterns within the data set.
中文翻译: 饼图,也被称为圆环图,是一种以圆形图表现数据的图表类型。
圆被分为若干个扇形,每个扇形代表了整体的一部分。
每个扇形的大小与其代表的数量成比例,使得不同比例的数据很容易可视化。
饼图常用于展示百分比数据,整个圆代表100%,每个扇形代表总量中的不同百分比。
这种图表类型有助于一目了然地比较数据,并识别数据集中的趋势或模式。
雅思写作小作文范文雅思写作饼状图pie chart 健康饮食今天我们雅思写作小作文范文的文章来研究下饼状图pie chart。
该题目中共出现三张饼图,分别展示了碳水化合物、脂肪以及蛋白质在平均饮食、一般健康饮食、以及运动员健康饮食中所占的比例。
从中可以看出,碳水化合物占得比例越来越大,而蛋白质占得比例越来越小。
小编搜集了一篇相关的考官范文,以供大家参考。
雅思写作小作文题目雅思写作小作文范文The pie charts compare the proportion of carbohydrates, protein, and fat in three different diets, namely an average diet, a healthy diet, and a healthy diet for sport.饼状图比较了三种不同饮食中(平均饮食、健康饮食、以及专为运动员准备的健康饮食)碳水化合物、蛋白质和脂肪所占的比例。
It is noticeable that sports people require a diet comprising a significantly higher proportion of carbohydrates than an average diet or a healthy diet. The average diet contains the lowest percentage of carbohydrates but the highest proportion of protein.很明显,与平均饮食和一般的健康饮食相比,运动员需要的饮食中包含更多的碳水化合物。
平均饮食中的碳水化合物虽然较低,但蛋白质的比例最高。
Carbohydrates make up 60% of the healthy diet for sport. This is 10% higher than the proportion of carbohydrates in a normal healthy diet and 20% more than the proportion in an average diet. On the other hand, people who eat an average diet consume a greater amount of protein (40%) than those who eat a healthy diet (30%) and sportspeople (25%).碳水化合物构成运动员健康饮食的百分之60。
The two graphs show the main sources of energy in the USA in the 1980s and the 1990s.思路:1. 采用折线模式描述2. 注意重点数据的选取(max, min)3. 注意分段原则:一段写上升,一段写下降,一段写保持不变。
答案:The two graphs show that oil was the major energy source in the USA in both 1980 and 1990 and that coal, natural gas and hydroelectric power remained in much the same proportions. On the other hand, there was a dramatic rise in nuclear power, which doubled its percentage over the ten years.Oil supplied the largest percentage of energy, although the percentage decreased from 42% in 1980 to 33% in 1990. Coal in 1990 was the second largest source of energy, increasing its proportion to 27% from 22% in the previous decade. Natural gas, the second largest source in 1980 at 26%, decreased its share very slightly to provide 25% of America’s energy ten years later. There was no change in the percentage supplied by hydroelectric power which remained at 5% of the total energy used. Nuclear power the greatest change: in 1990 it was 10%, twice that of the 1980s.In conclusion, during the decade, the structure of energy resources remained, and the proportion of 3 aspects varied a lot, except natural gas and hydroelectric power.(180)Information on UAE government spending in 2000. The total budget was AED 315 billion.思路:1. 分段原则较为灵活,可以分,也可以不分;2. 注意数据的描述顺序为:从大到小;3. 描述的过程中注意数据的对比:大小关系,倍数关系等;答案:The graph tells us about the budget of the UAE government in 2000. In general, the most important targets were social security, health, and education.The biggest slice of the pie chart is taken up by social security including pensions, employment assistance and other benefits which made up slightly under one-third of total expenditure. Health and personal social services was the second highest budget cost. Hospital and medical services accounted for AED 53 billion, or about 15% of the budget. Education cost UAE AED 38 billion which comprises almost 12% of the whole budget. The government spent about seven percent of revenue on debt, and roughly similar amounts went towards defence (AED 22 billion) and law and order (AED 17 billion). Spending on housing, transport and industry totalled AED 37 billion. Finally, other expenditure accounted for AED 23 billion.All in all, the bulk of UAE government spending goes on social welfare and health. However, education, defence, and law and order are also major areas of spending.(167)3.消费模式The pie charts show changes in U.S. spending patterns between 1966 and 1996.思路:1. 主要采用折线模式,重点描述数据的改变和趋势2. 留意极值(MAX, MIN)的描述3. 分段的原则可为:上升的一段,下降的一段,保持不变的一段。
饼图写作一.饼图Pie Chart的审题过程1. 看文字信息(找出描述对象的谓语的同义词)2. 标题审图标出:中间类/第二大相等/相类似剩余类小的标出:中间类/第二大相等/相类似剩余类小的无变化的/第二大/中间类相等/相类似3. 改写开头段饼图特有本质:The pie chart/graph compares the…….The pie chart/graph shows the comparison ofE.g.:The pie charts shows units of electricity production by fuel source in Australia and France in 1980 and 2000.= The charts compare the source of electricity production by five different sources in Australia and Francein the year 1980 and 2000.二.写作顺序:一个图:(静态描写)先找极端数据的,最大的,再找中间类或第二大的、同类或相类似的,最后看剩余类,即,小的或微不足道的一类的。
两个图:(静态对比描写+ 动态变化描写)1.先写第一个图(静态描述:最大,中间同类,剩余类),再写另一个图,进行对比(动态变化:上升/增长为最大的,下降的为最小,保持不变的或中间类或相等相似类)。
三.饼图写作模板(Body段)一个图:①极端类(最大/多)②中间类(同类/相类似). ③剩余类(小的/微不足道)。
范文E.g.:1.Social skills and education constitute comparatively a majority of their main fields of study, with6.5% and 5.6% respectively, while 2.24%, 1.84% and 2.10% are shared by ad., science and computer.The remaining percentages are in moderation, with 5.53% for science and 7.4% for ads.2.Coal makes up the maximal portion/ the majority of the source/was the biggest instrument of thesources of energy, with 47%, while Nuclear accounted for a tiny share, with only 1%. Furthermore, 28% altogether of the energy was shared by Oil and Hydro. The remaining 24% was due to Natural Gas.结尾1.Through the charts, we can easily draw the conclusion that the new source of energy, particularlyNuclear was given full play while the traditional ones, though still dominant, reached their bottleneck/ceiling to some extent.2.Overall, it is clear that by 2000 these two countries relied on different principal fuel source: Australiarelied on coal and Franc on nuclear power.两个图:一段(静态):①最大的②中间类(同类/相类似). ③剩余类(小的/微不足道)二段(动态):However,①上升/增长为最大的②下降为最小的③保持不变的或中间类或相等相似类)。
英语考试作文
29日雅思写作考试小作文范文:饼图
The pie charts show the class size in primary (elementary) schools in four states in Australia in 2010.
本题属于静态多饼图。
考生在处理该类图形时务必多观察内容之间的关联和对比性。
虽然饼图数目比较多,且每个饼图内的成分也较多,但是一定要沉着冷静,多对比,突出图形的主要特征。
此外,本题的语句表述也比较复杂,在写句子时务必需要搞清楚百分比和班级规模之间的关系。
(百分比指的是百分之多少的小学的班级规模是多少)
经典推荐:考官级口语写作9分范文资料超级大汇总(史无前例数百篇)
真题传送门:2017全年雅思写作真题范文大汇总(第一时间更新)
参考范文:
The pie charts compare the number of pupils in elementary schools in four states of Australia in the year
2010.
It is clear to see that there were 21-25 students having a class in most primary schools ( 51%) in Australian Capital Territory, and the second common class size was 20 students or fewer per class, accounting for 38%. The same situation occurred in Western Australia, and New South Wales whose major elementary school’s class size was 21-25 students per class, taking up 42% and 37% respectively.
On the contrary, 35% of primary schools in South Australia arranged 20 students or fewer in one class, and its figure exceeded the proportion of class size with 21-25 students (33%). In this state, 26-30 students attended classes together in 28% of primary schools, which was almost matched by that in Western Australia; while only 10% of schools in Australian Capital Territory was with that class size. In contrast, it was another general size in New South Wales, with 33%.
Overall, it can be seen that the fewest primary schools in four states had the class size of 30 students or more. However, most of them enrolled 21-25 students in every class
范文原创自小站范钰红老师。