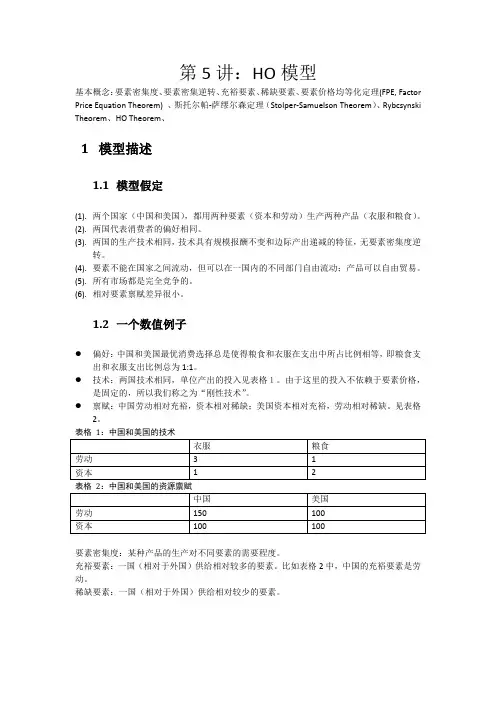
Equipment
Structures
1960 1970 1980 1990 2000 2008 Percentage change, 1960–2008 Annual rate
666.8 1,146.8 1,919.6 2,603.8 4,204.1 5,400.0 +709.8%
+4.4%
2,860.1 3,951.8 5,216.8 6,908.4 8,162.1 9,266.5 +224.0%
Change) Disembodied Technical Change More on Technical Change U.S. Labor Productivity: 1952 I–2010 I
Growth and the Environment and Issues of Sustainability
130
327
3.3
2.5
9 of 20
Sources of Economic Growth
Increase in Physical Capital
TABLE 17.5 Fixed Private Nonresidential Net Capital Stock, 1960–2008 (Billions of 2005 Dollars)
5 of 20
Sources of Economic Growth
aggregate production function A mathematical relationship stating that total GDP (output) depends on the total amount of labor used and the total amount of capital used.