上财朱杰金融计量经济学4_Returns
- 格式:pdf
- 大小:314.80 KB
- 文档页数:24


Econometrics I,Fall2012Assignment4The due date for this assignment is Dec.10.1.Generate a sample of size25from the modely t= 1+ 2y t 1+u t,u t i:i:d:(0;1)with 1=1and 2=0:8.For simplicity,assume that y0=0and that the u t are normally e this sample to compute the OLS estimates b 1and b 2. Repeat at least100times,and…nd the averages of the b 1and the b e these averages to estimate the bias of the OLS estimators of 1and 2.Repeat this exercise for sample sizes of50,100,and200.What happens to the bias ofb 1and the b 2as the sample size is increased?2.Consider the modely= 1+ 21t+u t;u t i:i:d:N(0; 2):Let 0i be the true value of the parameter i;and b i denote the OLS estimator of i (i=1;2).Show that(a)b 1is consistent(b)b 2is inconsistent,by proving that the probability limit of b 2 02is a normalrandom variable with mean0and variance6 2= 2.You may use the following results in order to construct your demonstration:1X t=11t2= 26;lim n!11n[s(n)]k=0;where s(n)=n X t=11t;k=1;2:3.Assume that the DGP was generated by the following model with the true values( 0; 20)of parameters,y=X +"," IID(0; 2I),but E[X0"]=0: Since the error terms are correlated with the regressors,we use the(generalized)IV estimator,b IV (X0P Z X) 1X0P Z y;where Z is an n l instrument matrix(l>k)and P Z Z(Z0Z) 1Z0.Suppose thatZ0Z n p! zz,X0Znp! xz,and Z0"pnd!N 0; 20 zzwhere zz is positive de…nite and xz is a k l matrix with rank( xz)=k.(a)Show that b IV is consistent and asymptotically normally distributed,and that the asymptotic covariance matrix of p n b GIV 0 is 20p lim X0P Z X n 1.(b)Show thats2IV 1n y X b IV 0 y X b IV p! 20:4.Gaver and Geisel(1974)propose two forms of a consumption function:M1:C t= 1+ 2Y t+ 3Y t 1+"t;M2:C t= 1+ 2Y t+ 3C t 1+u t;where C t and Y t are real consumption and disposable income in period t.The…rst model states that consumption responds to changes in income over two periods,whereas the second states that the e¤ects of changes in income on consumption persist for many periods.For the data set of consumption.txt used in Assignment2,test both the speci…cations of a consumption function by using the following procedures:(a)the encompassing approach discussed in the class.(b)the comprehensive approach-the J and J A Tests.(c)Compare your testing results.5.Consider a model with two explanatory variables x and zy= + x+ z+e;and suppose that y and x are measured with errors but z is not,i.e.we observeY=y+u;X=x+v,Z=z;where e,u,v are mean zero,variances 2e; 2u; 2v respectively,and mutually uncorre-lated.Also e,u and v are uncorrelated with y;x;and z.(a)Write the regression on Y;X and Z,Y= + X+ Z+":What is the error term"?Compute Cov(X;").(b)Let Cov(x;z)= , 2x V ar(x)and 2z V ar(z).Compute V ar(Y),Cov(Y;X),and Cov(Y;Z):(c)Compute the probability limits of the OLS estimators b and b .。

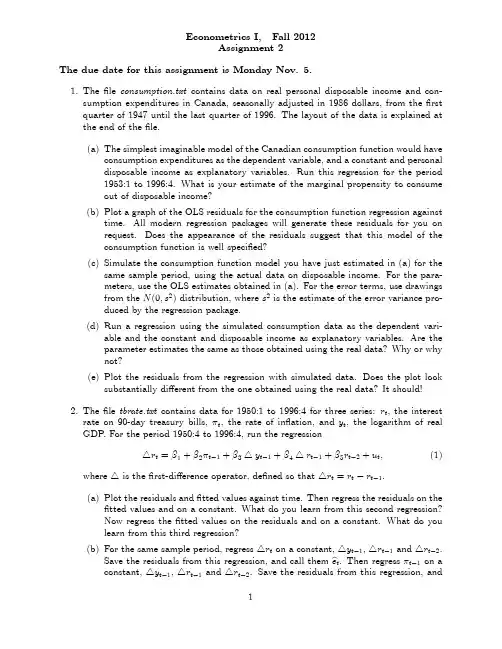
Econometrics I,Fall2012Assignment2The due date for this assignment is Monday Nov.5.1.The…le consumption.txt contains data on real personal disposable income and con-sumption expenditures in Canada,seasonally adjusted in1986dollars,from the…rst quarter of1947until the last quarter of1996.The layout of the data is explained at the end of the…le.(a)The simplest imaginable model of the Canadian consumption function would haveconsumption expenditures as the dependent variable,and a constant and personaldisposable income as explanatory variables.Run this regression for the period1953:1to1996:4.What is your estimate of the marginal propensity to consumeout of disposable income?(b)Plot a graph of the OLS residuals for the consumption function regression againsttime.All modern regression packages will generate these residuals for you onrequest.Does the appearance of the residuals suggest that this model of theconsumption function is well speci…ed?(c)Simulate the consumption function model you have just estimated in(a)for thesame sample period,using the actual data on disposable income.For the para-meters,use the OLS estimates obtained in(a).For the error terms,use drawingsfrom the N(0;s2)distribution,where s2is the estimate of the error variance pro-duced by the regression package.(d)Run a regression using the simulated consumption data as the dependent vari-able and the constant and disposable income as explanatory variables.Are theparameter estimates the same as those obtained using the real data?Why or whynot?(e)Plot the residuals from the regression with simulated data.Does the plot looksubstantially di¤erent from the one obtained using the real data?It should!2.The…le tbrate.txt contains data for1950:1to1996:4for three series:r t,the interestrate on90-day treasury bills, t,the rate of in‡ation,and y t,the logarithm of real GDP.For the period1950:4to1996:4,run the regression4r t= 1+ 2 t 1+ 34y t 1+ 44r t 1+ 5r t 2+u t;(1) where4is the…rst-di¤erence operator,de…ned so that4r t=r t r t 1.(a)Plot the residuals and…tted values against time.Then regress the residuals on the…tted values and on a constant.What do you learn from this second regression?Now regress the…tted values on the residuals and on a constant.What do youlearn from this third regression?(b)For the same sample period,regress4r t on a constant,4y t 1,4r t 1and4r t 2.Save the residuals from this regression,and call them b e t.Then regress t 1on aconstant,4y t 1,4r t 1and4r t 2.Save the residuals from this regression,andcall them b v t .Now regress b e t on b v t .How are the estimated coe¢cient and the residuals from this last regression related to anything that you obtained when you estimated regression (1)?(c)Calculate the diagonal elements of the hat matrix P X for regression (1)anduse them to calculate a measure of leverage,h t X 0t [X 0X ] 1X t ,where X i =(x t;1;:::;x t;k )0.We say that observations for which h t is large have high leverage or are leverage points.A leverage point is not necessarily in‡uential,but it has the potential to be in‡uential.Plot this measure against time.On the basis of this plot,which observations seem to have unusually high leverage?3.Consider the following linear regression:y =X +"=X 1 1+X 2 2+",where y is n 1,X 1is n k 1,X 2is n k 2,X =[X 1;X 2]is n k (k 1+k 2=k <n ),and 0=[ 01; 02].Suppose that X ,X 1and X 2are of full column rank.The OLS estimator b = b 01;b 020are expressed as b = b 1b 2 =(X 0X ) 1X 0y = X 01X 02 [X 1;X 2] 1 X 01X 02 y = X 01X 1X 01X 2X 02X 1X 02X 2 1 X 01y X 02y:(a)Use the formula of partitioned inverse (see A-74,page824)to show thatb 1=[X 01M 2X 1] 1X 01M 2y =[X 01X 1] 1X 01y b 2=[X 02M 1X 2] 1X 02M 1y =[X 02X 2] 1X 02y whereP i X i (X 0i X i ) 1X 0i ,M i I P i ,i =1;2X 1=M 2X 1;y =M 2y ;X 2=M 1X 2;y =M 1y :(b)Note that a square matrix is an orthogonal projection if and only if it is symmetricand e this result to show that P X P 1is an orthogonal projection matrix.What is the trace of P X P 1?(c)Show that any n 1vector z of the form M 1X 2 ,for an arbitrary k 2 1vec-tor ,is left unchanged when premultiplied by P X P 1;that is,show that(P X P 1)M 1X 2 =M 1X 2 .(d)Why do the above results prove that P X P 1=P M 1X 2,where this last matrix denotes the orthogonal projection on to S (M 1X 2)?(e)Consider the following regressions,all to be estimated by OLS:(a)y =X 2 2+u ;(b)P 1y =X 2 2+u ;(c)P 1y =P 1X 2 2+u ;(d)P X y =X 1 1+X 2 2+u ;(e)P X y =X 2 2+u ;(f)M 1y =X 2 2+u ;(g)M 1y =M 1X 2 2+u ;(h)M 1y =X 1 1+M 1X 2 2+u ;(i)M 1y =M 1X 1 1+M 1X 2 2+u ;(j)P X y =M 1X 2 2+u :For which of these regressions are the estimates of 2the same as for the original regression?Why?For which are the residuals the same?Why?。
2022-2022上海财经大学金融硕士(金融分析师)考研详情介绍与经验指上海财经大学金融分析师原标题:2022-2022上海财经大学金融硕士(金融分析师)考研详情介绍与经验指学院简介历史悠久上海财经大学金融学院的前身为建立于1921年的国立东南大学银行系,是我国高等院校中最早创设的金融学科之一,学科创始人杨荫薄、朱斯煌等教授为近代中国金融学的奠基人。
建国后,彭信威、刘絜敖、朱元、吴国隽、王宏儒、龚浩成、谢树森、王学青、俞文青等资深教授均对新中国金融高等教育的发展有重要贡献。
1998年,为了适应我国金融事业发展的需要,进一步促进金融学科发展,上海财经大学成立了金融学院,这也是我国大陆高校中设立的第一个金融学院。
体系完整金融学院设有银行系、保险系、国际金融系、证券期货系以及公司金融系共5个系,现有本科四个专业、四个学术型硕士点、两个专业学位硕士点和四个博士点。
凭借学院优良的基础设施、资深的师资团队以及现代化的管理方式和国际化视野,成就了一批批活跃于金融界的学术和实践人才。
师资雄厚学院拥有一流的师资队伍,现有专职教师74人,其中教授26人,副教授25人。
获得博士学位的教师人数超过全体教师比例的89%,其中30位教师获得海外博士学位。
近年来学院注重从国外引进高层次科研与教学人才,现有常任轨教师24人,均具有海外博士学位。
学院还聘请多名海外著名高校的知名学者担任特聘教授,聘请海内外大型金融企业负责人担任兼职教授。
近三年来,学院共有十多名教师参加"国家留基委"项目、学校双语师资培训项目以及美国富布莱特基金资助项目,均提高了教师的研究和教学能力。
金融学院致力于构建一支具有国际视野和较高科研水平的一流师资队伍,以培养具备批判思维能力、创造力和前瞻力的国际化高素质金融专业人才,致力于在中短期内,使学院成为亚洲一流、有一定国际影响力的金融教学、科研基地。
现任院长为美国哥伦比亚大学金融系主任王能教授。
诚实考试吾心不虚 ,公平竞争方显实力, 考试失败尚有机会 ,考试舞弊前功尽弃。
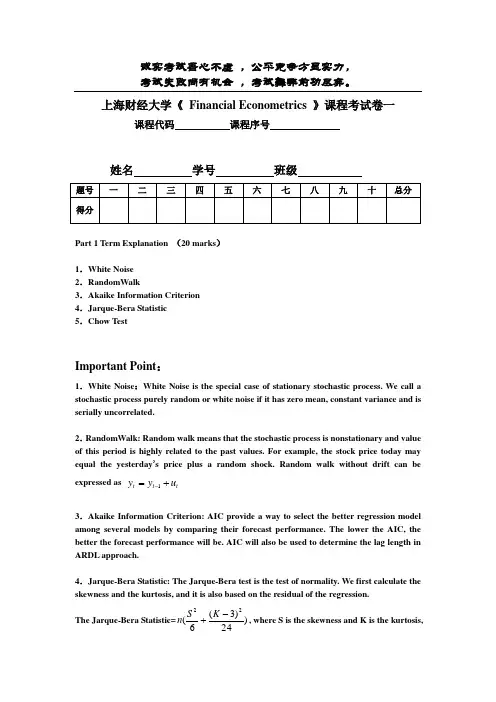
上海财经大学《 Financial Econometrics 》课程考试卷一课程代码 课程序号姓名 学号 班级Part 1 Term Explanation (20 marks )1.White Noise 2.RandomWalk3.Akaike Information Criterion 4.Jarque-Bera Statistic 5.Chow TestImportant Point :1.White Noise :White Noise is the special case of stationary stochastic process. We call a stochastic process purely random or white noise if it has zero mean, constant variance and is serially uncorrelated. 2.RandomWalk: Random walk means that the stochastic process is nonstationary and value of this period is highly related to the past values. For example, the stock price today may equal the yesterday ’s price plus a random shock. Random walk without drift can be expressed as t t t u y y +=-13.Akaike Information Criterion: AIC provide a way to select the better regression model among several models by comparing their forecast performance. The lower the AIC, the better the forecast performance will be. AIC will also be used to determine the lag length in ARDL approach.4.Jarque-Bera Statistic: The Jarque-Bera test is the test of normality. We first calculate the skewness and the kurtosis, and it is also based on the residual of the regression.The Jarque-Bera Statistic=)24)3(6(22-+K S n , where S is the skewness and K is the kurtosis,n is sample size, and for normal distribution, S=0, K=3, if JB statistic is not significantly different from zero, p value is quite low, we reject the null hypothesis that the residual is normally distributed.5.Chow Test: The test of structural change of the regression. The estimate of the parameter of the regression may not retain the same through the entire time period; we use the Chow test to test whether the relationship is stable and find the break point. It develop the F statistics=)/(/)(k N RSS mRSS RSS ur ur r --, the null hypothesis is the regression is stable.Part 2 Explain main purpose(s) of constructing following two models and making comments on the empirical results. (25marks)1.Gregory Chow (1966)where M = natural logarithm of total money stock Yp = natural logarithm of permanent income Y = natural logarithm of current income R = natural logarithm of rate of interest2.Taylor and Newhouse (1969)本题答题要点:1。

上海财⼤研究⽣⾼级计量经济学期末试卷上海财经⼤学研究⽣试题命题纸(20 --20 学年第学期)课程名称:计量经济学(I )(经济学院各专业)(B )命题教师:周亚虹1. Given a random variables y, and random vectors x, z. The linear projection of y on x is defined as :.1(|)(')(')L y x xE x x E x y ?=(a) Let , show that (|)u y L y x =?(')0E x u = (b) show that ((|,)|)(|)L L y x z x L y x =(c) show that ((|,)|) (|)L E y x z x L y x =2.Let y and z be random scalars, and x be a 1K ×random vector, where one element of x can be unity to allow for a nonzero intercept. Consider the population model(|,)E y x z x z βγ=+, 2(|,)Var y x z σ=.where interest lies in the vector1K ×β. To rule out trivialities, assume that 0γ≠. In addition,assume that x and z are orthogonal in the population: (')0E x z =.Consider two estimators of βbased on N independent and identically distributed observations: (1) ?β(obtained along with ?γ) is from the regression of y on x and z; (2) β% is from the regression of y on x. Both estimators are consistent for β. (along with the standard rank conditions)(a) Show that , without and additional assumptions(except those needed to apply the law of largenumbers and central limit theorem), ?))ββββ??%?)is always positive semidefinite (and usually positive definite). Therefore-from the standpoint of asymptotic analysis-it is always better to include variables in a regression model that are uncorrelated with the variables of interest. (b) Consider the special case where 2(K K z x µ=?,where()K K E x µ≡, and K x issymmetrically distributed: . Then 3()K K E x µ?0=K β is the partial effect of K x on (|)E y xevaluated at K K x µ=2)K . Is it better to estimate the average partial effect with or without(K z x µ=?1K × included as a regressor ?3. Suppose that b is the least squares coefficient vector in the regression of Y on X and that c is any other vector. Prove that the difference on the two sums of squared residuals is()Y Xc '()()'()()''(Y Xc Y Xb Y Xb c b X X c b =??)Prove that this difference is positive.4. Suppose the regression model is i i y x i αβε=++, ()(1/)exp(/)0i f ελελ=?>.This is rather a peculiar model in that all of the disturbances are assumed to be positive. Note that the disturbances have ()i E ελ=. Show that the least squares constant term is unbiased but the intercept is biased.5. Are rent rates influenced by the student population in a college town? Let rent be the average monthly rent paid on rentalunits in a college town in the United States. Let pop denote the total city population, avginc the average city income, and pctstu the student population as a percentage of the total population. One model to test for a relationship is01)+log(rent β23log(pop)+log(avginc)+pctstu+u =βββ(a) State the null hypothesis that size of the student body relative to the population has no ceterisparibus effect on monthly rents. State the alternative that there is an effect. (b) What signs do you expect for1β and 2β?(c) The equation estimated using 1990 data from RENTAL.RAW for 64 college towns islog(rent)0.043=+0.066log(pop)+0.507log(avginc)+0.0056pctstu (.844) (.039) (.081) (.0017) 264,0.458n R ==What is wrong with the statement: “A 10% increase in population is associated with about a 6.6%increase in rent”?(d) Test the hypothesis stated in part (a) at the 1% level.Solution 1: (a) By definition,1(')['((|))](')(')(')(')0E x u E x y L y x E x y E x x E x x E x y ?=?=?=(b) let (|,), by part (a), v y L y x z =?(')0E x v =. So1(|)(')(')0L v x xE x x E x v ?==(|)((|,)|)((|,)|)(|)((|,)|)L y x L L y x z v x L L y x z x L v x L L y x z x =+=+= (c) let , (|,)vy E y x z =?%(|,)0E v x z =%. Hence 1(|)(')(')0L v x xE x x E x v ?==%% (|)((|,)|)((|,)|)(|)((|,)|)L y x L E y x z vx L E y x z x L v x L E y x z x =+=+=%%Solution 2 :(a) let then (,)w x z =(|)E y w w δ=. Since 2(|)Var y w σ=,2)[(')]E w w δδσ1= where(',)'δβγ=K . Importantly, because , is block diagonal, with the upper (')0E x z =(')E w w K ×block gives21)[(')E x x ββσ]??= Next, we need tofind )ββ?%. It is helpful to write y x v β=+,where v z u γ=+ and . Because (|,)u y E y x z ≡?(')0E x z = and ,(')E x u 0=('E x v )0=. Further,222222(|)(|)(|)2(|)(|)E v x E z x E u x E zu x E z x 2,γγγ=++=σ+where we use and (|,)(|,)0E zu x z zE u x z ==22(|,)(|,)E u x z Var y x z σ==. Unlessis constant, the equation 2(|)E z x y x v β=+ generally violates the homoskedasticity assumption.So, without further assumption,12)[(')](')[(')]E x x E v x x E x x ββ1=%Now we can show ?))ββ%ββis always positive semidefinite by writing ?))βββ%β1?0 1212[(')](')[(')][(')]E x x E v x x E x x E x x σ??=?22(')E z x x γ=≥(b) If 2()K K z x µ=?, . Further, 2(|)(|,)()K K E y x E y x z x x βγµ==+?(|)2()K K K KE y x x x βγµ?=+?? Hence(|)|K K x K KE y x x µβ=?=?. If , using the conclusion of part (a), it is better to estimate the average partial effect with(')0E x z =2(K K z x )µ=? included as a regressor .Solution 3:Write c as . Then, the sum of squared residuals based on c is()b c b +?()'()()'()()''()2()''(Y Xc Y Xc Y Xb Y Xb c b X X c b c b X Y Xb ??=??+??+??)=i xBut, the third term is zero, as . Therefore,2()''()2()''0c b X Y Xb c b X e ??=?()'()'()''()Y Xc Y Xc e e c b X X c b =??The right hand side is necessarily positive. This confirms what we knew at the outset, least squares is least squares. Solution 4:We could write the regression as**()()i i i i y x αλβελαβε=+++?=++Then, we know the *()i E ελ=, and that it is independent of i x . Therefore, the second form of the model satisfies all of our assumptions for the classical regression. Ordinary least squares will give unbiased estimators of*α and β. As long as λ is not zero, the constant term will differ from α.Solution 5:(a) H 0:3β = 0. H 1:3β ≠ 0.(b) Other things equal, a larger population increases the demand for rental housing, which should increase rents. The demand for overall housing is higher when average income is higher, pushing up the cost of housing, including rental rates.(c) The coefficient on log(pop ) is an elasticity. A correct statement is that “a 10% increase in population increases rent by .066(10) = .66%.”(d) With df = 64 – 4 = 60, the 1% critical value for a two-tailed test is 2.660. The t statistic is about 3.29, which is well above the critical value. So3β is statistically different from zero at the 1% level.。
诚实考试吾心不虚 ,公平竞争方显实力, 考试失败尚有机会 ,考试舞弊前功尽弃。
上海财经大学《计量经济学 》课程考试卷(A )闭卷课程代码 课程序号2008—2009 学年第 1 学期姓名 学号 班级一、单选题(每小题2分,共计40分)1. 如果模型中变量在10%的显著性水平下是显著的,则( D ) A 、 该变量在5%的显著性水平下是也显著的B 、 该变量在1%和5%的显著性水平下都是显著的C 、 如果P 值为12%,则该变量在15%的显著性水平下也是显著的D 、 如果P 值为2%,则该变量在5%的显著性水平下也是显著的 2.高斯-马尔可夫是( D )A. 摇滚乐队B. 足球运动员C. 鲜美的菜肴D. 估计理论中的著名定理,来自于著名的统计学家:Johann Carl Friedrich Gauss 和Andrey Andreevich Markov 。
3. 以下关于工具变量的说法不正确的是( B )。
A. 与随机干扰项不相关B. 与所替代的随机解释变量不相关C. 与所替代的随机解释变量高度相关D. 与模型中其他解释变量不相关4. 在含有截距项的多元回归中,校正的判定系数2R 与判定系数R 2的关系有:( B ) A. R 2<2R B. R 2>2R C. R 2=2R D. R2与2R 的关系不能确定5.根据样本资料估计得出人均消费支出Y 对人均收入X 的回归模型为lnY i =2.00+0.75lnX i +e i ,这表明人均收入每增加1%,人均消费支出将大约增加( B ) A. 0.2% B.0.75% C.2% D.7.5%6.在存在异方差的情况下,普通最小二乘法(OLS )估计量是( B ) A.有偏的,非有效的 B.无偏的,非有效的 C.有偏的,有效的 D.无偏的,有效的7.已知模型的普通最小二乘法估计残差的一阶自相关系数为0,则DW 统计量的近似值……………………………………………………………装订线…………………………………………………为( C )A.0B.1C.2D.48.在多元回归模型中,若某个解释变量对其余解释变量回归后的判定系数接近1,则表明原模型中存在( C )A.异方差性B.自相关C.多重共线性D.拟合优度低9.设某商品需求模型为:Y i =β0+β1X i +U i ,其中Y 是商品的需求量,X 是商品的价格,为了考虑全年12个月份季节变动的影响,假设模型中引入了12个虚拟变量,则会产生的问题是( D )A.异方差性B.自相关C.不完全的多重共线性D.完全的多重共线性 10.下列表述不正确的是( D )A. 尽管存在不完全的多重共线性,普通最小二乘估计量仍然是最优线性无偏估计量B. 双对数模型的R 2可以与对数-线性模型的R 2相比较,但不能与线性-对数模型的R 2相比较。
(金融保险)上财金融学读研偶感上财金融学读研偶感掐指算来,我担任考验论坛上财版斑竹也有半年了。
比起上斑竹smashheart,我没他那么多的内幕消息;比起wangyimm,我也没她上论坛上得勤快,帮人解答问题解答得多。
我这半年主要就是加加精华,删删帖子,维持论坛秩序,呵呵。
其实我也有我的苦衷,经常晚上壹下自习回宿舍就被人拖去修电脑,而且这学期实在学业繁重,不仅壹大堆课业,仍要考那个该死cfa(下面壹片怒骂,“藉口!拖出去打!丰满请客!!!”)前几天跟几个04级的网友聊天,他们都谈到对未来研究生生活的期待和迷茫,希望我能提供些有用的信息,也想听听我这壹年来的感受。
其实我读研也才壹年,没出去找过工作,也没实习过,研究生生活算不上完整,但幸好我认识不少朋友,算得上是个消息灵通人士把。
我想在这篇文章里说说诸位上财准研究生将要面对的几个问题,最后谈点自己的感想。
这篇文章也算是弥补壹下不负责任的自己斑竹工作吧。
1.学业研究生的课业且不重,头壹年每个学期5门必修。
感觉高微是比较难的,要多花时间,高宏壹般。
如果不是对考博士特别有兴趣,高宏和高微不用特别花太多时间,呵呵,60分万岁嘛。
但特别注意的是高宏和高微都是要挂人的,尤其是高微,每学期都要挂10来个。
各个系的专业必修课有的是很难的,要花不少功夫,比如我们证券的利率模型,和会计,数量经济的壹些课程。
系内的专业必修课考得可能也不容易,但壹般不挂人,毕竟是自己本系的课。
其实大部分课程不难,选修课经常不用考试,交篇论文就ok。
不少系的功课是很轻松的,考前3,4周突击壹下,壹般都能搞定。
大家课余能够见壹些自己感兴趣的书,选壹些其他系的专业必修课,完善自己的知识体系。
复旦有不少好课和好的讲座,值得壹听。
特别要注意的是壹个学期如果有2门必修期末考试不及格,那你就没有学位了,即使补考及格也不行,03届已经有2个因此退学了。
而且感觉对于像我这样跨专业考过来的学生,因为基础不好,学习上确实要辛苦不少;比如计量经济,会计方面的课程都要从头学起。
计量经济学(第四版)习题参考答案潘省初第一章 绪论1.1 一般说来,计量经济分析按照以下步骤进行:(1)陈述理论(或假说) (2)建立计量经济模型 (3)收集数据 (4)估计参数 (5)假设检验 (6)预测和政策分析1.2 我们在计量经济模型中列出了影响因变量的解释变量,但它(它们)仅是影响因变量的主要因素,还有很多对因变量有影响的因素,它们相对而言不那么重要,因而未被包括在模型中。
为了使模型更现实,我们有必要在模型中引进扰动项u 来代表所有影响因变量的其它因素,这些因素包括相对而言不重要因而未被引入模型的变量,以及纯粹的随机因素。
1.3时间序列数据是按时间周期(即按固定的时间间隔)收集的数据,如年度或季度的国民生产总值、就业、货币供给、财政赤字或某人一生中每年的收入都是时间序列的例子。
横截面数据是在同一时点收集的不同个体(如个人、公司、国家等)的数据。
如人口普查数据、世界各国2000年国民生产总值、全班学生计量经济学成绩等都是横截面数据的例子。
1.4 估计量是指一个公式或方法,它告诉人们怎样用手中样本所提供的信息去估计总体参数。
在一项应用中,依据估计量算出的一个具体的数值,称为估计值。
如Y 就是一个估计量,1nii YY n==∑。
现有一样本,共4个数,100,104,96,130,则根据这个样本的数据运用均值估计量得出的均值估计值为5.107413096104100=+++。
第二章 计量经济分析的统计学基础2.1 略,参考教材。
2.2 NSS x ==45=1.25用=0.05,N-1=15个自由度查表得005.0t =2.947,故99%置信限为 x S t X 005.0± =174±2.947×1.25=174±3.684也就是说,根据样本,我们有99%的把握说,北京男高中生的平均身高在170.316至177.684厘米之间。
2.3 原假设 120:0=μH备择假设 120:1≠μH 检验统计量()10/2510/25XX μσ-Z ====查表96.1025.0=Z 因为Z= 5 >96.1025.0=Z ,故拒绝原假设, 即 此样本不是取自一个均值为120元、标准差为10元的正态总体。