外文翻译
- 格式:doc
- 大小:35.00 KB
- 文档页数:7

本科毕业论文外文翻译外文译文题目:不确定条件下生产线平衡:鲁棒优化模型和最优解解法学院:机械自动化专业:工业工程学号: 201003166045学生姓名: 宋倩指导教师:潘莉日期: 二○一四年五月Assembly line balancing under uncertainty: Robust optimization modelsand exact solution methodÖncü Hazır , Alexandre DolguiComputers &Industrial Engineering,2013,65:261–267不确定条件下生产线平衡:鲁棒优化模型和最优解解法安库·汉泽,亚历山大·多桂计算机与工业工程,2013,65:261–267摘要这项研究涉及在不确定条件下的生产线平衡,并提出两个鲁棒优化模型。
假设了不确定性区间运行的时间。
该方法提出了生成线设计方法,使其免受混乱的破坏。
基于分解的算法开发出来并与增强策略结合起来解决大规模优化实例.该算法的效率已被测试,实验结果也已经发表。
本文的理论贡献在于文中提出的模型和基于分解的精确算法的开发.另外,基于我们的算法设计出的基于不确定性整合的生产线的产出率会更高,因此也更具有实际意义。
此外,这是一个在装配线平衡问题上的开创性工作,并应该作为一个决策支持系统的基础。
关键字:装配线平衡;不确定性; 鲁棒优化;组合优化;精确算法1.简介装配线就是包括一系列在车间中进行连续操作的生产系统。
零部件依次向下移动直到完工。
它们通常被使用在高效地生产大量地标准件的工业行业之中。
在这方面,建模和解决生产线平衡问题也鉴于工业对于效率的追求变得日益重要。
生产线平衡处理的是分配作业到工作站来优化一些预定义的目标函数。
那些定义操作顺序的优先关系都是要被考虑的,同时也要对能力或基于成本的目标函数进行优化。
就生产(绍尔,1999)产品型号的数量来说,装配线可分为三类:单一模型(SALBP),混合模型(MALBP)和多模式(MMALBP)。

Strengths优势All these private sector banks hold strong position on CRM part, they have professional, dedicated and well-trained employees.所以这些私人银行在客户管理部分都持支持态度,他们拥有专业的、细致的、训练有素的员工。
Private sector banks offer a wide range of banking and financial products and financial services to corporate and retail customers through a variety of delivery channels such as ATMs, Internet-banking, mobile-banking, etc. 私有银行通过许多传递通道(如自动取款机、网上银行、手机银行等)提供大范围的银行和金融产品、金融服务进行合作并向客户零售。
The area could be Investment management banking, life and non-life insurance, venture capital and asset management, retail loans such as home loans, personal loans, educational loans, car loans, consumer durable loans, credit cards, etc. 涉及的领域包括投资管理银行、生命和非生命保险、风险投资与资产管理、零售贷款(如家庭贷款、个人贷款、教育贷款、汽车贷款、耐用消费品贷款、信用卡等)。
Private sector banks focus on customization of products that are designed to meet the specific needs of customers. 私人银行主要致力于为一些特殊需求的客户进行设计和产品定制。

因为学校对毕业论文中的外文翻译并无规定,为统一起见,特做以下要求:1、每篇字数为1500字左右,共两篇;2、每篇由两部分组成:译文+原文.3 附件中是一篇范本,具体字号、字体已标注。
外文翻译(包含原文)(宋体四号加粗)外文翻译一(宋体四号加粗)作者:(宋体小四号加粗)Kim Mee Hyun Director, Policy Research & Development Team,Korean Film Council(小四号)出处:(宋体小四号加粗)Korean Cinema from Origins to Renaissance(P358~P340) 韩国电影的发展及前景(标题:宋体四号加粗)1996~现在数量上的增长(正文:宋体小四)在过去的十年间,韩国电影经历了难以置信的增长。
上个世纪60年代,韩国电影迅速崛起,然而很快便陷入停滞状态,直到90年代以后,韩国电影又重新进入繁盛时期。
在这个时期,韩国电影在数量上并没有大幅的增长,但多部电影的观影人数达到了上千万人次。
1996年,韩国本土电影的市场占有量只有23.1%。
但是到了1998年,市场占有量增长到35。
8%,到2001年更是达到了50%。
虽然从1996年开始,韩国电影一直处在不断上升的过程中,但是直到1999年姜帝圭导演的《生死谍变》的成功才诞生了韩国电影的又一个高峰。
虽然《生死谍变》创造了韩国电影史上的最高电影票房纪录,但是1999年以后最高票房纪录几乎每年都会被刷新。
当人们都在津津乐道所谓的“韩国大片”时,2000年朴赞郁导演的《共同警备区JSA》和2001年郭暻泽导演的《朋友》均成功刷新了韩国电影最高票房纪录.2003年康佑硕导演的《实尾岛》和2004年姜帝圭导演的又一部力作《太极旗飘扬》开创了观影人数上千万人次的时代。
姜帝圭和康佑硕导演在韩国电影票房史上扮演了十分重要的角色。
从1993年的《特警冤家》到2003年的《实尾岛》,康佑硕导演了多部成功的电影。
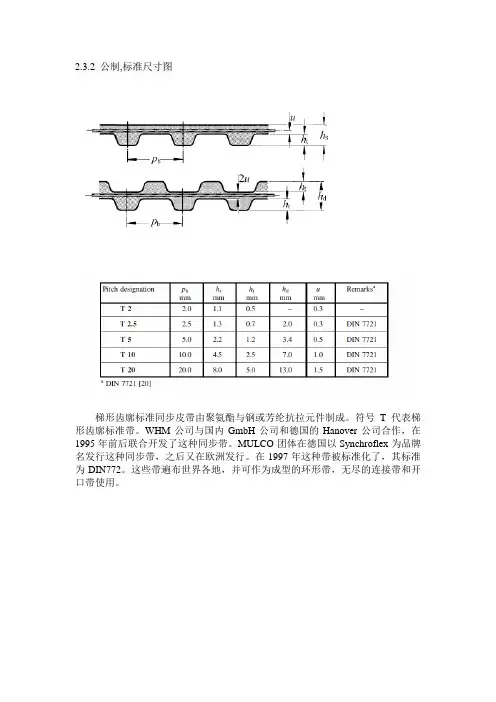
2.3.2 公制,标准尺寸图梯形齿廓标准同步皮带由聚氨酯与钢或芳纶抗拉元件制成。
符号T代表梯形齿廓标准带。
WHM公司与国内GmbH公司和德国的Hanover公司合作,在1995年前后联合开发了这种同步带。
MULCO团体在德国以Synchroflex为品牌名发行这种同步带,之后又在欧洲发行。
在1997年这种带被标准化了,其标准为DIN772。
这些带遍布世界各地,并可作为成型的环形带,无尽的连接带和开口带使用。
具有梯形齿廓和公制标准尺寸,AT同步带是T型同步带的一个发展。
它们由由聚氨酯与钢或芳纶抗拉元件制成。
与T型同步带先比,AT型同步带有更宽的齿形截面和更强的抗拉构件。
AT型同步带一个特殊的特点是带齿齿隙紧靠带轮槽底座。
德国的MULCO和Hanover公司开发了这种类型的同步带,并在1980年左右以Synchroflex为品牌发行了这种带。
这些带遍布世界各地,并可作为成型的环形带,无尽的连接带和开口带使用。
这些带ISO 13050 标准用符号H表示,也被称为HTD同步带。
HTD代表大扭矩驱动。
这种同步带是由氯丁橡胶与玻璃纤维抗拉元件和聚酰胺纤维织物制成,并由在1973年引领美国市场的Gates公司开发。
曲齿的几何形状是圆形,较大的齿高显然增加了齿承载能力和抗牙跳能力。
这种带在世界各地都可以看到,许多制造商都参与它的生产。
它们也用聚氨酯,任选与钢丝帘线或芳纶抗拉元件制造。
用户可以从无尽的成型带,开口带和连续挤压环形带中选择使用。
这些带ISO 13050 标准用符号R表示,也被称为RPP同步带。
RPP代表橡胶抛物线。
1985年意大利的公司开发了这种双抛物线齿廓的同步带,他们是由氯丁橡胶与玻璃纤维抗拉元件和聚酰胺纤维织物制成。
这种类型的同步带主要发行在欧洲南部,许多制造商都参与它们的生产。
它们也用聚氨酯,任选钢丝帘线或芳纶抗拉元件制造。
用户可以从无尽的成型带,开口带和连续挤压环形带中选择使用。
这些带ISO 13050 标准用符号S表示,也被称为STD同步带。

外文文献原稿和译文原稿logistics distribution center location factors:(1) the goods distribution and quantity. This is the distribution center and distribution of the object, such as goods source and the future of distribution, history and current and future forecast and development, etc. Distribution center should as far as possible and producer form in the area and distribution short optimization. The quantity of goods is along with the growth of the size distribution and constant growth. Goods higher growth rate, the more demand distribution center location is reasonable and reducing conveying process unnecessary waste.(2) transportation conditions. The location of logistics distribution center should be close to the transportation hub, and to form the logistics distribution center in the process of a proper nodes. In the conditional, distribution center should be as close to the railway station, port and highway.(3) land conditions. Logistics distribution center covers an area of land in increasingly expensive problem today is more and more important. Is the use of the existing land or land again? Land price? Whether to conform to the requirements of the plan for the government, and so on, in the construction distribution center have considered.(4) commodities flow. Enterprise production of consumer goods as the population shift and change, should according to enterprise's better distribution system positioning. Meanwhile, industrial products market will transfer change, in order to determine the raw materials and semi-finished products of commodities such as change of flow in the location of logistics distribution center should be considered when the flow of the specific conditions of the relevant goods.(5) other factors. Such as labor, transportation and service convenience degree, investment restrictions, etc.How to reduce logistics cost,enhance the adaptive capacity and strain capacity of distribution center is a key research question of agricultural product logistics distribution center.At present,most of the research on logistics cost concentrates off theoretical analysis of direct factors of logistics cost, and solves the problem of over-high logistics Cost mainly by direct channel solution.This research stresses on the view of how to loeate distribution center, analyzes the influence of locating distribution center on logistics cost.and finds one kind of simple and easy location method by carrying on the location analysis of distribution center through computer modeling and the application of Exeel.So the location of agricultural product logistics distribution center can be achieved scientifically and reasonably, which will attain the goal of reducing logistics cost, and have a decision.making support function to the logisties facilities and planning of agricultural product.The agricultural product logistics distribution center deals with dozens and even hundreds of clients every day, and transactions are made in high-frequency. If the distribution center is far away from other distribution points,the moving and transporting of materials and the collecting of operational data is inconvenient and costly. costly.The modernization of agricultural product logistics s distribution center is a complex engineering system,not only involves logistics technology, information technology, but also logistics management ideas and its methods,in particular the specifying of strategic location and business model is essential for the constructing of distribution center. How to reduce logistics cost,enhance the adaptive capacity and strain capacity of distribution center is a key research question of agricultural product logistics distribution center. The so—called logistics costs refers to the expenditure summation of manpower, material and financial resources in the moving process of the goods.such as loading and unloading,conveying,transport,storage,circulating,processing, information processing and other segments. In a word。

车床用于车外圆、端面和镗孔等加工的机床称作车床。
车削很少在其他种类的机床上进行,因为其他机床都不能像车床那样方便地进行车削加工。
由于车床除了用于车外圆还能用于镗孔、车端面、钻孔和铰孔,车床的多功能性可以使工件在一次定位安装中完成多种加工。
这就是在生产中普遍使用各种车床比其他种类的机床都要多的原因。
两千多年前就已经有了车床。
现代车床可以追溯到大约1797年,那时亨利•莫德斯利发明了一种具有把主轴和丝杆的车床。
这种车床可以控制工具的机械进给。
这位聪明的英国人还发明了一种把主轴和丝杆相连接的变速装置,这样就可以切削螺纹。
车床的主要部件:床身、主轴箱组件、尾架组件、拖板组、变速齿轮箱、丝杆和光杆。
床身是车床的基础件。
它通常是由经过充分正火或时效处理的灰铸铁或者球墨铸铁制成,它是一个坚固的刚性框架,所有其他主要部件都安装在床身上。
通常在球墨铸铁制成,它是一个坚固的刚性框架,所有其他主要部件都安装在床身上。
通常在床身上面有内外两组平行的导轨。
一些制造厂生产的四个导轨都采用倒“V”,而另一些制造厂则将倒“V”形导轨和平面导轨结合。
由于其他的部件要安装在导轨上并(或)在导轨上移动,导轨要经过精密加工,以保证其装配精度。
同样地,在操作中应该小心,以避免损伤导轨。
导轨上的任何误差,常常会使整个机床的精度遭到破坏。
大多数现代车床的导轨要进行表面淬火处理。
以减少磨损和擦伤,具有更大的耐磨性。
主轴箱安装在床身一端内导轨的固定位置上。
它提供动力。
使工件在各种速度下旋转。
它基本上由一个安装在精密轴承中的空心轴和一系列变速齿轮---类似于卡车变速箱所组成,通过变速齿轮,主轴可以在许多中转速的旋转。
大多数车床有8~18中转速,一般按等比级数排列。
在现代车床上只需扳动2~4个手柄,就能得到全部挡位的转速。
目前发展的趋势是通过电气的或机械的装置进行无级变速。
由于车床的精度在很大程度上取决于主轴,因此主轴的结构尺寸较大,通常安装在紧密配合的重型圆锤滚子轴承或球轴承中。
IntroductionLatvian legislation for forest protection belts Latvian legislation demands that forest protection belts are established around all cities and towns. The concept of protection belts originates from the Soviet Era and is maintained in Latvian legislation despite the radical changes to the political system after regaining indepen-dence in 1991. The legal background for the establish-ment of protection belts is as follows:•Law on Protection Belts (1997, 2002)•Forest Law (2000)•Law on Planning of Territorial Development (1998).Designating a greenbelt around the city of Riga, LatviaJanis DonisLatvian State Forestry Research Institute ‘Silava’, Salaspils, LatviaAbstract: Latvian legislation demands that forest protection belts are established around all cities and towns. The main goal of a protection belt is to provide suitable opportuni-ties for recreation to urban dwellers and to minimise any negative impacts caused by urban areas on the surrounding environment. Legislation states the main principles to be adopted, which include the maximum area of protection belts, their integration in terri-torial development plans and restrictions placed on forest management activities. The largest part of the forest area around Riga is owned by the municipality of Riga, which, as a result, has two competing interests: to satisfy the recreational needs of the inhabitants of Riga, and to maximise the income from its property. In order to compile sufficient background information to solve this problem, the Board of Forests of Riga Municipality initiated the preparation of a proposal for the designation of a new protection belt.The proposal was based on the development and application of a theoretical framework developed during the 1980s. The analysis of the recreational value of the forest (5 class-es of attractiveness) was carried out based on categories of forest type, dominant tree species, dominant age, stand density, distance from urban areas and the presence of at-tractive objects. Information was derived from forest inventory databases, digital forest maps and topographic maps. Additional information was digitised and processed using ArcView GIS 3.2. Local foresters were asked about the recreation factors unique to differ-ent locations, such as the number of visitors and the main recreation activities. From a recreational point of view and taking into account legal restrictions and development plans for the Riga region, it was proposed to create three types of zones in the forest: a protection belt, visually sensitive areas and non-restricted areas.Key words:greenbelt forest, recreational value, GIS, zoningThe Law on Protection Belts states that protection belts around cities (with forests as part of a green zone)have to be established (a) to provide suitable conditions for recreation and the improvement of the health of urban dwellers, and (b) to minimise the negative im-pact of urban areas on the surrounding environment.Urban For.Urban Green.2 (2003):031–0391618-8667/03/02/01-031 $ 15.00/0Address for correspondence:Latvian State Forestry Re-search Institute ‘Silava’, Rı¯gas iela 111, Salaspils, LV-2169,Latvia. E-mail: donis@silava.lv© Urban & Fischer Verlaghttp://www.urbanfischer.de/journals/ufugRegulation nr 263 (19.06.2001) on the ‘Methodology for the establishment of forest protection belts around towns’issued by the Cabinet of Ministers (CM) states: (a) The area of a protection belt depends on the numberof inhabitants in the town: towns with up to 10,000 inhabitants should have a maximum of 100 ha of protection belt, those with between 10,000 and 100,000 inhabitants a maximum of 1,500 ha, and towns with more than 100,000 inhabitants a maxi-mum of 15,000 ha;(b) the borders of protection belts have to be able to beidentifiable on the ground, using features such as roads, ditches, power lines, and so forth;(c) protection belts have to be recorded in the territorialplans of regions adjacent to the town or city; and (d) establishment of protection belts has to be agreedupon by local municipalities.According to law, protection belts should be man-aged using adapted silvicultural measures. Clear-cut-ting, for example, is prohibited in a protection belt to mitigate any negative impacts of the city on the sur-rounding environment. The Forest Law of 2000 and subsequent regulations including the Regulation on Cutting of Trees, and the Regulation on Nature Conser-vation in Forestry define clear-cuts as felled areas larg-er than 0.1 ha where the basal area is reduced below a critical level in one year. These regulations also state the permitted intensity and periodicity of selective cut-ting (30–50%, at least 5 years between entries).The third element of the legal framework relevant for protection belts in Latvia is the Law on Planning of Territorial Development (1998). It defines:(a) Principles and responsibilities of the different or-ganisations involved;(b) the contents of territorial plans;(c) the procedures for public hearing; and(d) the procedures for the acceptance of plans.The law also states that protection belts around towns have to be designated in territorial plans. Thus, the legislation gives very detailed descriptions of the restrictions to maximum area, activities and guidelines for delineation and so forth, while there are no ‘rules’for the choice of what areas are to be included in pro-tection belts. It is up to territorial planners to propose what areas to include and for negotiation among mu-nicipalities to approve the selection.Protection belt for the city of RigaRiga and the Riga region are situated in the Coastal Lowland of Latvia within the Gulf of Riga. The main landform types are the Baltic Ice Lake plain, the Litto-rina Sea plain and the Limnoglacial plain and bog plain. The total area of the administrative area of the City of Riga covers 307.2 km2, and that of the Riga re-gion 3,059 km2. In 2000 the city of Riga had 815,000 inhabitants, while an additional 145,000 people resided in the greater Riga region. During the last decade the number of inhabitants in Riga decreased by 10.5%and in Riga region by 5.3%. In the mid-1990s the main types of industry in Riga were food processing, timber and wood processing, metal fabricating and engineer-ing, while in the region agriculture and forestry, wood processing, pharmaceuticals, and the power industry were the main activities. Due to reduced industrial ac-tivities today, the main sources of pollution in Riga re-gion are road transport and households.The greater part of the Riga region is covered by for-est, i.e. 1,642 km2or 53%. About 26% of the land is used for agriculture, 4% is covered by bogs, and 4% by water. The Riga region also has a coastal dune zone of some 30 km along the Gulf of Riga. The main tree species to be found in the Riga region are Scots pine (Pinus sylvestris L.),birch (Betula spp.) and Norway spruce (Picea abies (L.) Karsten) (see Table 1). In the administrative area of the city of Riga, 57 km2 or about 19% of the land area is forest. Scots pine is the domi-nant species, covering approx. 46.9 km2(i.e. 88% of the total forest area).According to the legislation described before, a pro-tection belt around Riga city, with a maximum size of 15,000 ha, could be designated. Moreover, any propos-al has to be agreed upon among 24 local municipalities. The Riga region is divided into 24 administrative units: 7 towns and 17 pagasts or ‘parishes’.Riga municipality currently owns more than 55,600 ha of forests. Most are situated in the vicinity of Riga. Four forest administrative districts lie completely with-in Riga region and close to Riga city (see Fig. 1). The total area of these districts is 44,158 ha out of which forest stands cover 36,064 ha (82%). Thus the Riga municipality forests of those 4 districts cover only 17% of the total forest area of the Region. The dominant tree species in the municipally owned forests are Scots32J.Donis:Designating a greenbelt around the city of Riga,LatviaUrban For.Urban Green.2 (2003)Table 1.Tree species composition in the Riga region Dominant tree Area covered, ha Average age, years species––––––––––––––––––––––––––––––––––––––––––––––––––––––––––––––––––––––––––––––Total Municipa-Total Municipa-lity*lity* Scots pine95,27627,3718581 Norway spruce20,8493,0175139Birch30,5585,1246056 Other10,438552––Total157,12136,0647369*Data only for the 4 forest districts of the Riga city munici-pality that are entirely situated within the Riga region.pine, birch and Norway spruce. These cover 76%, re-spectively 14% and 8% of the forest area. Other species cover less than 2% of the area.Until the re-establishment of Latvian independence almost all forestland was owned by the state but since then many areas have been returned to their former owners and are now privately owned. Current regula-tions state that until the designation of new boundaries for protection belts has been agreed upon, all forests of the previously existing and protected green zone have to remain protected whatever their functional role or ownership status. Consequently almost all forests of the Riga municipality located in the Riga region have management restrictions placed on them, and the same can be said for forests of other owners within the previ-ously existing green zone. Currently, therefore, on the one hand significant recreation opportunities for urban dwellers are provided, while on the other hand forest owners’rights to obtain income from timber harvest in the suburban areas continue to be restricted. Suburban municipalities also lose income because of reduced land taxes from land with management restrictions.The board of Forests of the Municipality of Riga there-fore initiated the preparation of a proposal to designate a new protection belt.Study to support protection belt designation The main objective of the study presented here has been to obtain background information in preparation for further discussions with local municipalities. Stud-ies in Latvia as well as elsewhere have revealed that recreational values of forests depend mainly on forest characteristics, location and level of pollution (Emsis et al. 1979; Emsis 1989; Holgen et al. 2000; Lindhagen & Hörnsten 2000; Rieps ˇas 1994; Su ¯na 1973, 1979). A very important aspect is the distance to the forest from places where people live (e.g. Rieps ˇas 1994). The abil-ity of a forest stand to purify the air by filtering or ab-sorbing dust, micro-organisms, and noxious gases de-pends on tree and shrub species composition, age, tree size and stand density (Emsis 1989). Stands purify the air most effectively at the time of maximum current an-nual volume increment, usually between 30 to 60 years of age in Latvian conditions, depending on species.Recreational value, on the other hand, increases with age (and tree size) and reaches its maximum consider-ably later. Taking into account the peculiarities of the dispersal of pollution as described by Laivin ‚s ˇ et al.(1993) and Za ¯lı¯tis (1993), selective cutting is prefer-able in the vicinity of a pollution source, especially ifJ.Donis:Designating a greenbelt around the city of Riga,Latvia 33Urban For.Urban Green.2 (2003)Fig. 1.Location ofthe Riga municipali-ty forests in the Riga region.the forest consists of a narrow strip between the pollu-tion source and housing. If the distance between a pol-lution source and housing exceeds several kilometres, a patch clear-cut system with stands of different ages is sufficient to provide a reduction in the negative impact of urban areas. Taking into account the fact that closer to residential areas it is more important to consider the visual qualities of the forest (e.g. Tyrväinen et al. 2003), this purification ability can generally be ignored when planning protection belts.MethodsThis study to support the designating of the Riga pro-tection belt used the following data sources for analysis (see Fig. 2): forest inventory databases, digital forest maps of the Riga municipal forests which are situated outside the administrative borders of the city (55,600 ha of which 44,158 ha located in the Riga region) (see Fig. 1), and corresponding topographic maps.The study and its developed proposal are based on an application of a theoretical approach developed during the 1980s by the Latvian State Forestry Research Insti-tute ‘Silava’(Emsis 1989) and the Lithuanian Forestry Research Institute (Riepsˇas 1994). According to the methodology developed by Emsis (1989), the first step in the process is to evaluate the recreational potential of the forest stands. This is carried out by analysing the following factors:• The tolerance of the forest ecosystem to different lev-els of anthropogenic (recreation) loading;• the status of forest ecosystems in terms of the damage or degradation as a result of recreational use;•the suitability of the landscape for non-utilitarian recreation (recreational value); and• the existing and potential levels of recreational loads.The second step involves evaluating the existing andexpected functional roles of the forest.The tolerance of the forest ecosystem to different levels of anthropogenic impact or loading is evaluated using a framework based on a combination of forest type, dominant tree species, dominant age group, soil type and relief, according to the stability of ecosystem. All stands are classified into one of five tolerance classes. The highest score is given to mature deciduous forests on mesotrophic and mesic soils on flat topogra-phy, while the lowest score is given to young pine stands on oligotrophic soils on steep slopes (forests on dunes).In this study ecosystem tolerance could not be evalu-ated, as it was primarily a desk using existing databas-es, and topographic relief maps were not available in digital form. The status of the forest ecosystem in rela-tion to damage or degradation was evaluated in terms of the degree of change in vegetation cover, under-growth, tree root exposure of the and level of littering, classified into three classes.Assessment of the recreational value of the forest stands was calculated using a formula developed by Riepsˇas (1994):Recreational value VR= (VS*kW*kS+VA)*kPWhere VSis stand suitability based on key internal at-tributes of the stand, such as species, age, stand densityand forest type. VSvalues range from 0 for young, high-density grey alder (Alnus incana L.) on wet peat soils, to 100 for average density mature pine stands ondry mineral soils. kwis a coefficient depending on the distance of the stand from watercourses, ranging from0.1 for stands further than 2 km from watercourses to1.0 for stands up to 500 m from watercourses. kSis a coefficient depending on the distance of the stand from urban areas, ranging from 0.1 for stands further than34J.Donis:Designating a greenbelt around the city of Riga,LatviaUrban For.Urban Green.2 (2003)Fig. 2.Structure of data sources used in data ana-lysis.80 km from Riga to 1.0 for stands within 30 km ofRiga. VA is an additional value depending on the pres-ence of attractive features, for example, 25 for forest stands up to 500 m from settlements, including summer cottages, or for areas intensively used for recreation ac-cording to information of local foresters. kP is a coeffi-cient depending on the level of environmental pollu-tion. Its value is 0 if the actual pollution level exceeds limit values, 0.5 if the level of environment pollution is between 50% and 100% of limit values, and 1 if the level of actual pollution is less than 50% of the limit values. In this study a coefficient of 1.0 was used, be-cause SO2and O3concentrations measured by Rigabackground measuring stations did not exceed 50% of the limit values (Fammler et al. 2000).The division of stands into classes of stand suitabili-ty is based on studies of visitors’preferences. Coeffi-cients kw, ksand VAare based on visitors’spatial distri-bution and show the ratio of the number of visitors in different zones. The evaluation of existing and expect-ed recreational loads was carried out by local foresters. They marked existing and potential recreation places on forest maps, including:•Small areas or sites for activities such as swimming, barbecuing, and so forth.•Recreation territories, defined as areas of 20 ha or more where people stay longer periods for walking, jogging, skiing or other forms of both active and pas-sive recreation.•Traditionally popular places for the collection of berries and mushrooms.•Recreational routes, including routes from public transport stops to recreation sites or recreation terri-tories, and between recreation sites and territories. For each recreation site and recreation territory data on the main seasons of use, the periods of use (week-days, weekends), and the average number of people in ‘rush-hours’during good weather conditions was col-lected or estimated.Data processing was carried out using ArcView GIS3.2a, Visual Fox pro and Microsoft Excel. VS values foreach stand were calculated from information in the for-est database using Visual Fox pro. Information collect-ed at a later stage from local foresters was digitised using separate themes (layers) in ArcView GIS 3.2a. Buffer zones along watercourses and water bodies, as well as residential areas, recreation sites and territoriesand recreation routes were created to get kW ,kSand VAvalues for each stand. Then VR values were calculatedfor each stand.A selection of recreation sites and territories was vis-ited by members of the project team in order to evalu-ate the state of the ecosystem with respect to wear and tear arising from different levels of recreational use. An evaluation of the existing functional role of each forest stand was carried out using the existing categories offorest protection. The anticipated future functional role was evaluated by annalysing the recreational value of stands, known expectations in terms of territorial de-velopment, and existing legal restrictions in order to find a compromise between recreation possibilities and other services of the forest. Next, a first draft of the protection belt was drawn according to experts’judge-ment. This draft included forests with high recreational value adjacent to residential areas and summer cot-tages, and larger tracts intensively used for recreation with medium to high recreational value.ResultsAccording to the original forest classification 65% of the total forest land area was designated as a commer-cial greenbelt forest, for which the main management goals are timber production and environmental consid-erations. The remaining 35% were designated as pro-tected (see Table 2). With regards to protected areas in Latvia: the main management goals of nature parks are nature conservation and recreation, including some ed-ucation. The goal for nature reserves is nature conser-vation, while that of the protected greenbelt forests is recreation.While interviewing local foresters it was revealed that they find it difficult to evaluate dispersed recreation loads (for example collection of berries, mushrooms). The assessments of foresters varied greatly and were considered to be unreliable. It was therefore decided to map only the places important for recreation, but not to use the inaccurate estimates of visitor numbers.In Latvia, special investigations have to be carried out in order to develop management objectives and principles for protected forests as part of the preparation of management plans. Pilot studies and visits to some of the recreation areas have revealed that the evaluation of the state of the forest ecosystem is useful only when de-veloping the detailed management plan. Even then, this is only the case for places identified by local foresters as recreation sites or territories, because otherwise it is too time consuming to carry out fieldwork which provides little useful additional information.Calculated VSvalues show that on average the forests studied have a medium suitability value for recreation (average score 47) (see Table 2). There are considerable differences between districts, with aver-age value ranging from 32 points in Olaine to 66 points in the Garkalne district. This indicates that the average stands in the Garkalne district are more suitable for recreation than those in other districts. If other aspects are taken into account, such as distance from wherepeople live, and VRvalues are calculated it can be seenJ.Donis:Designating a greenbelt around the city of Riga,Latvia35Urban For.Urban Green.2 (2003)that the districts are still ranked as follows: Garkalne,Jugla, Tireli and Olaine.Only 10% of the forest owned by Riga municipality within the Riga region were evaluated as having a high or very high recreational value. 12% had medium recreational value, while large areas used for the col-lection of berries and mushrooms were evaluated as having low or very low recreational value (60% of the total forest area) (see Table 3).More than 16% of the area is covered by bogs, for which according to the used methodology, recreational value was not evaluated at all. Some areas were recorded by the local foresters as important places for the collec-tion of berries. However, more valuable from a recre-ational point of view were those forests situated east and north-east of the city (Garkalne and Jugla districts),while the forests to the south (Olaine and Tireli districts)were found to have a lower recreational value (V R ).36J.Donis:Designating a greenbelt around the city of Riga,LatviaUrban For.Urban Green.2 (2003)Table 2.Distribution of forest by forest categories according to the original functional role Forest districtDataFormer forest category Total–––––––––––––––––––––––––––––––––––––––––––––––––––––––––––––––––––––––––––––––––––––––––––––––––––––––––––––––––––––––––––––––––––––––––––––––Commercial Nature Nature Protected greenbelt forests parks reserves greenbelt forestsGarkalneArea, ha521.27,698.78,219.9Average of V S *61.966.566.2Average of V R **59.350.751.4JuglaArea, ha 8,376.74,098.812,475.4Average of V S 45.656.949.1Average of V R 22.034.025.7OlaineArea, ha 11,765.4707.512,473.0Average of V S 31.941.032.6Average of V R 8.527.410.0TireliArea, ha 8,689.5257.91,025.01,016.910,989.3Average of V S 40.666.710.059.342.3Average of V R 17.055.3 1.044.920.6TotalArea, ha 28,831.6779.11,025.013,522.044,157.6Average of V S 39.863.510.061.647.1Average of V R16.357.91.043.725.9* V S Suitability value – based on stand parameters (0–100 points).** V R Recreation value (0–125 points) based on stand parameters, distance to the residential areas, water and other attractive objects.Table 3.Distribution of forest areas by classes of attractiveness and by designated functional role Designated zoneDataClass of attractiveness Total –––––––––––––––––––––––––––––––––––––––––––––––––––––––––––––––––––––––––––––––––––––––––––––––––––––––––––––––––––––––––––––––––––––––––––––––––––––––n.a.Very low Low Medium High Very high 0<2525,1–5051–7575–100100<Protection belt Area, ha76.7560.12,266.42,222.7850.5743.66719.9Average of V R *0.012.036.063.390.0125.053.4Visually sensitive Area, ha 447.64,150.54,157.7853.4847.1179.810636.1Average of V R 0.07.837.460.996.7125.028.5Non-restricted Area, ha 6,664.715,389.12,548.61,090.5874.8234.026801.7Average of V R 0.0 5.234.761.197.2125.015.8TotalArea, ha 7,189.020,099.88,972.74,166.52,572.31,157.344157.6Average of V R0.06.236.362.294.6125.025.9*V R Recreation value (0–125 points) based on stand parameters, distance to the residential areas, water and other attractive objects.Areas along main roads and railways are known to be visually sensitive, because of the large number of peo-ple who can see them during travel. The same is true for forest in the vicinity of small villages. Taking into ac-count the fact that legislation prohibits clear-cuts in pro-tection belts – which is not always necessary in order to maintain the visual quality of the landscape – it was proposed, as part of the zoning strategy, to create so called visually sensitive areas. In these areas the forest owner (Riga municipality) is recommended to use more detailed landscape-planning techniques and to pay more attention to visual aspects during management.As a result of the study, seen from a recreational point of view and taking into account legal restrictions and so forth, it has been proposed to create three zoning categories: (1) protection belts, (2) visually-sensitive areas, and (3) non-restricted areas (see Fig. 3). The protection belt should include:• Forest with high recreational value adjacent to residen-tial areas and summer cottages, to form a 200–500 m wide belt.• Larger tracts of forestland intensively used for recre-ation.The zone of visually-sensitive areas should include:• Forests within the administrative borders of Riga mu-nicipality and in the vicinity of villages (up to 200–500 m distance).• Forests along roads of national and regional impor-tance, railways, watercourses and streams as a protec-tion belt of 100–300 m wide.• Places used for mushroom and berry collection in the original restricted protection belt.• Places that could become important for recreation in the near future.J.Donis:Designating a greenbelt around the city of Riga,Latvia 37Urban For.Urban Green.2 (2003)Table 4.Proposed distribution of forest categories in designated zones (in hectares)Designated zoneFormer forest category Grand Total––––––––––––––––––––––––––––––––––––––––––––––––––––––––––––––––––––––––––––––––––––––––––––––––––––––––––––––––––––––––––––––––––––––––––––––––––––––––––––––––––Commercial Nature Nature Protected greenbelt forests parks reserves greenbelt forests Protection belt355.2779.15,585.76,719.9Visually sensitive areas 3,503.97,132.110,636.1Non-restricted areas 24,972.51,025.0*804.226,801.7Total 28,831.6779.11,025.013,522.044,157.6*Forests within nature reserves are not intended for recreation; their primary management goal is nature conservation.Fig. 3.Proposal for zon-ing of the Riga municipalforests in Riga region.The remaining areas should consequently be classi-fied as non-restricted areas.A revision of the first draft plan was made taking into account the known prospective development plans of Riga and Riga region. As a result, for forests owned by Riga municipality and located in Riga region the pro-posal is to include 6,720 ha in the protection belt (see Table 3). Moreover, it has been suggested to designate 10,636 ha as visually-sensitive areas, but to omit the re-maining 26,802 ha from zoning, as these do not need special management from a recreation point of view. Average recreational values of stands in this area range from 53 (medium), through 28 (low) to 15 points (very low) respectively.As a result, the major part of the forest remains in the same functional category as in the original allocation (see Table 4). As was mentioned above, the classifica-tion described here is only based on recreational as-pects, thus forests in nature reserves are misleadingly shown as non-restricted forests. Only 5,586 ha out of the 13,500 thousand ha of the originally protected greenbelt forests are proposed to be included in the protection belt, while 355 ha of the previous commer-cial greenbelt forests are proposed to be placed under stronger protection.DiscussionForests owned by Riga municipality within the Riga re-gion are divided over 13 rural municipalities. Accord-ing to legislation, revised draft proposals for zoning Riga city forests have to be accepted by Riga munici-pality, while the final decision is up to Riga and the sur-rounding municipalities. The study presented here has provided a tentative estimate of the recreational value and suitability of the forests for recreation and can be used as a starting point for political discussions. At the very beginning the intention was to divide the forests in two categories: the protection belt and the remainder of the forest. During the study it was concluded, however, that a third category would be needed, that of visually sensitive areas. Within this category more attention would have to be paid to the amenity of the landscape, but there would be no need to drastically restrict com-mercial forest management. As nature parks are also designated for recreation, it has been proposed to in-clude all forests of nature parks in the protection belt. It has to be noted that all the forests within the adminis-trative borders of cities, and as such not included in this study, are designated as protected. As a consequence, the forest area available for recreation to the inhabi-tants of Riga would increase to 12,500 ha.Unlike many other European cities, where timber ex-traction is of small importance (Konijnendijk 1999),Riga municipal forests have a considerable economic role. It is estimated that the allowable annual cut in suburban forests amounts to 169,800 m3or 81% of the annual increment (Dubrovskis et al. 2002). It should be kept in mind that income from logging is used for for-est regeneration and tending, forest fire protection and maintenance of recreation facilities.The objective of this study was not to evaluate the precision of the method nor possible errors occurring when applying it. This study revealed, however, the in-completeness of the methodology used. Bogs, which are very sensitive to recreation loads, are ascribed quite a high level of attractiveness from a recreation point of view (for the collection of wild berries), but according to the methodology they are not evaluated at all. All watercourses were assumed to be attractive sites, while the preliminary evaluation of recreation loads showed this not to be true. The use of watercourses is very vari-able and obviously depends on water quality and vege-tation structure of the edges or banks. Another aspect which was not taken into account was that amenity of a forest is not simply the sum of the amenity values of forest stands (Pukkala et al. 1995).It seems that the evaluation based on dominant species is appropriate for screening areas, but for more detailed management plans, species mixture, the number of forest layers, and principles of landscape architecture also have to be taken into account (Bell 1999; Bell & Nikodemus 2000). Various studies have shown that people prefer uneven-aged forests (e.g. Melluma et al. 1982) and uneven-aged stands (e.g. Riepsˇas 1994). The impacts of the screening effect show that there are, even in the visually-sensitive and commercial zones, considerable areas with high and very high recreational value. This is mainly because delineation of zonal boundaries is carried out using easily distinguishable natural lines, and often it is not worth including single stands of high recreational value in the protection belt if, as a consequence, re-strictions on management would be placed over whole compartments of 50 ha.For the preparation of specific management guide-lines detailed field inventories have to be carried out. This has not been done in this study, where more re-liance was placed on the experience of local foresters and existing databases. Detailed economical calcula-tions have yet to be carried out in order to evaluate the direct and indirect value of the forest. These will also assist in obtaining more background information to be used as part of a holistic approach and for development of a decision support system to resolve contradictions between different interest groups.After acceptance of the draft plan by the municipali-ty of Riga, the process of negotiation between Riga and its surrounding municipalities is currently ongoing.38J.Donis:Designating a greenbelt around the city of Riga,Latvia Urban For.Urban Green.2 (2003)。

计算机外⽂翻译(完整)毕业设计(论⽂)外⽂资料翻译专业:计算机科学与技术姓名:王成明学号:06120186外⽂出处:The History of the Internet附件: 1.外⽂原⽂ 2.外⽂资料翻译译⽂;附件1:外⽂原⽂The History of the InternetThe Beginning - ARPAnetThe Internet started as a project by the US government. The object of the project was to create a means of communications between long distance points, in the event of a nation wide emergency or, more specifically, nuclear war. The project was called ARPAnet, and it is what the Internet started as. Funded specifically for military communication, the engineers responsible for ARPANet had no idea of the possibilities of an "Internet."By definition, an 'Internet' is four or more computers connected by a network.ARPAnet achieved its network by using a protocol called TCP/IP. The basics around this protocol was that if information sent over a network failed to get through on one route, it would find another route to work with, as well as establishing a means for one computer to "talk" to another computer, regardless of whether it was a PC or a Macintosh.By the 80's ARPAnet, just years away from becoming the more well known Internet, had 200 computers. The Defense Department, satisfied with ARPAnets results, decided to fully adopt it into service, and connected many military computers and resources into the network. ARPAnet then had 562 computers on its network. By the year 1984, it had over 1000 computers on its network.In 1986 ARPAnet (supposedly) shut down, but only the organization shut down, and the existing networks still existed between the more than 1000 computers. It shut down due to a failied link up with NSF, who wanted to connect its 5 countywide super computers into ARPAnet.With the funding of NSF, new high speed lines were successfully installed at line speeds of 56k (a normal modem nowadays) through telephone lines in 1988. By that time, there were 28,174 computers on the (by then decided) Internet. In 1989 there were 80,000 computers on it. By 1989, there were290,000.Another network was built to support the incredible number of people joining. It was constructed in 1992.Today - The InternetToday, the Internet has become one of the most important technological advancements in the history of humanity. Everyone wants to get 'on line' to experience the wealth of information of the Internet. Millions of people now use the Internet, and it's predicted that by the year 2003 every single person on the planet will have Internet access. The Internet has truly become a way of life in our time and era, and is evolving so quickly its hard to determine where it will go next, as computer and network technology improve every day.HOW IT WORKS:It's a standard thing. People using the Internet. Shopping, playing games,conversing in virtual Internet environments.The Internet is not a 'thing' itself. The Internet cannot just "crash." It functions the same way as the telephone system, only there is no Internet company that runs the Internet.The Internet is a collection of millioins of computers that are all connected to each other, or have the means to connect to each other. The Internet is just like an office network, only it has millions of computers connected to it.The main thing about how the Internet works is communication. How does a computer in Houston know how to access data on a computer in Tokyo to view a webpage?Internet communication, communication among computers connected to the Internet, is based on a language. This language is called TCP/IP. TCP/IP establishes a language for a computer to access and transmit data over the Internet system.But TCP/IP assumes that there is a physical connecetion between onecomputer and another. This is not usually the case. There would have to be a network wire that went to every computer connected to the Internet, but that would make the Internet impossible to access.The physical connection that is requireed is established by way of modems,phonelines, and other modem cable connections (like cable modems or DSL). Modems on computers read and transmit data over established lines,which could be phonelines or data lines. The actual hard core connections are established among computers called routers.A router is a computer that serves as a traffic controller for information.To explain this better, let's look at how a standard computer might viewa webpage.1. The user's computer dials into an Internet Service Provider (ISP). The ISP might in turn be connected to another ISP, or a straight connection into the Internet backbone.2. The user launches a web browser like Netscape or Internet Explorer and types in an internet location to go to.3. Here's where the tricky part comes in. First, the computer sends data about it's data request to a router. A router is a very high speed powerful computer running special software. The collection of routers in the world make what is called a "backbone," on which all the data on the Internet is transferred. The backbone presently operates at a speed of several gigabytes per-second. Such a speed compared to a normal modem is like comparing the heat of the sun to the heat of an ice-cube.Routers handle data that is going back and forth. A router puts small chunks of data into packages called packets, which function similarly to envelopes. So, when the request for the webpage goes through, it uses TCP/IP protocols to tell the router what to do with the data, where it's going, and overall where the user wants to go.4. The router sends these packets to other routers, eventually leadingto the target computer. It's like whisper down the lane (only the information remains intact).5. When the information reaches the target web server, the webserver then begins to send the web page back. A webserver is the computer where the webpage is stored that is running a program that handles requests for the webpage and sends the webpage to whoever wants to see it.6. The webpage is put in packets, sent through routers, and arrive at the users computer where the user can view the webpage once it is assembled.The packets which contain the data also contain special information that lets routers and other computers know how to reassemble the data in the right order.With millions of web pages, and millions of users, using the Internet is not always easy for a beginning user, especially for someone who is not entirely comfortale with using computers. Below you can find tips tricks and help on how to use main services of the Internet.Before you access webpages, you must have a web browser to actually be able to view the webpages. Most Internet Access Providers provide you with a web browser in the software they usually give to customers; you. The fact that you are viewing this page means that you have a web browser. The top two use browsers are Netscape Communicator and Microsoft Internet Explorer. Netscape can be found at /doc/bedc387343323968011c9268.html and MSIE can be found at /doc/bedc387343323968011c9268.html /ie.The fact that you're reading this right now means that you have a web browser.Next you must be familiar with actually using webpages. A webpage is a collection of hyperlinks, images, text, forms, menus, and multimedia. To "navigate" a webpage, simply click the links it provides or follow it's own instructions (like if it has a form you need to use, it will probably instruct you how to use it). Basically, everything about a webpage is made to be self-explanetory. That is the nature of a webpage, to be easily navigatable."Oh no! a 404 error! 'Cannot find web page?'" is a common remark made by new web-users.Sometimes websites have errors. But an error on a website is not the user's fault, of course.A 404 error means that the page you tried to go to does not exist. This could be because the site is still being constructed and the page hasn't been created yet, or because the site author made a typo in the page. There's nothing much to do about a 404 error except for e-mailing the site administrator (of the page you wanted to go to) an telling him/her about the error.A Javascript error is the result of a programming error in the Javascript code of a website. Not all websites utilize Javascript, but many do. Javascript is different from Java, and most browsers now support Javascript. If you are using an old version of a web browser (Netscape 3.0 for example), you might get Javascript errors because sites utilize Javascript versions that your browser does not support. So, you can try getting a newer version of your web browser.E-mail stands for Electronic Mail, and that's what it is. E-mail enables people to send letters, and even files and pictures to each other.To use e-mail, you must have an e-mail client, which is just like a personal post office, since it retrieves and stores e-mail. Secondly, you must have an e-mail account. Most Internet Service Providers provide free e-mail account(s) for free. Some services offer free e-mail, like Hotmail, and Geocities.After configuring your e-mail client with your POP3 and SMTP server address (your e-mail provider will give you that information), you are ready to receive mail.An attachment is a file sent in a letter. If someone sends you an attachment and you don't know who it is, don't run the file, ever. It could be a virus or some other kind of nasty programs. You can't get a virus justby reading e-mail, you'll have to physically execute some form of program for a virus to strike.A signature is a feature of many e-mail programs. A signature is added to the end of every e-mail you send out. You can put a text graphic, your business information, anything you want.Imagine that a computer on the Internet is an island in the sea. The sea is filled with millions of islands. This is the Internet. Imagine an island communicates with other island by sending ships to other islands and receiving ships. The island has ports to accept and send out ships.A computer on the Internet has access nodes called ports. A port is just a symbolic object that allows the computer to operate on a network (or the Internet). This method is similar to the island/ocean symbolism above.Telnet refers to accessing ports on a server directly with a text connection. Almost every kind of Internet function, like accessing web pages,"chatting," and e-mailing is done over a Telnet connection.Telnetting requires a Telnet client. A telnet program comes with the Windows system, so Windows users can access telnet by typing in "telnet" (without the "'s) in the run dialog. Linux has it built into the command line; telnet. A popular telnet program for Macintosh is NCSA telnet.Any server software (web page daemon, chat daemon) can be accessed via telnet, although they are not usually meant to be accessed in such a manner. For instance, it is possible to connect directly to a mail server and check your mail by interfacing with the e-mail server software, but it's easier to use an e-mail client (of course).There are millions of WebPages that come from all over the world, yet how will you know what the address of a page you want is?Search engines save the day. A search engine is a very large website that allows you to search it's own database of websites. For instance, if you wanted to find a website on dogs, you'd search for "dog" or "dogs" or "dog information." Here are a few search-engines.1. Altavista (/doc/bedc387343323968011c9268.html ) - Web spider & Indexed2. Yahoo (/doc/bedc387343323968011c9268.html ) - Web spider & Indexed Collection3. Excite (/doc/bedc387343323968011c9268.html ) - Web spider & Indexed4. Lycos (/doc/bedc387343323968011c9268.html ) - Web spider & Indexed5. Metasearch (/doc/bedc387343323968011c9268.html ) - Multiple searchA web spider is a program used by search engines that goes from page to page, following any link it can possibly find. This means that a search engine can literally map out as much of the Internet as it's own time and speed allows for.An indexed collection uses hand-added links. For instance, on Yahoo's site. You can click on Computers & the Internet. Then you can click on Hardware. Then you can click on Modems, etc., and along the way through sections, there are sites available which relate to what section you're in.Metasearch searches many search engines at the same time, finding the top choices from about 10 search engines, making searching a lot more effective.Once you are able to use search engines, you can effectively find the pages you want.With the arrival of networking and multi user systems, security has always been on the mind of system developers and system operators. Since the dawn of AT&T and its phone network, hackers have been known by many, hackers who find ways all the time of breaking into systems. It used to not be that big of a problem, since networking was limited to big corporate companies or government computers who could afford the necessary computer security.The biggest problem now-a-days is personal information. Why should you be careful while making purchases via a website? Let's look at how the internet works, quickly.The user is transferring credit card information to a webpage. Looks safe, right? Not necessarily. As the user submits the information, it is being streamed through a series of computers that make up the Internet backbone.The information is in little chunks, in packages called packets. Here's the problem: While the information is being transferred through this big backbone, what is preventing a "hacker" from intercepting this data stream at one of the backbone points?Big-brother is not watching you if you access a web site, but users should be aware of potential threats while transmitting private information. There are methods of enforcing security, like password protection, an most importantly, encryption.Encryption means scrambling data into a code that can only be unscrambled on the "other end." Browser's like Netscape Communicator and Internet Explorer feature encryption support for making on-line transfers. Some encryptions work better than others. The most advanced encryption system is called DES (Data Encryption Standard), and it was adopted by the US Defense Department because it was deemed so difficult to 'crack' that they considered it a security risk if it would fall into another countries hands.A DES uses a single key of information to unlock an entire document. The problem is, there are 75 trillion possible keys to use, so it is a highly difficult system to break. One document was cracked and decoded, but it was a combined effort of14,000 computers networked over the Internet that took a while to do it, so most hackers don't have that many resources available.附件2:外⽂资料翻译译⽂Internet的历史起源——ARPAnetInternet是被美国政府作为⼀项⼯程进⾏开发的。

Green International Wine MarketingGreen International Wine MarketingMary Pugh & Richard FletcherAbstract The Banrock Station brand, owned by wine producer BRL Hardy, has been highly successful in the UK and USA, and in the Australian premium wine market. In part, success has arisen from the positive attributes of being a ‘new world’ wine, but the case study shows that it is branding as a ‘green’ wine that supports conservation activities that has given Banrock Station a distinctive edge. The experience of BRL Hardy points to a number of key lessons in international marketing that may help other companies break free from the competitive pack. Keywords: Wine marketing, green brands, international marketingIntroduction One of the major challenges facing Australian firms in the international marketplace is how to differentiate their products from those of competitors. This case explores the challenges facing BRL Hardy Ltd. of Australia and how they met the challenge in a global wine market that is highly competitive and characterised by multiple players, labels and products. Although Australia has captured only 5% of the world’s wine market, Australian wines are the fastest growing import category in key markets such as the UK and USA, stealing market share from traditional ‘old world’ wine producers such as France, Italy, Germany and Spain. Australia’s success to date stems not only from its comparative advantage of producing quality wines at reasonable prices, but the ability of Australian wine companies to build brands to compete internationally. This case study demonstrates BRL Hardy has identified a unique global market segment of a wine targeted at the environmentally conscious. The case covers the initial stages of the implementation of the strategy to position its BRL Hardy’s Banrock Station brand of wines in the environmentally conscious segment, through to a promotional program of ‘green’ international wine marketing. Background BRL Hardy Ltd. was formed after a 1992 merger ofSouth Australian-based wineries, Berri Renmano Ltd. and Thomas Hardy and Sons Pty Ltd. It is now one of the top four wine producers in Australia and one of the top 10 largest wine groups in the world. Its Banrock Station brand, produced from grapes mostly grown in the Riverland region of South Australia, is the rising star of the company’s wine portfolio. The first wine stock was produced as recently as 1995, and now production is 2.4 million cases a year. In 1994 BRL Hardy acquired Banrock Station with 250 hectares of good soil for producing premium grape varieties. The rest of the property is made up of 900 hectares of wetland and 600 hectares of protected Mallee Woodland eco system. The property was suffering from the impact of prolonged farming and grazing. BRL Hardy, together with Wetland Care Australia undertook a huge revegetation program to remove stock, install fish barriers and reintroduce natural wetting and drying cycles in the wetland. This has resulted in the native birds and fish, water plants, frogs, and insects returning to restore the health of the River Murray. The 250 hectares of new vineyard is used to produce five major wine varieties. As Figure 1 shows, red wines are more favoured than white wine varieties. The vineyard’s total yield per year is 5,000 tonnes which converts to 3,500,000 litres of wine or 380,000 cases. The additional tonnage required to meet domestic and export76Australasian Marketing Journal 10 (3), 2002Green International Wine MarketingWine Variety 20 33 43 48 59 0 20 No of Hectares 40 60Merlot Chardonnay Semillon Cabernet Sauvignon ShirazFigure 1: Banrock Station Major Wine Varieties (Source: BRL’s Banrock Station)demand of over two million cases comes from purchasing other grapes from local producers in the Riverland. Australia and the Global Wine Market Market conditions are ripe for Australian wine producers to increase exports. The ‘old world’ wine producers such as France and Italy, which have historically held a large market share of the global export market, are in decline. In 1997, France held 26% of export volume, Italy 23% and Spain 14%. In total these ‘old world’ producers represented 67% of the export wine market. However, it is the ‘new world’ wine producers such as Australia, New Zealand, Chile and South Africa who are experiencing growth. While only holding a relatively small market share of export volume, they are stealing share from the ‘old world’ producers. Following centuries of quality wine being associated with ‘old world’ wine producers, Australian wines are now at the forefront of a new consumer trend led by ‘new world’ producers – the supply of good quality, good value, ready to drink now, good tasting, fruity wines. As Table 1 shows, Australia is ranked Number 4 on exportvalue and is the market leader in ‘new world’ wines. Australia’s remarkable success in the UK market is being demonstrated by delivering wine products that are relevant to everyday living and enjoyed by all. The wine brand ‘Australia’ is leveraging the effect of country of origin image (Abmed & D’Astous 1996) in transferring favourable perceptions of quality fruit and a relaxed lifestyle to its food and wine. This positioning in the UK and USA markets has stimulated demand for ‘premium’ category wines (i.e., those that are categorised above basic ‘good quality/good value’ wines). Australian wine exports have grown substantially since the mid 1980s. At the end of the 2000/01 financial year, Australia exported 339 million litres which was a 17% increase on the previous year. The export market volume for Australian wine is projected to double in size over the next ten years to 676 million litres accounting for 61% of production compared to 47% at present. This is illustrated in Figure 2. There are five key quality/price segments in the wine industry. The principal driving force behind increasedAustralasian Marketing Journal 10 (3), 200277Green International Wine MarketingTable 1: 1997 World Wine Export Value (Source: Berger, Spahini and Anderson 1999) Country Export Value as a % of world wine exports 41.7 17.2 9.2 4.8 4.3 3.8 3.6 3.3 3.2 1.5 Old or New World Wines1. France 2. Italy 3. Spain 4. Australia 5. Portugal 6. Germany 7. Chile 8. USA 9. Fomer Soviet Union 10. South AfricaOld Old Old New Old Old New New Old Newexport sales is considered to be in the branded premium wine segment estimated to account for 34% of world wine sales. Australian brands in relation to these segments are shown in Figure 3. As the graph shows, Banrock Station falls into the premium category (above ‘basic’, and below ‘super-premium’). Developing an International Strategy The challenge for BRL Hardy is how to secure additional export sales in an increasingly competitive market. Application of Porter’s ‘Five Forces Model’ (1990) to the global marketplace for Australian wines indicates: New Entrants: There is a likely threat from new entrants, especially from large global liquor giants such as Diageo and Allied Domecq of the UK and LVMH and Pernod Ricard of France, who see the wine sector as a faster growing business compared to other liquor categories such as spirits, beer and champagne with which they were historically associated. They are aggressively embarking on acquisitions and are interested in Australian wineries. Suppliers: There is a low threat from suppliers of grapesas these have little bargaining power apart from those supplying Merlot and Verdelho who have more clout due to some shortage of these varieties. Over-planting of red wine grapes has given Australian wineries scope to obtain higher quality product at a competitive price. Buyers: The threat from buyers is high as securing distribution in a crowded market is difficult, especially when the distribution channels in major overseas markets are largely dominated by supermarket and major liquor chains. There is some evidence that distributors are becoming more favourably disposed towards Australian wines due to their consistent quality and availability. Substitutes: Although there are other alcoholic products that compete with wine, wine is the fastest growing alcoholic beverage on a global basis. Australia has a comparative advantage in producing innovative, high quality wines which, because they can be consumed without aging, attract new wine consumers and young drinkers in ‘old world’ countries. As illustrated in Figure 4, BRL countered the reaction of industry competitors to overseas market entry. BRL differentiated themselves by pursuing a niche market78Australasian Marketing Journal 10 (3), 2002Green International Wine Marketingstrategy in their target overseas markets. This was achieved by positioning the Banrock Station brand initially in the two major markets of the UK and USA as a ‘green’ wine that supports conservation activities. This involved looking at the market from a different perspective and looking at areas to create value to differentiate the selected brand from the competitive pack. The key to discovering new value was asking four basic questions, as outlined in the Kim and Mauborgne Model (1999) shown in Table 2. Addressing these key questions has allowed BRL to create Banrock Station - a wine that can be simply positioned as “good wine, good earth, good living”. Kim and Mauborgne (1999) suggest ‘The Value Curve’ – a graphic depiction of the way a company or industry configures its offering to customers – is a powerful tool for creating new market space. It is drawn by plotting the performance of the offering relative to other alternatives along the key success factors that define competition inthe industry. Identified in Figure 4, the creation of a new value curve would appear to be possible for Banrock Station wine, by adopting a marketing positioning strategy based on a ‘green’ wine that supports conservation activities. Creating a ‘Green’ Brand Creating a ‘green brand’ meant tapping into the values and beliefs of wine buyers. As a starting point, BRL Hardy recognised that their investment in and achievement of restoring the magnificent Banrock Station wetlands might be shared with their customers. This strategy has proven to be successful in Australia. With every bottle of Banrock Station wine sold, a portion of the sale proceeds is donated to conservation projects to ensure environmental havens are restored and preserved for future generations. All proceeds in Australia go to Wetland Care Australia and Landcare Australia. An analysis of the demographics of wine consumption inYear 676 437 Forecast20102001 Current339 3691990 Historical 042 301200400 Million Litres600800International Markets Australian DomesticFigure 2: Australian Domestic Market vs International Market Growth (Data Source: Wine Federation of Australia & Australian Wine and Brandy Corporation, 2000)Australasian Marketing Journal 10 (3), 200279Green International Wine MarketingPrice Price range ICON USD 50 AU 50 UK 20 Indicative brandsPenfolds Grange Henschke Hill of Grace Leeuwin Chardonnay Petaluma Coonawarravolume market share: 1%Price range ULTRAPREMIUMUSD 14-49.99 Indicative brands AU 15-49.99 Wolf Blass Grey Label Orlando St Hugo UK 7-19.99 BrokenwoodDe Bortoli Yarra Valley Pipers Brookvolume market share: 5%Price rangeUSD 8-13.99 Indicative brands AU 10-14.99 Penfolds Koonunga Hill Jamieson's Run UK 5-6.99 Rosemount Diamond LabelLeasingham Bin Rangevolume market share: 10%SUPER PREMIUMPrice rangeUSD 5-7.99 AU 5-9.99 UK 3-4.99Indicative brandsBarramundi Banrock Station Jacobs Creek Lindeman's Bin Range Oxford Landing Hardy's Nottage Hillvolume market share: 34%PREMIUM Price range < USD 5volume market share: 50%BASICVolumeFigure 3: Quality Segments in the Wine Industry (Source: Wine Federation of Australia & Australian Wine and Brandy Corporation, 2000) developed country markets such as Australia indicates that the bulk of wine consumers typically fall into the age group 40 and 60 years with a skew towards women. This generation is often referred to as ‘Baby Boomers’ and represents about 24% of the Australian population and around 33% of the US population. It is a group that is sensitive to environmental concerns. They were the original activists and are pro environmentalists. They created the first Earth Day back in 1970. However, the values of this group have not previously been tapped as far as wine marketing is concerned. For this strategy to be implemented, it must be conveyed to the customer via the brand. The brand is a bond with the customer. Keegan, Moriarty and Duncan (1992, p. 448) defines it as a “perception in the mind of consumers who ascribe beliefs, values and personalities to products” and Kotler (2000, p. 404) as a “seller’s promise to deliver a specific set of features, benefits and services consistently to buyers”. Strategically, it has been brands that have made Australian wine producers successful over other market competitors - not the name of the wine producer. Successful wine, the brand and the attitude it engenders, must relate to the wine consumer’s own sense of individuality and unique style. For a ‘green’ wine, the brand image should appeal to consumer’s who are seek-80Australasian Marketing Journal 10 (3), 2002Green International Wine MarketingSource: Banrock Station Wine postcarding a product that fits with their values of good living, being healthy and their desire to act in an environmentally friendly way. Wine buyers are thinking about the quality connection with where the product comes from and what they are purchasing. Ottman (1992) claimed that while quality, price and convenience are still uppermost in consumers’ purchasing decisions, a fourth attribute, environmental compatibility, that is a product’s greenness, is fast becoming a tie-breaker at the shelf.By linking Banrock Station’s brand attributes of good value, quality wines, that are ready to drink now, with a conservationist personality it is intended to create a new source of competitive advantage for BRL Hardy’s Banrock Station brand. The brand slogan “good earth, fine wine” easily identifies Banrock Station with supporting the environment. Additional in-store promotional material highlights Banrock Station Wines conservation initiatives – for example, a bottle flyer with a pelican. This saves the consumer time in evaluating otherTable 2: Creating a New Value Curve Key Questions 1. Reduce – What factors should be reduced well below the industry standard? Areas for innovation – Price – Length of time to markets from the vine to the table – Alcohol content – A representation of healthy living – An environment friendly wine – A relationship with the brand – Flavour and wine quality – Innovative wine styles – Interesting brands – Standard labels/packaging – Snob Factor – Wine speak2. Create – What factors should be created that the industry has never offered?3. Raise – What factors should be raised well above industry standards?4. Eliminate – What factors should be eliminated that the industry takes for granted?Australasian Marketing Journal 10 (3), 200281Green International Wine MarketingHighRelative valueNealu wVeCLow Price Quality Taste Ready to drink Environment friendlyKey elements of the wine industry product, service and deliveryTraditional bottled wine value curve Banrock Station wine's new value curveFigure 4: The New Value Curve for Banrock Station Winebrands and helps them to easily distinguish the point of difference in retail outlets. In addition, Banrock Station’s green brand image is reflected in the advertising, good news stories about conservation projects, packaging, point of purchase promotions, wine shows and on the website where consumers can take a virtual tour of Banrock Station (see: .au). Application of ‘Green’ Brand Equity to International Markets As the ‘green’ marketing approach was successful in Australia, BRL Hardy decided to apply it to selected overseas markets which were considered to offer longterm growth potential. The eight selected international wine markets were the USA, Netherlands, Canada, Sweden, New Zealand, UK, Finland and Denmark. All are developed markets with environmentally sensitive ‘Baby Boomers’. In these markets, BRL aimed to build strategic alliances with local conservation groups, as they did in Australia. A key to the market entry strategywas establishing strategic alliances with ‘green’ groups so as to increase consumer’s confidence in and credibility of the brand’s environmental claims. In each case, a certain percentage of profit from sales of each bottle of wine would go to the alliance partner to fund environmental projects. Implementation of this international approach was facilitated by hiring an environmental scientist, Tony Sharley, who manages the Banrock Station Wine and Wetland Centre in Australia. In this role, he manages conservation projects with organisations in key international markets and can verify Banrock Station’s ‘green’ credentials. High on the agenda was Australia’s number one wine market, the UK, where BRL sells a number of successful brands. In the UK, Banrock Station wines and the Wildfowl and Wetlands Trust (WWT) are working together to save wetlands and wildlife. Funds from Banrock Station wines are being used to support the continual monitoring and maintenance of 4,000 acres of WWT’s wetland reserves and their wildlife.82Australasian Marketing Journal 10 (3), 2002urveGreen International Wine MarketingIn Canada, BRL established their own organisation to coordinate environmental projects to help conserve and protect endangered birds and wetlands (the Banrock Station Wine Wetland Foundation, Canada). In the USA, Banrock Station has partnered with the Arthur R Marshall Foundation to champion restoration and preservation of America’s Greater Everglades ecosystem and sponsored Cypress Tree Planting Day in an effort to restore the Everglades ancient forest. In Europe, Banrock Station wines are working with the Swedish Wetland Fund, with proceeds supporting OsterMalma, Lida and other wetlands in the area; in Finland, with Liminganlahti Bay, a high profile and highly regarded wetland region in the north of Finland; and in Netherlands Banrock Station wines, Staatsbosbeheer and Wetlands International are working together to save wetlands. Recently, Banrock Station commenced a partnership with Danish Nature who will use the funds to restore wetland in the Langelands region. Closer to home, Banrock Station wines have combined with the environment group, Wetland Care New Zealand to sponsor wetland restoration projects throughout New Zealand. The first year’s proceeds under the sponsorshiphelped to develop a wetland within the widely acclaimed Karori Sanctuary in Wellington and this year a wetland has been created at Masterton in the Wairarapa region. International Sales Growth Figure 3 shows that Banrock Station is in the premium wine category offering good value for money. A similar price positioning has been adopted in selected overseas markets. As such, it is priced below some of its major Australian competitors. In the UK, BRL Hardy has had to contend with a distribution system where the retailers are gate-keepers and ten accounts can represent 70% of the market. Here, buyer label wines account for a considerable share of the market. To counter this it is necessary for Banrock Station to create an awareness of their own brand. This is being achieved via the use of cinema and outdoor advertising, including the London Underground. By contrast, in the USA the distribution of wines approximates that of fast moving consumer goods (FMCG) and there is little wine sold under the labels of buyers. The value for money claim is being augmented in all markets with the “support conservation theme” and point-of-sale support that reinforces the conservation image. It is this support that provides the brand with its unique selling proposition (USP).Table 3: UK Brands Top Wines 2000 Listing (Source: Macquarie Bank Research 2001) Brand Ernest & Julio Gallo Jacobs Creek Hardys Stowells of Chelsea Rosemount Lindemans Penfolds Blossom Hill Le Piat D’or Banrock Station Company E&J Gallo Winery Orlando Wyndham BRL Hardy Wine Matthew Clark Rosemount Wine Estates Southcorp Wines Southcorp Wines UDV Piat Pere Et Fils BRL Hardy Wine Off Trade % Growth 22% 24% 33% 28% 69% 53% 2% 143% (-15%) 165%Australasian Marketing Journal 10 (3), 200283Green International Wine MarketingThis approach has proved to be a deciding factor at the point-of-purchase amongst the growing number of environmentally conscious consumers in the US and the UK. Banrock Station wines are proving to be a stand out performer for BRL Hardy in international markets. They are ranked Number 7 in the Top 10 selling Australian wine brands in the US Market and 3rd in volume of the premium Australian brands exported to the US. In the 13-week period ending 17 May 2001, Banrock Station’s overall ranked position in the US market was 189th and it is the fastest growing brand in the BRL portfolio. Banrock Station is the number one fastest growing brand in the UK as shown in Table 3. There is no doubt that much of this success has been due to the ‘green’ international wine marketing of Banrock Station wines. Future growth is dependent upon maintaining and building the brand through continued investment in conservation projects and the development of new markets with significant segments of environmentally friendly wine buyers. Key Lessons The success of BRL’s Banrock station brand in the UK and US markets to date can be explained in part by its being a ‘new world’ wine, priced in the attractive ‘premium’ wine category with a country of origin image associated with sunshine, health and wide open spaces – an attractive image consistent with wine production. However, of themselves these ‘new world’ wine characteristics do not explain the rapid rise in overseas sales, nor its major market share amongst the Australian premium wine segment. Success is also due to the niche marketing strategy pursued by the firm of positioning the brand as a ‘green’ wine that supports conservation activities. This strategy has positioned the brand in a new marketspace that includes environmentally conscious consumers. This strategy appeals to a different set of values, and values not targeted by other wine producers. Although the magnitude of this segment may differ between countries, environmentally conscious consumers are a global segment that offers considerable potential for the future marketing of the Banrock Station brand. The experience of BRL Hardy points to a number of other key lessons in international marketing that may help other companies also break free from the competitive pack. The first of these is that innovative marketing approaches are a useful vehicle for companies to create new overseas markets and/or reposition themselves in existing markets. BRL’s approach was to look at their market from a new perspective and create new value forstakeholders in those markets. This was achieved by tapping into the values and beliefs of their customers and creating new product attributes to influence the purchasing decisions of customers. In this case it was by creating a brand associated with caring for the environment as illustrated by investing sales receipts back into conservation projects. The second lesson relates to the need to pursue a strategy in depth rather than superficially if it is to be effective in overseas markets. In this case a company embarking on a ‘green’ brand strategy needs to realise it has to be more than just a gimmick. The company has to excel in delivering not just the product benefits, but also the green benefits that customers truly desire. BRL’s experience shows their ‘green’ brand has to stay relevant and credible. This was achieved by ongoing restoration of its own wetland, employing an environmental scientist, and consistently communicating the brand’s environmental initiatives and project involvement via publication of ‘good news’ stories, distinctive product packaging and labelling, and through the focus of its sales team. Only in this way can a company continue to grow the market in its chosen segment. Finally, the application of brand management to overseas markets often requires the building of strategic alliances with local groups if brand equity is to be sustained or further developed in these overseas markets. In the case of BRL Hardy, the strategic alliances were with local conservation groups similar to those with whom alliances had been forged in Australia. The lesson from Australia was in this case applied in overseas markets – that the brand must associate itself with the projects of its alliance partner and should do this by the firm’s management maintaining an active interest in the quality of those environmental projects. Banrock Station’s environmental scientist developed quality controls to ensure that funds directed to those conservation groups from Banrock Station sales were invested in technically sound and rewarding conservation projects. If ‘green’ projects are important, well supported and understood by the consumer, the brand will build and increase its ‘green’ brand equity. In summary, BRL have shown how important a ‘green’ brand is to increasing market share and how innovation in marketing can help a company create a point of difference that redefines the attributes on which buyers base their purchasing decision. References Ahmed, S.A., D’Astous, A., 1996. Country of Origin and Brand Effects: A Multi-Dimensional and Multi-Attribute84Australasian Marketing Journal 10 (3), 2002Green International Wine MarketingStudy. Journal of International Consumer Marketing 9(2), 93-115. Berger, N., Saphini, P., Anderson, K., 1999. Bilateral Trade Patterns in the World Wine Market 1988 to 1997: A Statistical Compendium. University of Adelaide: Centre for International Economic Studies. Keegan, W., Moriarty, S., Duncan, T., 1992. Marketing. New Jersey: Prentice Hall. Kim, C., Mauborgne, R, 1999. Creating New Market Space. Harvard Business Review, January-February, 83-93. Kotler, P., 2000. Marketing Management: The Millenium Edition. New Jersey: Prentice Hall. Macquarie Bank Research, 2001. Essentials, March 2001. Ottman, J A, 1992. Green Marketing: Challenges and Opportunities for the New Marketing Age. Chicago: NTC Business Books. Porter, M., 1990. The Competitive Advantage of Nations. London: Macmillan. Wine Federation of Australia & Australian Wine and Brandy Corporation, 2000. The Marketing Decade 20002010, November (.au).Acknowledgements The authors of this case are grateful to Mr Stephen Millar (Managing Director, BRL Hardy Ltd); Mr David Woods (International Trading Director, BRL Hardy Ltd) and Mr Tony Sharley (Manager, Banrock Station Wine and Wetland Centre) for agreeing to be interviewed and for their valuable insights. Biographies Mary Pugh is a Marketing Project Manager at the NSW Police. She has recently graduated from the Masters of Business (International Marketing) program. Richard Fletcher, PhD, is an Associate Professor and Director of Post Graduate Programs in the School of Marketing, University of Technology, Sydney. Correspondence Addresses Mary Pugh, C/o School of Marketing, University of Technology, City Campus, Quay St, Haymarket, PO Box 123 Broadway, Sydney NSW 2007. Email: marygabrielle @, Richard Fletcher, School of Marketing, University of Technology, City Campus, Quay St, Haymarket, PO Box 123 Broadway, Sydney NSW 2007. Telephone: +61 (2) 9514 3537, Facsimile: +61 (2) 9514 3535, e-mail: Richard.Fletcher@.auAustralasian Marketing Journal 10 (3), 200285。
附录C:外文翻译资料Article Source:Business & Commercial Aviation, Nov 20, 2000. 5-87-88 Interactive Electronic Technical Manuals Electronic publications can increase the efficiency of your digital aircraft and analogtechnicians.Benoff, DaveComputerized technical manuals are silently revolutionizing the aircraft maintenance industry by helping the technician isolate problems quickly, and in the process reduce downtime and costs by more than 10 percent.These electronic publications can reduce the numerous volumes of maintenance manuals, microfiche and work cards that are used to maintain engines, airframes, avionics and their associated components."As compared with the paper manuals, electronic publications give us greater detail and reduced research times," said Chuck Fredrickson, general manager of Mercury Air Center in Fort Wayne, Ind.With all the advances in computer hardware and software technologies, such as high quality digital multimedia, hypertext and the capability to store and transmit digital multimedia via CD-ROMs/ networks, technical publication companies have found an effective, cost-efficient method to disseminate data to technicians.The solution for many operators and OEMs is to take advantage of today's technology in the form of Electronic Technical Manuals (ETM) or Interactive Technical Manuals (IETM). An ETM is any technical manual prepared in digital format that has the ability to be displayed using any electronic hardware media. The difference between the types of ETM/IETMs is the embedded functionality and implementation of the data."The only drawback we had to using ETMs was getting enough computers to meet our technicians' demand," said Walter Berchtold, vice president of maintenance at Jet Aviation's West Palm Beach, Fla., facility.A growing concern is the cost to print paper publications. In an effort to reduce costs, some aircraft manufacturers are offering incentives for owners to switch from paper to electronic publications. With an average printing cost of around 10 cents per page, a typical volume of a paper technical manual can cost the manufacturer over $800 for each copy. When producing a publication electronically, average production costs for a complete set of aircraft manuals are approximately $20 per copy. It is not hard to see the cost advantages of electronic publications.Another advantage of ETMs is the ease of updating information. With a paper copy, the manufacturer has to reprint the revised pages and mail copies to all the owners. When updates are necessary for an electronic manual, changes can either be e-mailed to theowners or downloaded from the manufacturer's Web site.So why haven't more flight departments converted their publications to ETM/IETMs? The answer lies in convincing technicians that electronic publications can increase their efficiency."We had an initial learning curve when the technicians switched over, but now that they are familiar with the software they never want to go back to paper," said Fredrickson.A large majority of corporate technicians also said that while they like the concept of having a tool that aids the troubleshooting process, they are fearful to give up all of their marked-up paper manuals.In 1987, a human factors study was conducted by the U.S. government to compare technician troubleshooting effectiveness, between paper and electronic methodology, and included expert troubleshooting procedures with guidance through the events. Results of the project indicated that technicians using electronic media took less than half the time to complete their tasks than those using the paper method, and technicians using the electronic method accomplished 65 percent more in that reduced time.The report also noted that new technicians using the electronic technical manuals were 12-percent more efficient than the older, more experienced technicians. (Novices using paper took 15 percent longer than the experts.)It is interesting that 90 percent of the technicians who used the electronic manuals said they preferred them to the paper versions. This proved to the industry that with proper training, the older technicians could easily transition from paper to electronic media.Electronic publications are not a new concept, although how they are applied today is. "Research over the last 20 years has provided a solid foundation for today's IETM implementation," said Joseph Fuller of the U.S. Naval Surface Warfare Center. "IETMs such as those for the Apache, Comanche, F-22, JSTAR and V-22 have progressed from concept to military and commercial implementation."In the late 1970s, the U.S. military investigated the feasibility of converting existing paper and microfilm. The Navy Technical Information Presentation System (NTIPS) and the Air Force Computer- based Maintenance Aid System (CMAS) were implemented with significant cost savings.The report stated that transition to electronic publications resulted in reductions in corrective maintenance time, fewer false removals of good components, more accurate and complete maintenance data collection reports, reduction in training requirements and reduced system downtime.The problem that the military encountered was ETMs were created in multiple levels of complexity with little to no standardization. Options for publications range from simple page-turning programs to full-functioning automated databases.This resulted in the classification of ETMs so that the best type of electronic publication could be selected for the proper application.Choosing a LevelWith all of the OEM and second- and third-party electronic publications that are available it is important that you choose the application level that is appropriate for your operation.John J. Miller, BAE Systems' manager of electronic publications, told B/CAthat "When choosing the level of an ETM/IETM, things like complexity of the aircraft and its systems, ease of use, currency of data and commonality of data should be the deciding factors; and, of course, price. If operational and support costs are reduced when you purchase a full-functioning IETM, then you should purchase the better system."Miller is an expert on the production, sustainment and emerging technologies associated with electronic publications, and was the manager of publications for Boeing in Philadelphia.Electronic publications are classified in one of five categories. A Class 1 publication is a basic electronic "page turner" that allows you to view the maintenance manual as it was printed. With a Class 2 publication all the original text of the manual is viewed as one continuous page with no page breaks. In Class 3, 4 and 5 publications the maintenance manual is viewed on a computer in a frame-based environment with increasing options as the class changes. (See sidebar.)Choosing the appropriate ETM for your operation is typically limited to whatever is being offered on the market, but since 1991 human factors reports state the demand has increased and, therefore, options are expected to follow.ETM/IETM ProvidersCompanies that create ETM/IETMs are classified as either OEM or second party provider. Class 1, 3 and 4 ETM/IETMs are the most commonly used electronic publications for business and commercial operators and costs can range anywhere from $100 to $3,000 for each ETM/ IETM. The following are just a few examples ofETM/IETMs that are available on the market.Dassault Falcon Jet offers operatorsof the Falcon 50/50EX, 900/900EX and 2000 a Class 4 IETM called the Falcon Integrated Electronic Library by Dassault (FIELD). Produced in conjunction with Sogitec Industries in Suresnes Cedex, France, the electronic publication contains service documentation, basic wiring, recommended maintenance and TBO schedules, maintenance manual, tools manual, service bulletins, maintenance and repair manual, and avionics manual.The FIELD software allows the user to view the procedures and hot- link directly to the Illustrated parts catalog. The software also enables the user to generate discrepancy forms, quotation sheets, annotations in the manual and specific preferences for each user.BAE's Miller said most of the IETM presentation systems have features called "Technical Notes." If a user of the electronic publication notices a discrepancy or needs to annotate the manual for future troubleshooting, the user can add a Tech Note (an electronic mark-up) to the step or procedure and save it to the base document. The next time that or another user is in the procedure, clicking on the tech note icon launches a pop-up screen displaying the previous technician's comments. The same electronic transfer of tech notes can be sent to other devices by using either a docking station or through a network server. In addition, systems also can use "personal notes" similar to technical notes that are assigned ID codes that only the authoring technician can access.Requirements for the FIELD software include the minimum of a 16X CD-ROM drive,Pentium II 200 MHz computer, Windows 95, Internet Explorer 4 SP 1 and Database Access V3.5 or higher.Raytheon offers owners of Beech and Hawker aircraft a Class 4 IETM called Raytheon Electronic Publication Systems (REPS). The REPS software links the frame-based procedures with the parts catalog using a single CD-ROM.Raytheon Aircraft Technical Publications said other in- production Raytheon aircraft manual sets will be converted to the REPS format, with the goal of having all of them available by 2001. In addition Raytheon offers select Component Maintenance Manuals (CMM). The Class 1 ETM is a stand-alone "page-turner" electronic manual that utilizes the PDF format of Adobe Acrobat.Other manufacturers including Bombardier, Cessna and Gulfstream offer operators similar online and PDF documentation using a customer- accessed Web account.Boeing is one manufacturer that has developed an onboard Class 5 IETM. Called the Computerized Fault Reporting System (CFRS), it has replaced the F-15 U.S. Air Force Fault Reporting Manuals. Technologies that are currently being applied to Boeing's military system are expected to eventually become a part of the corporate environment.The CFRS system determines re-portable faults by analyzing information entered during a comprehensive aircrew debrief along with electronically recovered maintenance data from the Data Transfer Module (DTM). After debrief the technicians can review aircraft faults and schedule maintenance work to be performed. The maintenance task is assigned a Job Control Number (JCN) and is forwarded electronically to the correct work center or shop. Appropriate information is provided to the Air Force's Core Automated Maintenance System (CAMS).When a fault is reported by pilot debrief, certain aircraft systems have the fault isolation procedural data on a Portable Maintenance Aid (PMA). The JCN is selected on a hardened laptop with a wireless Local Area Network (LAN) connection to the CFRS LAN infrastructure. The Digital Wiring Data System (DWDS) displays aircraft wiring diagrams to the maintenance technician for wiring fault isolation. On completion of maintenance, the data collected is provided to the Air Force, Boeing and vendors for system analysis.Third party IETM developers such as BAE Systems and Dayton T. Brown offer OEMs the ability to subcontract out the development of Class 1 through 5 ETM/IETMs. For example, Advantext, Inc. offers PDF and IPDF Class 1 ETMs for manufacturers such as Piper and Bell Helicopters. Technical publications that are available include maintenance manuals, parts catalogs, service bulletins, wiring diagrams, service letters and interactive parts ordering forms.The difference between the PDF and IPDF version is that the IPDF version has the ability to search for text and include hyperlinks. A Class 1 ETM, when printed, is an exact reproduction of the OEM manuals, including any misspellings or errors. Minimum requirements for the Advantext technical publications is a 486 processor, 16 MB RAM with 14 MB of free hard disk space and a 4X CD-ROM or better.Aircraft Technical Publishers (ATP) offers Class 1, 2 and 3 ETM/ IETMsfor the Beechjet 400/400A; King Air 300/ 350, 200 and 90; Learjet 23/24/25/28/29/35/36/55; Socata TB9/10/20/21 and TBM 700A; Sabreliner 265-65, -70 and -80; andBeech 1900. The libraries can include maintenance manuals, Illustrated parts bulletins, wiring manuals, Airworthiness Directives, Service Bulletins, component maintenance manuals and structural maintenance manuals. System minimum requirements are Pentium 133 MHz, Windows 95 with 16 MB RAM, 25 MB free hard disk space and a 4X CD-ROM or better.Additional providers such as Galaxy Scientific are providing ETM/ IETMs to the FAA. This Class 2, 3 and 4 publication browser is used to store, display and edit documentation for the Human Factors Section of the administration."Clearly IETMs have moved from research to reality," said Fuller, and the future looks to hold more promise.The Future of Tech PubsThe use of ETM/IETMs on laptop and desktop computers has led research and development corporations to investigate the human interface options to the computer. Elements that affect how a technician can interface with a computer are the work environment, economics and ease of use. Organizations such as the Office of Naval Research have focused their efforts on the following needs of technicians: -- Adaptability to the environment.-- Ease of use.-- Improved presentation of complex system relationship.-- Maximum reuse and distribution of engineering data.-- Intelligent data access.With these factors in mind, exploratory development has begun in the areas of computer vision, augmented reality display and speech recognition.Computer vision can be created using visual feedback from a head- mounted camera. The camera identifies the relative position and orientation of an object in an observed scene, and the object is used to correlate the object with a three-dimensional model. In order for a computer vision scenario to work, engineering data has to be provided through visually compatible software.When systems such as Sogitech's View Tech electronic publication browser and Dassault Systemes SA's Enovia are combined, a virtual 3D model is generated.The digital mockup allows the engineering information to directly update the technical publication information. If a system such as CATIA could be integrated into a Video Reference System (VRS), then it could be possible that a technician would point the camera to the aircraft component, the digital model identifies the component and the IETM automatically displays the appropriate information.This example of artificial intelligence is already under development at companies like Boeing and Dassault. An augmented reality display is a concept where visual cues are presented to users on a head-mounted, see-through display system.The cues are presented to the technician based on the identification of components on a 3D model and correlation with the observed screen. The cues are then presented as stereoscopic images projected onto the object in the observed scene.In addition a "Private Eye" system could provide a miniature display of the maintenance procedure that is provided from a palm- size computer. Limited success hascurrently been seen in similar systems for the disabled. The user of a Private Eye system can look at the object selected and navigate without ever having to touch the computer. Drawbacks from this type of system are mental and eye fatigue, and spatial disorientation.Out of all the technologies, speech recognition has developed into an almost usable and effective system. The progression through maintenance procedures is driven by speaker-independent recognition. A state engine controls navigation, and launches audio responses and visual cues to the user. Voice recognition software is available, although set up and use has not been extremely successful.Looking at other industries, industrial manufacturing has already started using "Palm Pilot" personal digital assistants (PDAs) to aid technicians in troubleshooting. These devices allow the technician to have the complete publication beside them when they are in tight spaces. "It would be nice to take the electronic publications into the aircraft, so we are not constantly going back to the work station to print out additional information," said Jet Aviation's Berchtold.With all the advantages that a ETM/ IETM offers it should be noted that electronic publications are not the right solution all of the time, just as CBT is not the right solution for training in every situation. Only you can determine if electronic publications meet your needs, and most technical publication providers offer demo copies for your review. B/CA IllustrationPhoto: Photograph: BAE Systems' Christine Gill prepares a maintenance manual for SGML conversion BAE Systems; Photograph: Galaxy Scientific provides the FAA's human factors group with online IETM support.; Photograph: Raytheon's Class 4 IETM "REPS" allows a user to see text and diagrams simultaneously with hotlinks to illustrated parts catalogs.外文翻译资料译文部分文章出处:民航商业杂志,2000-11-20,5-87-88交互式电子技术手册的电子出版物可以提高数字飞机和模拟技术的效率。
e c o l o g i c a l e n g i n e e r i n g 28(2006124–130a v a i l ab l e a t w w w.sc i e n c ed i re c t.c omj o u r n a l h o m e p a g e :w w w.e l s e v i e r.c o m /l o c a t e /e c o l e n gPlant-biofilm oxidation ditch for in situ treatm ent of polluted watersQi-Tang Wu a ,∗,Ting Gao a ,Shucai Zeng a ,Hong Chua ba College of Natural Resources and Environment,South China Agricultural University,Guangzhou 510642,ChinabDepartment of Civil and Structural Engineering,Hong Kong Polytechnic University,Hung Hom,Kowloon,Hong Kong SAR,Chinaa r t i c l ei n f o Article history:Received 17December 2005Received in revised form 16May 2006Accepted 18May 2006Keywords:Plant-biofilm oxidation ditch (PBFODIn situWastewater treatmenta b s t r a c tEutrophication of surface water bodies is a problem of increasing environmental and ecolog-ical concern worldwide and is particularly serious in China.In the present study,oxidation ditches were connected to a lake receiving municipal sewage sludges.T wo 24m 2(width 2m,length 12mparallel plastic oxidation ditches material were installed on a lake near the inlet of the municipal sewage.Zizania caduciflora and Canna generalis were grown in the ditches with plastic floating supporters for the removal of N and P from the sewage.The experiment was conducted firstly with municipal sewage in autumn–winter seasons for about 150daysunder the following conditions:2m 3/h influent flow,0.75kW jet-flow aerator(air/water of 5,18h HRT (hydrological retention timeand a return ratio of 10.Then it was run with the polluted lake water in summer–autumn for about 160days with an aerator of 1.25kW and an influent of 6m 3/h (air/water 3.3,HRT 6h.The performance was quite stable during the experimental period for the municipal sewage treatment.The average removal rates of COD (chemical oxygen demand,SS (suspended solids,TP (total phosphorus,NH 4+-N and inorganic-N were 70.6,75.8,72.6,52.1and50.3%,respectively.For the polluted lake water treatment,the average concentrations of COD,NH 4+-N and TP were 42.7,13.1and 1.09mg/L,respectively,in the influent and were 25.1,6.4and 0.38mg/L,respectively,in the effluent.The capacity of the plants to remove N and P by direct uptake was limited,but the indi-rect mechanisms also occurred.The proposed process,transforming the natural lake into a wastewater treatment plant,could evidently reduce the costs of the sewage collection,the land space requirement and the construction compared with conventional sewage treat-ment plants,and is especially suited to conditions in south China and south-east Asia.©2006Elsevier B.V .All rights reserved.1.IntroductionMany water bodies are subject to eutrophication due to eco-nomic constraints in reducing point sources of nutrients and/or to a high proportion of diffuse sources,and the prob-lem is particularly common in China because the proportion of treated municipal sewage is still low due to the relatively high capital investmentrequired.Accordingly,43.5%of 130investi-gated major lakes in China were found to be highly eutrophied∗Corresponding author .Tel.:+862085280296;fax:+862085288326.E-mail address:qitangwu@ (Q.-T.Wu.and 45%were of intermediate status (Li et al.,2000.These pol-luted lakes were mainly located in economically developed regions and especially around cities where large amounts of municipal sewage are discharged without appropriate treat-ment.Increasingly,natural or constructed wetlands,including buffer zones(Correll,2005,are being used for removal of pol-lutants from wastewater or for treatment of stormwater runoff from agricultural land and other non-point sources (Mitsch ete c o l o g i c a l e n g i n e e r i n g28(2006124–130125Table1–COD and BOD5of the study lake sampled at three points for5days inMay2003COD(mg/LBOD5(mg/LBOD5/COD13May89.5135.700.4083.3334.500.4189.5136.600.4114May55.5624.800.4589.5135.200.3949.3820.900.4227May105.1141.300.3981.0832.300.40111.1141.000.3728May60.0026.830.4563.3327.700.4463.3327.000.4329May90.0035.700.4093.3337.000.40117.9949.400.42al.,2000;Coveney et al.,2002;Belmont et al.,2004.However, this method requires a large land area in addition to the lake in question.For in situ treatment of hypereutrophic water bodies where the transparency of the water does not allow regrowth of submerged macrophytes,phosphorus precipitation in eutrophic lakes by iron application(Deppe and Benndorf, 2002or by additions of lime(Walpersdorf et al.,2004has been reported.Aeration of river water has been employed to remediate polluted rivers since the1970s(Wang et al.,1999. Increasing oxygen transfer inflow by stones placed in rivers was studied by Cokgor and Kucukali(2004.Growingfloating aquatic macrophytes(Sooknah and Wilkie,2004or terrestrial green plants usingfloating supports(Li and Wu,1997,physical ecological engineering(PEEN(Pu et al.,1998,and biotic addi-tives have also been applied(Chen,2003.However,these sim-ple designs do not constitute a real water treatment system and the efficiencies of these treatments are unsatisfactory.Activated sludge systems have been proved efficient treat-ing municipal sewage since the1960s(Ray,1995.However, this type of system has not been used for in situ remediation of polluted lakes or rivers.In the present study,the oxidation ditch technique was adopted on a lake receiving municipal sewage sludge.Floating green plants and the biofilms com-prisingfloating materials and plant roots were also added to enhance N and P removal.A pilot scale experiment was set up to test the feasibility and performance of the plant-enhanced oxidation ditch for in situ treatment ofboth the municipal sewage and the polluted lake water.2.Experimental2.1.Site descriptionThe study lake was situated at South China Agricultural Uni-versity,Guangzhou,China.The area of the lake was about 10000m2and the depth0.5–3m.This lake received the munic-ipal sewage from the residential area around the university.Fig.1–Surface arrangement of the plant-biofilm oxidation ditch and the waterflows.(1Wall of nylon tissue;(2nets of5mm;(3nets of0.25mm;(4oxidation ditch;(5jet-flow aerator;(6water pump;(7floating green plants;(8sewage entry.2.2.Establishment of the plant-biofilm oxidationditchesT wo24m2(width2m,length12mparallel oxidation ditches made of plastic materials were installed along the lake bank near the sewage inlet.The inner ditch was made of cement and the outer ditch was isolated with nylon tissues andfix-ing PVC(polyvinyl chloridetubes.Fig.1showsthe surface arrangement and the waterflow path.The coarse suspended solids in the influent werefiltered by two pl astic nets,one with a pore size of5mm and the other with a pore size of0.25mm,whereas the suspended solids in the effluent werefiltered by a plastic net with a pore size of 0.25mm.Zizania caduciflora and Canna generalis were grown in the ditch with theplast icfloating supporters which held the plants in position.Thefloating supporters were made of closed126e c o l o g i c a l e n g i n e e r i n g28(2006124–130PVC tubes and nylon nets and each was3.6m2.Zizania caduci-flora was grown on twofloating supporters an d Canna gener-alis on another two supporters.The plants were planted in four columns andfive lines.The twofloating supporters with Canna generalis were near the influent and the two with Zizania caduciflora were near the effluent.The entire disposal system is shown in Photo1.2.3.Conduct of the experimentsAn experiment was conductedfirstly on municipal sewage in autumn–winter seasons of2003–2004for about150days. The aeration of the oxidation ditch was achieved using a jet-flow aerator of0.75kW(Aqua Co.,Italy;air generation10m3/h, water jet rate22–28m3/h.The water sampling started on18 September2003and endedon12February2004.The influent was2m3/h created by a water pump of0.37kW.With the jet-flow aerator of0.75kW the theoretical air/water ratio was5, HRT was18h and the return ratio was10–13.The system was then run with the polluted lake water in summer and autumn2004for about160days with an aerator of1.25kW and with an influent of6m3/h(air/water3.3,HRT 6h.The influent was not created by water pump but by the driving fo rce of the jet-flow aerator.The water sampling for the second run started on15May2004and endedon15October 2004.2.4.Sampling and analysisThe influent and effluent were sampled every3–5days at 08:00–09:00a.m.andat17:00–18:00p.m.,each with three sam-pling re plicates for thefirst run.For the second run,the influ-ent and effluent were sampled1day a week.The water sam-pler took0–30cm surface water.The samples were analyzed for COD Cr,BOD5,SS,TP,NO3−-N,NH4+-N and pH according to standard methods(APHA,1995.The plant s were transplanted ontofloating supporters two weeks before water sampling and thefirst harvest was carried out60days later and at the termination of thefirst run for the municipal sewage.The plant biomass and N and P con-tents were measured according to the methods proposed by the Soil and Agro-Chemical Analysis Committee of China(Lu, 2000.The total uptakes of N and P were calculated and com-pared with the total removal of these elements calculated by the cumulative removal each day following measurement of a water sample.Total N removal=(average N in influent−average N in effluent×48×D iwhere48was the treated water volume per day in m3/day;D i was the number of days following the water sampling and before the next sampling.3.Results and discussionTable2shows the removal of COD Cr and SS by plant-biofilm oxidation ditch for the treatment of the municipal sewage in autumn–winter seasons of2003–2004.The removal of COD Cr varied from60to79%with an average of70%for the influent COD Cr ranging from100to200mg/L,a nd resulted in effluent COD Cr valuesfrom30to55mg/L(Table2,Fig.2.The average removal percentage was about75%for SS and variedfrom68to82%(Table2.The effluent SS was about 30mg/L which is the effluent limit value of the second grade for the sewage treatment plants in China(GB18918,2002 (Fig.3,for the influents varying from60to240mg/L.The average NH4+-N removal from influent was52%,which was lower in winter than in autumn(Table3.This may be due to lower bacterial activity in winter,but theinfluent NH4+-NTable2–Removal of COD and SS by the plant-biofilm oxidation ditch for the in situ treatment of municipal sewage each month in autumn–winter seasons of2003–2004Period Sampled days Water temperature(◦CInfluent(mg/LEffluent(mg/LRemoval(%COD Cr18–30September528.0118.54(3.01a34.34(7.8367.74 3–28October826.1123.91(4.0333.51(4.2672.661–7November326.0153.94(2.7337.60(3.8175.4918–28November423.1170.22(4.2835.45(5.3778.711–15December419.3180.36(8.2039.24(7.0677.6511–31January314.5128.46(3.6652.04(5.2359.504–12February216.8178.35(4.1662.86(5.8362.47Average150.54(4.3042.15(5.6370.60SS18–30September528.0160.4041.6074.18 3–28October826.1144.3826.2581.171–7November326.0116.0033.3370.7918–28November423.1111.7521.5080.981–15December419.390.5028.5068.4211–31January314.5104.0017.3382.384–12February216.8120.5033.0072.57Average121.0828.7975.78e c o l o g i c a l e n g i n e e r i n g28(2006124–130127Fig.2–COD in the influent and effluent of the plant-biofilm oxidation ditch for the in situ treatment of municipal sewage in autumn–winter seasons of2003–2004.was also higher in winter(Fig.4probably because of lower water consumption in the cold season.The total inorganic-N removal was similar to that for NH4+-N(Table3.NO3−-N concentrations were rather similar in the influent and the effluent.The total P removal varied from63to78%and was higher and more regular than N removal(Table3.The P concentra-tion in treated effluent was about1mg/L(Fig.5and conformed to the Chinese municipal sewage treatment standard which is set to3mg/L for second grade regions and1.5forfirst grade regions(GB18918,2002.Fig.6shows typical changes in the water quality param-eters for the sampling points from inlet to outlet.Thisindi-Fig.3–Suspended solids concentration in the influent and effluent of the p lant-biofilm oxidation ditch for the in situ treatment of municipal sewage in autumn–winter seasons of2003–2004.cates that COD and SS decreased gradually,but NH4+-N and TP dropped substantially following the mixing with the return water by the aerator and then decreased slowly,while NO3−-N and pH of the water remained virtually unchanged.The water DO increased dramatically following the aeration,decreased slowly thereafter and remained rather high even in the efflu-ent(about5.5mg/L.For the second run treating the polluted lake water on-site,the average influent COD Cr was42.7mg/L and the effluent 25.1mg/L for about160days during summer–autumn seasons (Fig.7.The removal of NH4+-N was about50%from about13.1 to6.4mg/L.Total-P in the effluents was rather stable,bei ngTable3–The removal of N and P by the plant-biofilm oxidation ditch for the in situ treatment of municipal sewage for each month in autumn–winter seasons of2003–2004Period Sampled days Water temperature(◦CInfluent(mg/LEffluent(mg/LRemoval(%NH4+-N18–30September528.020.60(0.30a7.16(0.2264.72 3–28October826.126.55(0.2310.15(0.2061.671–7November326.030.00(0.4113.67(0.2254.5118–28November423.135.15(0.7915.95(0.2653.991–15December419.335.89(0.3515.93(0.2755.1511–31January314.530.57(0.6918.59(0.2236.634–12February216.835.23(0.0521.61(0.0637.72Average30.57(0.4014.72(0.2152.06NH4+-N+NO3−-N18–30September528.023.06(0.159.24(0.1159.94 3–28October826.128.31(0.1212.01(0.1457.571–7November326.031.42(0.2114.58(0.1153.5918–28November423.136.32(0.4016.81(0.1353.721–15December419.337.41(0.1917.54(0.1453.1111–31January314.531.96(0.3720.07(0.1337.204–12February216.837.11(0.0323.35(0.0337.08Average32.23(0.2116.23(0.1150.32TP18–30September528.0 3.56(0.070.81(0.0475.56 3–28October826.1 4.01(0.140.87(0.0478.241–7November326.0 4.37(0.13 1.20(0.0472.5618–28November423.1 4.89(0.16 1.13(0.0776.661–15December319.5 4.86(0.80 1.38(0.2371.07 11–31January314.5 3.75(0.45 1.35(0.0363.32 4–12February216.8 4.75(0.10 1.51(0.0566.20 Average 4.31(0.16 1.16(0.0471.89128e c o l o g i c a l e n g i n e e r i n g 28(2006 124–130Fig.4–NH 4+-N concentration in the influent and effluent of the plant-biofilm oxidation ditch for the in situ treatment of municipal sewage in autumn–winter seasons of2003–2004.Fig.5–Total-P concentration in the influent and effluent of the plant-biofilm oxidation ditch for the in situ treatment of municipal sewage in autumn–winter seasons of2003–2004.Fig.6–T ypical changes in the pollutants in theplant-biofilm oxidation ditch during the in situ treatment ofFig.7–The influent and effluent concentrations of COD (up,NH 4+-N (medianand total-P (bottomin theplant-biofilm oxidation ditch treating polluted lake water.about 0.38mg/L from an average of 1.09mg/L in the influents.The removal of COD Cr ,NH 4+-N and Total-P was then quite sat-isfactory both for the municipal sewage and the polluted lake water.The removal of N and P was somewhat higher than con-ventional oxidation ditches,perhaps due to the existence of the plant-biofilm in the studiedsystem.However,the direct uptake rates of N and P by green plants were almost negligi-ble compared to the total removal of these elements by the whole system (Table4.However,the plants may have cre-ated localized anaerobic conditions by their root exudates and dead biomass and enhance the denitrification of N by micro-organisms as occurs in constructed wetlands (Hone,2000.Besides the green plants,the proposed system also con-tains biofilm coated to the plastic materials.The high velocity of return-fluent was different to the conventional oxidation ditch.Kugaprasatham et al.(1982showed that the increase of the fluent velocity could increase the density of the biofilm if the nutrient conditions were suitable for bacteria growth.Simultaneous nitrification/denitrification (SND(Van Mun ch etal.,1996may also occur in the system.Concerning the P removal of the system,biological phos-phate removal processes may occur but were not significant because there was no sludge removal and very little sludge precipitation after the run for treatment of municipal sewage.This may partly due to the existence of some ferric chains which were added to precipitate and fix the nylon tissue to the lake bottom,with formation of precipitates of ferric phos-e c o l o g i c a l e n g i n e e r i n g 2 8 ( 2 0 0 6 124–130 129 Table 4 – Proportions of N and P uptake by plants and total removal in the plant-biofilm oxidation ditch treating municipal sewage Date Days ZCa Harvested fresh biomass (g CG ZC 5 September–4 November 5 November–6 January Total or average a Plant uptake (g N CG 5.30 13.03 System removal (kg N CG P Percent of plant uptake N (% P (% P ZC 0.88 0.24 2.79 60 63 123 2200 625 9725 2750 4150 4.85 1.20 24.38 0.72 0.95 37.63 65.45 103.1 7.13 12.78 19.91 0.03 0.02 0.02 0.02 0.01 0.01 ZC: Zizania caduciflo ra; CG: Canna generalis. tained for at least 1 year. The actual mechanisms still remain to be identified. The oxidation ditch has been used for many years worldwide as an economical and efficient wastewater treatment technology that can remove COD, nitrogen and a fraction of the phosphorusefficiently. Anaerobic tanks (Liu et al., 2002 and phased isolation ditch systems with intra-channel clarifier (Hong et al., 2003 were added to the system to increase the TP removal efficiency. The proposed process takes an artificial process in combination with natural purification, transforming the natural lake into the wastewater treatment plant, and could evidently reduce the costs of sewage collection, the landspace requirement and the construction costs compared with the conventional sewage treatment plants. This process could be especially suitable to subtropical regions and to many water bodies in south China and southeast Asia where sewage treatment facilities are not well established. China. The authors are grateful to Dr. P. Christie, Department of Agricultural and Environmental Science, Queen’s University Belfast, UK, and Dr. Y. Ouyang, Department of Water Resources, St. Johns River Water Management District, Palatka, FL, USA, for their valuable suggestions and language corrections. references 4. Conclusions The present study adapted the oxidation ditch on the lake surface for in situ treatment of municipal sewage or polluted lake water in combination with plant biofilms for performing N and P removal, and running experiments at pilot scale for about 1.5 years resulted in the following observations: (1 The system was quite satisfactory and stable for treatment of municipal sewage and polluted lake water in removing COD, NH4 + -N and P. (2 The direct uptake of N and P by plants was negligible in comparison with the totalremoval by the system, but indirect mechanisms via plant root exudates and biofilms merit further studies. (3 The proposed process could dramatically reduce the costs of sewage collection, the land-space requirement and the construction costs compared with conventional sewage treatment plants; might be suitable for treatment of both municipal sewage and polluted lake water; and could lead to the promotion of wastewater treatment in many developing countries. Acknowledgements This study was funded by Department of Science and Technology of Guangdong Province (Grant no. 2004B33301007, American Public Health Association (APHA, 1995. Standards Methods for the Examination of Water and Wastewater, 19th ed. American Public Health Association, Washington, DC. Belmont, M.A., Cantellano, E., Thompson, S., Williamson, M.,S’anchez, A., Metcalfe, C.D., 2004. Treatment of domestic wastewater in a pilot-scale natural treatment system in central Mexico. Ecol. Eng. 23, 299–311. Chen, Y.C., 2003. Bioremediation Engineering of Polluted Environment. Chemical Industry Press, Beijing, p. 304 (in Chinese. Cokgor, S., Kucukali, S., 2004. Oxygen transfer in flow around and over stones placed in a laboratory flume. Ecol. Eng. 23, 205–219. Correll, D.L., 2005. Principles of planning and establishment of buffer zones. Ecol. Eng. 24, 433–439. Coveney, M.F., Stites, D.L., Lowe, E.F., Battoe, L.E., Conrow, R., 2002. Nutrient removal from eutrophic lake water by wetland filtration. Ecol. Eng. 19, 141–159. Deppe, T., Benndorf, J., 2002. Phosphorus reduction in a shallow hypereutrophic reservoir by in-lake dosage of ferrous iron. Water Res. 36, 4525–4534. Hone, A.J., 2000. Phytoremediation by constructed wetlands. In: Terry, N., Banuelos, G. (Eds., Phytoremediation of Contaminated Soil and Water. Lewis Publishers, pp. 13–40. Hong, K.H., Chang, D., Hur, J.M., Han, S.B., 2003. Novel phased isolation ditch system for enhanced nutrient removal and its optimal operating strategy. J. Environ. Sci. Health Part A 38, 2179–2189. Kugaprasatham, S., Nagaoka, H., Ohgaki, S., 1982. Effect of turbulence on nitrifying biofilms at non-limiting substrate conditions. Water Res. 26, 1629–1638. Li, F.X., Xin, Y., Chen, W., 2000. Assessment of eutrophication level of lakes. Chongqing Environ. Sci. 22, 10–11 (in Chinese. Li, F.B., Wu, Q.T., 1997.Domestic wastewater treatment with means of soilless cultivated plants. Chin. J. Appl. Ecol. 8, 88–92 (in Chinese. Liu, J.X., Wang, B.Z., van Groenestijn, J.W., Doddema, H.J., 2002. Addition of anaerobic tanks to an oxidation ditch system to enhance removal of phosphorus from wastewater. J. Environ. Sci. 14, 245–249.130 e c o l o g i c a l e n g i n e e r i n g 2 8 ( 2 0 0 6 124–130 Lu, R.K., 2000. Soil and Agricultural Chemistry Analysis. China Agriculture Press, Beijing (in Chinese. Mitsch, W.J., Horne, A.J., Nairn, R.W., 2000. Nitrogen and phosphorus retention in wetlands—ecological approaches to solving excess nutrient problems. Ecol. Eng. 14, 1–7. Pu, P., Hu, W., Yan, J., Wang, G., Hu, C., 1998. A physico-ecological engineering experiment for water treatment in a hypertrophic lake in China. Ecol. Eng. 10, 179–190. Ray, B.T., 1995. Environmental Engineering. PWS Publishing Company, New York, pp. 299–341. Sooknah, R.D., Wilkie, A.C., 2004. Nutrient removal by floating aquatic macrophytes cultured in anaerobically digested flushed dairy manure wastewater. Ecol. Eng. 22, 27–42. Van Munch, E.P., Land, P., Keller, J., 1996. Simultaneous nitrification and denitrification in bench-scale sequencing batch reactors. Water Sci. Technol. 20,277–284. Wang, C.X., Lin, H., Shi, K.H., 1999. Restoration of polluted river by pure oxygen aeration. Shanghai Environ. Sci. 18, 411–413 (in Chinese. Walpersdorf, E., Neumann, T., Stuben, D., 2004. Efficiency of natural calcite precipitation compared to lake marl application used for water quality improvement in an eutrophic lake. Appl. Geochem. 19, 1687–1698.。
学号: 10415104常州大学毕业设计(论文)外文翻译(2014届)外文题目Application of a combined UF/RO system for thereuse of filter backwash water from treated swimmingpool water译文题目混合超滤/反渗透系统在游泳池水处理的反冲洗水回用中的应用外文出处Desalination 178(2005) 41—49学生龙瑞娜学院环境与安全工程学院专业班级给水101班校内指导教师张凤娥专业技术职务教授校外指导老师专业技术职务二○一四年一月混合超滤/反渗透系统在游泳池水处理的反冲洗水回用中的应用Florian G. ReiBmann a*, Eva Schulze b, Volker Albrecht b"Institute for Urban Water Management, Dresden University of Technology, D-O1062Dresden, GermanyTel. +49 (351) 463-34687; Fax +49 (351) 463-37204; email:Florian.Reissmann@mailbox.tu-dresden.de bWassertechniseher Anlagenbau Plauen GmbH, Re~iger Gewerbering I1, D-08525 Plauen,GermanyReceived 15 October 2004; accepted 22 November 2004摘要:由于超滤、反渗透相结合的处理工艺的全面应用,把处理过的游泳池水重用作过滤器反冲洗水是有效的。
超滤处理表明滤料的缩小是十分重要的。
浊度值从5-25FNU下降至0.02FNU。
在这项研究中被调查的设备,90分钟就能实现过滤。
根据这样的结构,超滤设备达到了97%以上的效率。
外文翻译要求:1、外文资料与毕业设计(论文)选题密切相关,译文准确、质量好。
2、阅读2篇幅以上(10000字符左右)的外文资料,完成2篇不同文章的共2000汉字以上的英译汉翻译3、外文资料可以由指导教师提供,外文资料原则上应是外国作者。
严禁采用专业外语教材文章。
4、排序:“一篇中文译文、一篇外文原文、一篇中文译文、一篇外文原文”。
插图内文字及图名也译成中文。
5、标题与译文格式(字体、字号、行距、页边距等)与论文格式要求相同。
下页附:外文翻译与原文参考格式2英文翻译 (黑体、四号、顶格)外文原文出处:(译文前列出外文原文出处、作者、国籍,译文后附上外文原文)《ASHRAE Handbook —Refrigeration 》.CHAPTER3 .SYSTEM Practices for ammonia 3.1 System Selection 3.2 Equipment3.10 Reciprocating Compressors第3章 氨制冷系统的实施3.1 系统选择在选择一个氨制冷系统设计时,须要考虑一些设计决策要素,包括是否采用(1)单级压缩(2)带经济器的压缩(3)多级压缩(4)直接蒸发(5)满液式(6)液体再循环(7)载冷剂。
单级压缩系统基本的单级压缩系统由蒸发器、压缩机、冷凝器、储液器(假如用的话)和制冷剂控制装置(膨胀阀、浮球阀等)。
1997 ASHRAE 手册——“原理篇”中的第一章讨论了压缩制冷循环。
图1.壳管式经济器的布置外文翻译的标题与译文中的字体、字号、行距、页边距等与论文格式相同。
英文原文(黑体、四号、顶格)英文翻译2(黑体,四号,顶格)外文原文出处:(黑体,四号,顶格)P. Fanning. Nonlinear Models of Reinforced and Post-tensioned Concrete Beams. Lecturer, Department of Civil Engineering, University College Dublin. Received 16 Jul 2001.非线形模型钢筋和后张法预应力混凝土梁摘要:商业有限元软件一般包括混凝土在荷载做用下非线性反应的专用数值模型。
外文文献翻译原文Analysis of Con tin uous Prestressed Concrete BeamsChris BurgoyneMarch 26, 20051、IntroductionThis conference is devoted to the development of structural analysis rather than the strength of materials, but the effective use of prestressed concrete relies on an appropriate combination of structural analysis techniques with knowledge of the material behaviour. Design of prestressed concrete structures is usually left to specialists; the unwary will either make mistakes or spend inordinate time trying to extract a solution from the various equations.There are a number of fundamental differences between the behaviour of prestressed concrete and that of other materials. Structures are not unstressed when unloaded; the design space of feasible solutions is totally bounded;in hyperstatic structures, various states of self-stress can be induced by altering the cable profile, and all of these factors get influenced by creep and thermal effects. How were these problems recognised and how have they been tackled?Ever since the development of reinforced concrete by Hennebique at the end of the 19th century (Cusack 1984), it was recognised that steel and concrete could be more effectively combined if the steel was pretensioned, putting the concrete into compression. Cracking could be reduced, if not prevented altogether, which would increase stiffness and improve durability. Early attempts all failed because the initial prestress soon vanished, leaving the structure to be- have as though it was reinforced; good descriptions of these attempts are given by Leonhardt (1964) and Abeles (1964).It was Freyssineti’s observations of the sagging of the shallow arches on three bridges that he had just completed in 1927 over the River Allier near Vichy which led directly to prestressed concrete (Freyssinet 1956). Only the bridge at Boutiron survived WWII (Fig 1). Hitherto, it had been assumed that concrete had a Young’s modulus which remained fixed, but he recognised that the de- ferred strains due to creep explained why the prestress had been lost in the early trials. Freyssinet (Fig. 2) also correctly reasoned that high tensile steel had to be used, so that some prestress would remain after the creep had occurred, and alsothat high quality concrete should be used, since this minimised the total amount of creep. The history of Freyssineti’s early prestressed concrete work is written elsewhereFigure1:Boutiron Bridge,Vic h yFigure 2: Eugen FreyssinetAt about the same time work was underway on creep at the BRE laboratory in England ((Glanville 1930) and (1933)). It is debatable which man should be given credit for the discovery of creep but Freyssinet clearly gets the credit for successfully using the knowledge to prestress concrete.There are still problems associated with understanding how prestressed concrete works, partly because there is more than one way of thinking about it. These different philosophies are to some extent contradictory, and certainly confusing to the young engineer. It is also reflected, to a certain extent, in the various codes of practice.Permissible stress design philosophy sees prestressed concrete as a way of avoiding cracking by eliminating tensile stresses; the objective is for sufficient compression to remain after creep losses. Untensionedreinforcement, which attracts prestress due to creep, is anathema. This philosophy derives directly from Freyssinet’s logic and is primarily a working stress concept.Ultimate strength philosophy sees prestressing as a way of utilising high tensile steel as reinforcement. High strength steels have high elastic strain capacity, which could not be utilised when used as reinforcement; if the steel is pretensioned, much of that strain capacity is taken out before bonding the steel to the concrete. Structures designed this way are normally designed to be in compression everywhere under permanent loads, but allowed to crack under high live load. The idea derives directly from the work of Dischinger (1936) and his work on the bridge at Aue in 1939 (Schonberg and Fichter 1939), as well as that of Finsterwalder (1939). It is primarily an ultimate load concept. The idea of partial prestressing derives from these ideas.The Load-Balancing philosophy, introduced by T.Y. Lin, uses prestressing to counter the effect of the permanent loads (Lin 1963). The sag of the cables causes an upward force on the beam, which counteracts the load on the beam. Clearly, only one load can be balanced, but if this is taken as the total dead weight, then under that load the beam will perceive only the net axial prestress and will have no tendency to creep up or down.These three philosophies all have their champions, and heated debates take place between them as to which is the most fundamental.2、Section designFrom the outset it was recognised that prestressed concrete has to be checked at both the working load and the ultimate load. For steel structures, and those made from reinforced concrete, there is a fairly direct relationship between the load capacity under an allowable stress design, and that at the ultimate load under an ultimate strength design. Older codes were based on permissible stresses at the working load; new codes use moment capacities at the ultimate load. Different load factors are used in the two codes, but a structure which passes one code is likely to be acceptable under the other.For prestressed concrete, those ideas do not hold, since the structure is highly stressed, even when unloaded. A small increase of load can cause some stress limits to be breached, while a large increase in load might be needed to cross other limits. The designer has considerable freedom to vary both the working load and ultimate load capacities independently; both need to be checked.A designer normally has to check the tensile and compressive stresses, in both the top and bottom fibre of the section, for every load case. The critical sections are normally, but not always, the mid-span and the sections over piers but other sections may become critical ,when the cable profile has to be determined.The stresses at any position are made up of three components, one of which normally has a different sign from the other two; consistency of sign convention is essential.If P is the prestressing force and e its eccentricity, A and Z are the area of the cross-section and its elastic section modulus, while M is the applied moment, then where ft and fc are the permissible stresses in tension and compression.c e t f ZM Z P A P f ≤-+≤Thus, for any combination of P and M , the designer already has four in- equalities to deal with.The prestressing force differs over time, due to creep losses, and a designer isusually faced with at least three combinations of prestressing force and moment;• the applied moment at the time the prestress is first applied, before creep losses occur,• the maximum applied moment after creep losses, and• the minimum applied moment after creep losses.Figure 4: Gustave MagnelOther combinations may be needed in more complex cases. There are at least twelve inequalities that have to be satisfied at any cross-section, but since an I-section can be defined by six variables, and two are needed to define the prestress, the problem is over-specified and it is not immediately obvious which conditions are superfluous. In the hands of inexperienced engineers, the design process can be very long-winded. However, it is possible to separate out the design of the cross-section from the design of the prestress. By considering pairs of stress limits on the same fibre, but for different load cases, the effects of the prestress can be eliminated, leaving expressions of the form:rangestress e Perm issibl Range Mom entZ These inequalities, which can be evaluated exhaustively with little difficulty, allow the minimum size of the cross-section to be determined.Once a suitable cross-section has been found, the prestress can be designed using a construction due to Magnel (Fig.4). The stress limits can all be rearranged into the form:()M fZ PA Z e ++-≤1 By plotting these on a diagram of eccentricity versus the reciprocal of the prestressing force, a series of bound lines will be formed. Provided the inequalities (2) are satisfied, these bound lines will always leave a zone showing all feasible combinations of P and e. The most economical design, using the minimum prestress, usually lies on the right hand side of the diagram, where the design is limited by the permissible tensile stresses.Plotting the eccentricity on the vertical axis allows direct comparison with the crosssection, as shown in Fig. 5. Inequalities (3) make no reference to the physical dimensions of the structure, but these practical cover limits can be shown as wellA good designer knows how changes to the design and the loadings alter the Magnel diagram. Changing both the maximum andminimum bending moments, but keeping the range the same, raises and lowers the feasible region. If the moments become more sagging the feasible region gets lower in the beam.In general, as spans increase, the dead load moments increase in proportion to the live load. A stage will be reached where the economic point (A on Fig.5) moves outside the physical limits of the beam; Guyon (1951a) denoted the limiting condition as the critical span. Shorter spans will be governed by tensile stresses in the two extreme fibres, while longer spans will be governed by the limiting eccentricity and tensile stresses in the bottom fibre. However, it does not take a large increase in moment ,at which point compressive stresses will govern in the bottom fibre under maximum moment.Only when much longer spans are required, and the feasible region moves as far down as possible, does the structure become governed by compressive stresses in both fibres.3、Continuous beamsThe design of statically determinate beams is relatively straightforward; the engineer can work on the basis of the design of individual cross-sections, as outlined above. A number of complications arise when the structure is indeterminate which means that the designer has to consider, not only a critical section,but also the behaviour of the beam as a whole. These are due to the interaction of a number of factors, such as Creep, Temperature effects and Construction Sequence effects. It is the development of these ideas whichforms the core of this paper. The problems of continuity were addressed at a conference in London (Andrew and Witt 1951). The basic principles, and nomenclature, were already in use, but to modern eyes concentration on hand analysis techniques was unusual, and one of the principle concerns seems to have been the difficulty of estimating losses of prestressing force.3.1 Secondary MomentsA prestressing cable in a beam causes the structure to deflect. Unlike the statically determinate beam, where this motion is unrestrained, the movement causes a redistribution of the support reactions which in turn induces additional moments. These are often termed Secondary Moments, but they are not always small, or Parasitic Moments, but they are not always bad.Freyssinet’s bridge across the Marne at Luzancy, started in 1941 but not completed until 1946, is often thought of as a simply supported beam, but it was actually built as a two-hinged arch (Harris 1986), with support reactions adjusted by means of flat jacks and wedges which were later grouted-in (Fig.6). The same principles were applied in the later and larger beams built over the same river.Magnel built the first indeterminate beam bridge at Sclayn, in Belgium (Fig.7) in 1946. The cables are virtually straight, but he adjusted the deck profile so that the cables were close to the soffit near mid-span. Even with straight cables the sagging secondary momentsare large; about 50% of the hogging moment at the central support caused by dead and live load.The secondary moments cannot be found until the profile is known but the cablecannot be designed until the secondary moments are known. Guyon (1951b) introduced the concept of the concordant profile, which is a profile that causes no secondary moments; es and ep thus coincide. Any line of thrust is itself a concordant profile.The designer is then faced with a slightly simpler problem; a cable profile has to be chosen which not only satisfies the eccentricity limits (3) but is also concordant. That in itself is not a trivial operation, but is helped by the fact that the bending moment diagram that results from any load applied to a beam will itself be a concordant profile for a cable of constant force. Such loads are termed notional loads to distinguish them from the real loads on the structure. Superposition can be used to progressively build up a set of notional loads whose bending moment diagram gives the desired concordant profile.3.2 Temperature effectsTemperature variations apply to all structures but the effect on prestressed concrete beams can be more pronounced than in other structures. The temperature profile through the depth of a beam (Emerson 1973) can be split into three components for the purposes of calculation (Hambly 1991). The first causes a longitudinal expansion, which is normally released by the articulation of the structure; the second causes curvature which leads to deflection in all beams and reactant moments in continuous beams, while the third causes a set of self-equilibrating set of stresses across the cross-section.The reactant moments can be calculated and allowed-for, but it is the self- equilibrating stresses that cause the main problems for prestressed concrete beams. These beams normally have high thermal mass which means that daily temperature variations do not penetrate to the core of the structure. The result is a very non-uniform temperature distribution across the depth which in turn leads to significant self-equilibrating stresses. If the core of the structure is warm, while the surface is cool, such as at night, then quite large tensile stresses can be developed on the top and bottom surfaces. However, they only penetrate a very short distance into the concrete and the potential crack width is very small. It can be very expensive to overcome the tensile stress by changing the section or the prestress。
外文原文(一)Savigny and his Anglo-American Disciple s*M. H. HoeflichFriedrich Carl von Savigny, nobleman, law reformer, champion of the revived German professoriate, and founder of the Historical School of jurisprudence, not only helped to revolutionize the study of law and legal institutions in Germany and in other civil law countries, but also exercised a profound influence on many of the most creative jurists and legal scholars in England and the United States. Nevertheless, tracing the influence of an individual is always a difficult task. It is especially difficult as regards Savigny and the approach to law and legal sources propounded by the Historical School. This difficulty arises, in part, because Savigny was not alone in adopting this approach. Hugo, for instance, espoused quite similar ideas in Germany; George Long echoed many of these concepts in England during the 1850s, and, of course, Sir Henry Sumner Maine also espoused many of these same concepts central to historical jurisprudence in England in the 1860s and 1870s. Thus, when one looks at the doctrinal writings of British and American jurists and legal scholars in the period before 1875, it is often impossible to say with any certainty that a particular idea which sounds very much the sort of thing that might, indeed, have been derived from Savigny's works, was, in fact, so derived. It is possible, nevertheless, to trace much of the influence of Savigny and his legal writings in the United States and in Great Britain during this period with some certainty because so great was his fame and so great was the respect accorded to his published work that explicit references to him and to his work abound in the doctrinal writing of this period, as well as in actual law cases in the courts. Thus, Max Gutzwiller, in his classic study Der einfluss Savignys auf die Entwicklung des International privatrechts, was able to show how Savigny's ideas on conflict of laws influenced such English and American scholars as Story, Phillimore, Burge, and Dicey. Similarly, Andreas Schwarz, in his "Einflusse Deutscher Zivilistik im Auslande," briefly sketched Savigny's influence upon John Austin, Frederick Pollock, and James Bryce. In this article I wish to examine Savigny's influence over a broader spectrum and to draw a picture of his general fame and reputation both in Britain and in the United States as the leading Romanist, legal historian, and German legal academic of his day. The picture of this Anglo-American respect accorded to Savigny and the historical school of jurisprudence which emerges from these sources is fascinating. It sheds light not only upon Savigny’s trans-channel, trans-Atlantic fame, but also upon the extraordinarily*M.H.Hoeflich, Savigny and his Anglo-American Disciples, American Journal of Comparative Law, vol.37, No.1, 1989.cosmopolitan outlook of many of the leading American and English jurists of the time. Of course, when one sets out to trace the influence of a particular individual and his work, it is necessary to demonstrate, if possible, precisely how knowledge of the man and his work was transmitted. In the case of Savigny and his work on Roman law and ideas of historical jurisprudence, there were three principal modes of transmission. First, there was the direct influence he exercised through his contacts with American lawyers and scholars. Second, there was the influence he exercised through his books. Third, there was the influence he exerted indirectly through intermediate scholars and their works. Let us examine each mode separately.I.INFLUENCE OF THE TRANSLATED WORKSWhile American and British interest in German legal scholarship was high in the antebellum period, the number of American and English jurists who could read German fluently was relatively low. Even those who borrowed from the Germans, for instance, Joseph Story, most often had to depend upon translations. It is thus quite important that Savigny’s works were amongst the most frequently translated into English, both in the United States and in Great Britain. His most influential early work, the Vom Beruf unserer Zeitfur Rechtsgeschichte und Gestzgebung, was translated into English by Abraham Hayward and published in London in 1831. Two years earlier the first volume of his History of Roman Law in the Middle Ages was translated by Cathcart and published in Edinburgh. In 1830, as well, a French translation was published at Paris. Sir Erskine Perry's translation of Savigny's Treatise on Possession was published in London in 1848. This was followed by Archibald Brown's epitome of the treatise on possession in 1872 and Rattigan's translation of the second volume of the System as Jural Relations or the Law of Persons in 1884. Guthrie published a translation of the seventh volume of the System as Private International Law at Edinburgh in 1869. Indeed, two English translations were even published in the far flung corners of the British Raj. A translation of the first volume of the System was published by William Holloway at Madras in 1867 and the volume on possession was translated by Kelleher and published at Calcutta in 1888. Thus, the determined English-speaking scholar had ample access to Savigny's works throughout the nineteenth century.Equally important for the dissemination of Savigny's ideas were those books and articles published in English that explained and analyzed his works. A number of these must have played an important role in this process. One of the earliest of these is John Reddie's Historical Notices of the Roman law and of the Progress of its Study in Germany, published at Edinburgh in 1826. Reddie was a noted Scots jurist and held the Gottingen J.U.D. The book, significantly, is dedicated to Gustav Hugo. It is of that genre known as an external history of Roman law-not so much a history of substantive Roman legal doctrine but rather a historyof Roman legal institutions and of the study of Roman law from antiquity through the nineteenth century. It is very much a polemic for the study of Roman law and for the Historical School. It imparts to the reader the excitement of Savigny and his followers about the study of law historically and it is clear that no reader of the work could possibly be left unmoved. It is, in short, the first work of public relations in English on behalf of Savigny and his ideas.Having mentioned Reddie's promotion of Savigny and the Historical School, it is important to understand the level of excitement with which things Roman and especially Roman law were greeted during this period. Many of the finest American jurists were attracted-to use Peter Stein's term-to Roman and Civil law, but attracted in a way that, at times, seems to have been more enthusiastic than intellectual. Similarly, Roman and Civil law excited much interest in Great Britain, as illustrated by the distinctly Roman influence to be found in the work of John Austin. The attraction of Roman and Civil law can be illustrated and best understood, perhaps, in the context of the publicity and excitement in the English-speaking world surrounding the discovery of the only complete manuscript of the classical Roman jurist Gaius' Institutes in Italy in 1816 by the ancient historian and German consul at Rome, B.G. Niebuhr. Niebuhr, the greatest ancient historian of his time, turned to Savigny for help with the Gaius manuscript (indeed, it was Savigny who recognized the manuscript for what it was) and, almost immediately, the books and journals-not just law journals by any means-were filled with accounts of the discovery, its importance to legal historical studies, and, of course, what it said. For instance, the second volume of the American Jurist contains a long article on the civil law by the scholarly Boston lawyer and classicist, John Pickering. The first quarter of the article is a gushing account of the discovery and first publication of the Gaius manuscript and a paean to Niebuhr and Savigny for their role in this. Similarly, in an article published in the London Law Magazine in 1829 on the civil law, the author contemptuously refers to a certain professor who continued to tell his students that the text of Gaius' Institutes was lost for all time. What could better show his ignorance of all things legal and literary than to be unaware of Niebuhr's great discovery?Another example of this reaction to the discovery of the Gaius palimpsest is to be found in David Irving's Introduction to the Study of the Civil Law. This volume is also more a history of Roman legal scholarship and sources than a study of substantive Roman law. Its pages are filled with references to Savigny's Geschichte and its approach clearly reflects the influence of the Historical School. Indeed, Irving speaks of Savigny's work as "one of the most remarkable productions of the age." He must have been truly impressed with German scholarship and must also have been able to convince the Faculty of Advocates, forwhom he was librarian, of the worth of German scholarship, for in 1820 the Faculty sent him to Gottingen so that he might study their law libraries. Irving devotes several pages of his elementary textbook on Roman law to the praise of the "remarkable" discovery of the Gaius palimpsest. He traces the discovery of the text by Niebuhr and Savigny in language that would have befitted an adventure tale. He elaborates on the various labors required to produce a new edition of the text and was particularly impressed by the use of a then new chemical process to make the under text of the palimpsest visible. He speaks of the reception of the new text as being greeted with "ardor and exultation" strong words for those who spend their lives amidst the "musty tomes" of the Roman law.This excitement over the Verona Gaius is really rather strange. Much of the substance of the Gaius text was already known to legal historians and civil lawyers from its incorporation into Justinian's Institutes and so, from a substantive legal perspective, the find was not crucial. The Gaius did provide new information on Roman procedural rules and it did also provide additional information for those scholars attempting to reconstruct pre-Justinianic Roman law. Nevertheless, these contributions alone seem hardly able to justify the excitement the discovery caused. Instead, I think that the Verona Gaius discovery simply hit a chord in the literary and legal community much the same as did the discovery of the Rosetta Stone or of Schliemann’s Troy. Here was a monument of a great civilization brought newly to light and able to be read for the first time in millenia. And just as the Rosetta Stone helped to establish the modern discipline of Egyptology and Schliemann's discoveries assured the development of classical archaeology as a modern academic discipline, the discovery of the Verona Gaius added to the attraction Roman law held for scholars and for lawyers, even amongst those who were not Romanists by profession. Ancillary to this, the discovery and publication of the Gaius manuscript also added to the fame of the two principals involved in the discovery, Niebuhr and Savigny. What this meant in the English-speaking world is that even those who could not or did not wish to read Savigny's technical works knew of him as one of the discoverers of the Gaius text. This fame itself may well have helped in spreading Savigny's legal and philosophical ideas, for, I would suggest, the Gaius "connection" may well have disposed people to read other of Savigny's writings, unconnected to the Gaius, because they were already familiar with his name.Another example of an English-speaking promoter of Savigny is Luther Stearns Cushing, a noted Boston lawyer who lectured on Roman law at the Harvard Law School in 1848-49 and again in 1851- 1852.Cushing published his lectures at Boston in 1854 under the title An Introduction to the Study of Roman Law. He devoted a full chapter to a description of the historical school and to the controversy betweenSavigny and Thibaut over codification. While Cushing attempted to portray fairly the arguments of both sides, he left no doubt as to his preference for Savigny's approach:The labors of the historical school have established an entirely new and distinct era in the study of the Roman jurisprudence; and though these writers cannot be said to have thrown their predecessors into the shade, it seems to be generally admitted, that almost every branch of the Roman law has received some important modification at their hands, and that a knowledge of their writings, to some extent, at least, is essentially necessary to its acquisition.译文(一)萨维尼和他的英美信徒们*M·H·豪弗里奇弗雷德里奇·卡尔·冯·萨维尼出身贵族,是一位出色的法律改革家,也是一位倡导重建德国教授协会的拥护者,还是历史法学派的创建人之一。
本科毕业设计(论文)外文翻译译文学生姓名:院(系):油气资源学院专业班级:物探0502指导教师:完成日期:年月日地震驱动评价与发展:以玻利维亚冲积盆地的研究为例起止页码:1099——1108出版日期:NOVEMBER 2005THE LEADING EDGE出版单位:PanYAmericanYEnergyvBuenosYAiresvYArgentinaJPYBLANGYvYBPYExplorationvYHoustonvYUSAJ.C.YCORDOVAandYE.YMARTINEZvYChacoYS.A.vYSantaYCruzvYBolivia 通过整合多种地球物理地质技术,在玻利维亚冲积盆地,我们可以减少许多与白垩纪储集层勘探有关的地质技术风险。
通过对这些远景区进行成功钻探我们可以验证我们的解释。
这些方法包括盆地模拟,联井及地震叠前同时反演,岩石性质及地震属性解释,A VO/A V A,水平地震同相轴,光谱分解。
联合解释能够得到构造和沉积模式的微笑校正。
迄今为止,在新区有七口井已经进行了成功钻探。
基质和区域地质。
Tarija/Chaco盆地的subandean 褶皱和冲断带山麓的中部和南部,部分扩展到玻利维亚的Boomerange地区经历了集中的成功的开采。
许多深大的泥盆纪气田已经被发现,目前正在生产。
另外在山麓发现的规模较小较浅的天然气和凝析气田和大的油田进行价格竞争,如果他们能产出较快的油流而且成本低。
最近发现气田就是这种情况。
接下来,我们赋予Aguja的虚假名字就是为了讲述这些油田的成功例子。
图1 Aguja油田位于玻利维亚中部Chaco盆地的西北角。
基底构造图显示了Isarzama背斜的相对位置。
地层柱状图显示了主要的储集层和源岩。
该油田在Trija和冲积盆地附近的益背斜基底上,该背斜将油田和Ben i盆地分开(图1),圈闭类型是上盘背斜,它存在于连续冲断层上,Aguja有两个主要结构:Aguja中部和Aguja Norte,通过重要的转换压缩断层将较早开发的“Sur”油田分开Yantata Centro结构是一个三路闭合对低角度逆冲断层并伴随有小的摆幅。
哈尔滨工业大学学报(英文版),第11卷第3号,2004中国建筑行业中FIDIC合同条件和其新的应用前景何伯森管理学院,天津大学,天津300072.中国摘要:本文中,作者给出了一个FIDIC合同条件的演变简介。
特别是1999年新版本的背景。
一个详细的关于FIDIC合同条件的应用条件被做出.。
这个新版本包括六个方面:现有的示范合同形式的修改;找到解决拖欠问题;崇尚的设计/建造及EPC交钥匙工程项目采购模式;澄清监理工程师和开放的工程。
这个文件也准备在中国形成小项目,通过这个合同范本提高解决建筑工程争端的速度。
关键词:FIDIC合同,条件的合同,施工监理,施工图设计/建造及争端的解决管理是一门科学,需要不断总结,在实践中体验发展和创新。
在国际工程项目合同中,合同条件的作用最大。
在合同执行中提供各方的权利、义务和责任,表明了他们的重要性。
在过去的半个世纪中,国际咨询工程师联合会(FIDIC)一直致力于管理文件汇编的工作。
在各类合同条件中FIDIC合同条件具有最高大的影响力,是最流行的合同文本。
关于土木工程建设的FIDIC合同条件的第一版于1957年编制,接下来的二、三、四版分别于1963年、1977年、1987年出版。
但是,这些文件大多是关于土木工程师学会(ICE)的相关文件。
FIDIC合同和欧洲国际承包商(EIC)委托人员在大学读书,从以前文件中总结经验,并吸取经验教训。
随着政府、雇主、承建商及顾问工程师调查世纪各地的关于关于他们对“红皮书”的应用,报告显示了204个结果,根据这些结果,FIDIC合同委员会组织了一个专家小组,编译了21世纪新的合同条件的应用模板。
这些模板试验版出版于1988年,FIDIC在世界各地用更多的时间征求意见的官方文本发表于1999年。
新的正是文本包括FIDIC建设、(新红皮书)合同条件、FIDIC合同条件设备的设计/建造(新黄皮书)、EPC交钥匙FIDIC合同条件的项目(银皮书)、FIDIC合同精简版(绿皮书)。
FIDIC在合同管理方面对各当事人提出了更高的要求。
鲁布革水电站引水隧洞的工程水利电站是中国第一次运用FIDIC合同条件的项目,并获得世界银行的贷款。
不久以后,这些合同条件也成为世界银行、亚洲开发银行为各项目贷款的条件,被应用了很多次,其中也包括很多外国项目。
同时,中国部委(建设部、水利部、国家电力公司)编制了符合自身特点的建设项目合同模式,编制时,FIDIC合同“红皮书”是一个主要参考依据。
另外,FIDIC合同条件已经在各种培训过程中被学习、监督和指导。
红皮书已经被当做是工程管理人员的培训材料。
谁能熟练的掌握这些理论、思想和方案,其他人就应该从那里学习一些相关的知识和技能。
FIDIC合同特点的条件(99新版)1.1统一条款和条款新版“红皮书”、“黄皮书”和“银皮书”是由FIDIC合同委员会工作小组领导起草的。
由二十个条款被列入旧版的合同,新版的合同形式没有受到旧合同格式的影响。
因此,如果能够统一条款的内容,它们将会有相同的标题和表达方式。
在这三本书中,超过80%的内容是一致的,85%的定义和表达式是一致的。
它对我们去更好的理解它们提供了很大的帮助,节省了研究时间。
1.2广泛应用当这些新的合同条件被起草,FIDIC尽最大的努力使它不仅适用于英法体系,而且适用于公民的法律。
为了追求这个目标,合同工作小组中有一个律师出席去复核这些条款,使这些合同条款能够同时适用于两种法律体系。
新版本还显示出了更大的灵活性和适用性。
例如,在旧的版本中,履约担保是必要的,而这个履约担保在世界银行有不同的解释和意见。
然而在新的版本中,履约形式在特殊条款中被列出,可让雇主由更大的灵活性。
1.3根据不同项目交付的适用性与承包制在“新红皮书”中省略了术语“土木工程”,这就意味着这个红皮书可以应用于任何工程建设合同。
“新黄皮书”中总价承包工程的承包者,在这个合同中,承包商参与设计工作。
“银皮书”适用于基础设施和大型工厂,在承包过程中有更多的工作需要和风险,而雇主的参与(私人资金或政府融资)是很少部分的,属于交钥匙工程,但它严格定义在投资和建设时期。
在校正以后也能够应用在BOT项目中。
“绿皮书”可用于各类小规模的项目。
总之,这四个合同合同条件可以使用几乎所有类型的项目,能过进行合同管理和简单的咨询和设计。
1.4高品质条款的规定和逻辑测序相较于原来的“红皮书”,新红皮书由163个条款,将近40%的条款是最新的编制。
对另外的40%进行了修改,并给予补充,只有20%是完全的保留旧版本。
旧版本中条款采用ICE的格式是无序的,在新版本中,相关的子条款尽可能的并入一个条款,方便用户的需求。
1.5更多有关的权利和义务的具体规定合同双方以雇主的违约条款为例,我们可以看到,在合同的“红皮书”中有三个要点是最新加入的,其中两个是与付款有关的,上面显示了雇主的严格要求。
然而,承包商应当建立一个质量保证体系,并将执行前的审核系统的任何方面的东西提交给工程师。
每月的进度报告应当在每个月由承包商向工程师提交,否则,赔款不能被支付。
任何形式的贿赂都可能导致承包商的违约。
以上都是对承包商的较高。
1.6在准备风格的变化的要求旧版本的通用条款是相当简洁的,一些推荐的条款都在专用条款中被给出。
然而在新版本中,新版本的作者认为:比起自己将他们写入专用条款中,删掉这些条款对于用户来说是更加方便的。
1.7简练的语言在新版本的语言和句子结构都比较容易理解,对好多母语不是英语的人有很大的帮助。
2.FIDIC合同条件(99新版)在中国的应用前景过去的十年,在全世界工程项目管理领域中,FIDIC合同条件(99新版)总结了新的发现和体验。
必须将国际管理中新的理论引进中国的项目管理,指导创新能力。
我们应该努力学习总结近20年来项目管理的经验,并在此基础上不断创新,使我们的项目管理水平达到新的高度。
2.1要修改下传统项目管理系统的合约模式通过对鲁布革经验的研究,国际上传统的项目管理模式,普遍被应用在中国项目管理工程中。
通过多年的投入建设传统模式经验的积累,中国部委修订的FIDIC“新红皮书”参考现有合同模式是有必要的。
新版本具有合同的词语,由更清晰和更严格的赔偿的程序,并在知识产权保护的重点规范方面有很多先进的理念和法规。
2.2为了解决支付问题,借鉴世界广泛的经验据报道,背后支付和工程单位之间的债务,中国已经高达280亿人民币,其中大部分是给承包商的赔款,这个问题已经极大的影响了施工等企业的合作,他们的经济实力已经逐步减弱,如果以这种方式,长此以往,许多优秀的企业将被销毁。
所以市场需要一个法律体系去提供一个自由和公平的竞争。
由于雇主的财务空缺或者承包商融资,在国外也有很多问题,一些条文和规定也被新加入了新版FIDIC合同条件。
1)雇主的财务安排雇主应在收到承包商任何合理的证据要求后28天内给予答复,告诉他们财务安排已经取得了进展。
如果雇主打算对财务安排做出任何重大改变,应通知承包商提供详细资料。
如果雇主没有按照本条款执行,承包后可给予雇主21天的答复时间,在这期间,暂停或减少生产过程作为一种警告。
如果承包商在发出警告后42天内没有收到任何合理的财务安排,就有权终止合同,因为这是雇主的违约。
承包商还可以得到所有的补偿,即在雇主违约的条件下获得赔偿。
2)在合同中定义了当发包人支付款延误时应该如何处理如果承包商在每个月初向雇主提交月账单后的56天内没有收到付款(根据支付证书和临时支付证书),承包商有权在每月的延误时间内收取未付款的利息。
这些融资变化应在付款过中央银行贴现率3个百分点的基础上计算,如果承包商在上述届满56天后的42天内没有收到付款,承包商有权终止合同。
3)承包商贷款项目的实施它被作为一个建筑商融资的例子在专用条款中设立,其中它定义如果这是建筑商融资并且在工程中已经被承认,业主应该在双方签订合同协议书后的28天内给承包商发出一份履约担保。
如果承包商没有得到保证,工程师不得发出通知开始。
在担保中,如果雇主未能在合同中已作出规定期限届满之日起14天内支付,承包商有权根据证书要求银行付款,承包商的签字和盖章必须由银行或公证人认证。
为了解决项目中的背后资金的问题,我们应借鉴国际经验,并作出更深入的规定去严格管理、应用和建立项目。
当有关法律被修改或作出和有关部委编制的规定,新版FIDIC合同条件和合同法将为以后支付问题指出方向。
2.3为了认真贯彻设计/建造及EPC交钥匙总承包模式在拟定的99个新的版本中,FIDIC自出版来,除了“新黄皮书”和“银皮书”独立外,其他的版本都满足国际项目管理模式的发展趋势。
在1993年,英国的建筑协会就上述三种模式在西方发达国家做了一个应用统计分析和预测,结果显示它们有相同的趋势。
在设计/建造模式下,一般设计、建造承包商对工程质量负责,因为这个原因,使得其市场份额逐年上升,在雇主中是比较受欢迎的模式。
设计/建造总承包模式在1984年首先在中国应用,根据遍布中国大陆的工程公司和22个专业设计院的从1993年到2001年的不完全统计,一般国内承包合同的金额已经达到了3409,总金额已经达到255000万元人民币,我国海外工程总承包合同金额已经达到123,金额为2500亿美元。
在2003年初,建设部颁发了一个大纲名称叫做“对工程总承包和项目管理与发展的指导意见”,讨论贯彻了一般合同的重要性,建议将一般合同放到合格的工程总承包中,指引鼓励有资格的企业发展总承包,并且将总承包工作做好。
设计/建设及EPC交钥匙在中国进行的时间已经超过了10年,但其规模很小,并且这种管理工作也不规范,一直没有正式的合同示范总承包模式,因此,我们应当组织我们的专家在此基础上,根据我们自己的经验做出自己的相关合同模式,在FIDIC中参考“新黄皮书”和“银皮书”对于工程总承包的发展是必要的。
2.4要明确建造中的地位监理工程师,提高他们的工作责任心,开拓新的工作区1)建设监理制度被引进中国已经15年,并且在中国已经实现了强大的工作小组,工作组的监督工作是如此重要,所以它在未来在工程建设中将会扮演一个重要的角色。
建设监理属于工程咨询,所以它在现场是由顾问工程师/建筑师率领。
工程监理工程师既不是决策者,也不是业主的代理人。
工程监理工程师是业主在项目管理公司雇佣的,在中国的建筑市场起着监督的作用。
2)在FIDIC的“新红皮书”中,工程师对于承包商的义务在红皮书中是相同的,但他需要工程师及时、明确的解决问题。
在新红皮书中,赋予了工程师更高的地位和更大的权利。
例如,不经过承包商的同意,业主没有权利变换工程师或者在合同中明确规定的工程师的权利给予限制。
①明确工程师属于雇主的人员,虽然没有强调,它也是一个独立方。
②工程师做出的决定不会对公正造成更多的压力,但仍需要公平。