功耗仿真软件使用手册
- 格式:pdf
- 大小:386.51 KB
- 文档页数:13

Elite Power SimulatorUser Guide1 2 31 2 3onsemi’s online Elite Power Simulator Powered by •PLECS is a system level simulator that facilitates the modeling and simulation of complete systems with optimized device models for maximum speed and accuracy.PLECS is not a SPICE-based circuit simulator, where the focus is on low-levelbehavior of circuit components .•Power transistors are treated as simple switches that can be easily configured to demonstrate losses associated with conduction and switching transitions.•The PLECS models, referred to as “thermal models”, are composed of lookup tables for conduction and switching losses, along with a thermal chain in the form of a Cauer or Foster equivalent network.•During simulation, PLECS interpolates and/or extrapolates using the loss tables to get the bias point conduction and switching losses for the circuit operation./elite-power-simulatorElite Power Simulator FeaturesBroad Range ofCircuit Topologies Covering DC-DC, AC-DC, and DC-AC applications, including 32 circuit topologies in industrial (DC fast charging, UPS, ESS, solar inverters), automotive (OBC, traction), and non-traction spacesCorner SimulationCapability onsemi’s PLECS models go beyond nominal data from datasheets to include industry first corner simulation based on physical correlations in the manufacturing environment.Soft Switching Models onsemi provides industry first PLECS models valid for soft switchingapplications such as DC-DC LLC and CLLC Resonant, Dual Active Bridge, and Phase Shifted Full Bridge.Loss & Thermal DataPlottingExplore device conduction loss,switching energy loss, and thermalimpedance in a multifunctional 3Ddata visualization utility.Custom PLECS ModelUploadInterface with onsemi’s industry firstSelf-Service PLECS ModelGenerator(SSPMG) to simulate withmodels tailored to your application.Flexible Design &Fast Simulation ResultsFlexible to capture adjustments tovarious attributes such as, gate driveimpedance, cooling designs, andload profiling./elite-power-simulatoronsemi’s State-of-the-Art PLECS Models•Typical industry PLECS models are composed of measurement-based loss tables that are consistent with datasheets provided by the manufacturer.There are four major problems with this approach:1.The switching energy loss data is dependent on the parasitics of the measurements set ups and circuits.2.The conduction and switching energy loss data is limited and thus is often not dense enough to ensureaccurate interpolation and minimal extrapolation by PLECS.3.The loss data is based on nominal semiconductor process conditions only.4.The switching energy loss data comes from datasheet double pulse generated loss data. This means thePLECS models are only valid for hard switching topology simulation. The models are highly inaccurate if used in soft switching topology simulation.•onsemi’s Self-Service PLECS Model Generator (SSPMG) provides solutions to all four problems.•Ultimate power is delivered to the user to build PLECS models tailored for the user’s application. Unleash the power here: /self-plecs-generatorDeploying PLECS Models in Elite Power SimulatorCorner PLECS ModelsProcess ConditionR DSon , V th , BVCapacitance, Device RGConductionLossSwitching EnergyLossNominalNominal Nominal Nominal Nominal Best Case Conduction Loss, Worst Case Switching LossLow High Low High Worst Case Conduction Loss, Best Case Switching LossHighLowHighLow•Conventional PLECS models based on measurements are only valid for the typical or nominal process case in manufacturing. onsemi has developed accurate corner PLECS models based on real manufacturing distribution.•Physics dictates that worst case conduction and switching losses do not happen simultaneously for example.•Depending on the application, the influence of conduction and switching energy losses on the overall system performance will vary. The onsemi corner PLECS models provide the user the flexibility to investigate the entire correlated space.•Accurate corner and statistical modeling covered in detail in−SiC MOSFET Corner and Statistical SPICE Model Generation –Proceeding of International Symposium on Power Semiconductor Devices and ICs (ISPSD), pp. 154-147, September 2020•For Hard Switching , the conventional Double Pulse Test is the good method to calculate losses for models.•For Soft Switching , it depends on the topology and the operating mode (Transition or Switching)−The Double Pulse Test is NOT representative of SoftSwitching. Using double pulse switching energy losses in the simulation of a Soft Switching Topology is highly inaccurate.−A Soft Switching energy loss schematic is implemented in SSPMG to deliver Soft Switching models accurate for topologies such asDC-DC LLC and CLLC Resonant, Dual Active Bridge, Phase Shifted Full Bridge, othersHard vs. Soft Switching Energy LossesH a r d S w i t c h i n g S o f t S w i t c h i n gOutline of User Guide123Access Elite Power Simulator with MYON AccountMYON MyON is required to use the Elite Power SimulatorLoginReturning UserFirst Time UserAccess Through Direct Link or Product PageIn addition to direct access to the Elite Power Simulator/elite-power-simulatorAccess is available on each EliteSiC Product Page.Learn more about EliteSiC at/silicon-carbideOutline of User Guide123Step 1: Select Application and TopologyApplication choice filters the available topologiesBasic circuit schematic displayedTopologiesgrouped byconverter classStep 2: Select DeviceInputs used to filtervalid devicesChoose discretes ormodulesSelect device to move onto next step Direct datasheet downloadStep 3: Configure Device Set parallel devicesLink to product pageUpload custom PLECS model from onsemi’s Self-Service PLECS Model Generator (SSPMG)Set circuit RGSet deviceprocess corner condition View loss and thermal dataView Device Loss Data SelectMOSFET orBody DiodeToggle on/offtemperatures in 3D plotInteractive 3D plotToggle table datawith temperature View loss dataView Device Thermal Data View thermal chainStep 4: Configure Circuit ParametersSet Circuit parameters, varies by topologySet modulation scheme, varies by topologyStep 5: Configure CoolingSet Thermal interface resistanceConfigure Heat sink as ideal with fixed temperatureor input custom thermal impedanceCustom Heat Sink Thermal Impedance UtilityChoose Foster or Cauer formatwith automatic conversion featureUp to 5 rungs possibleToggle log/linear Y axisStep 6a: Run SimulationDetailed temperature, loss,and efficiency reportedPivot table,export csv LaunchSimulationStep 6b: View PlotsZooming and cursor featuresStep 6c: Compare Multiple Simulation CasesCompare•Device Selection•Device Configuration✓Corner process loss data✓SSPMG Model•Circuit Parameters•CoolingCompare Results Go back to steps 2, 3, 4, or 5 to make changesStep 7: Review Summary TableDownload PLECS ModelsHighlight rows to be print or downloaded to CSVLoad Profile SimulationTopologies with Load Profiling NPC inverter (1 phase, 3 level)NPC inverter (3 phase, 3 level)T-Type inverter (1 phase, 3 level)T-Type inverter (3 phase, 3 level)ANPC inverter (1 phase, 3 level)ANPC inverter (3 phase, 3 level)Inverter (3 phase, 2 level, grid load)Inverter (3 phase, 2 level, motor load)Traction Inverter (3 phase)•Load profile simulation enables power and thermal estimations at multiple, user-defined operating points •Simple intuitive flowLoad ProfileSet up parameter profilesSetupLinearrampingwhenstepped Set up time intervalschanges notenabledAdd orsubtracttimeintervals Real time plotting ofload profileparameters forinspection beforelaunching simulationLoad Profile Simulation Mission Profilesimulation button isenabled (orange)when any circuitparameter is enabledwith a load profileExample Load Profile Simulation ResultsLosses can be tracked over the load profileby enabling the cursor Junction TemperatureQuestion?Have questions, comments, or need support with your Self-Service PLECS Model Generator needs? We’re here to help! Write us an email at ********************.•Self-Service PLECS Model Generator: /self-plecs-generator•Elite Power Simulator: /elite-power-simulatorFollow Us @onsemi。

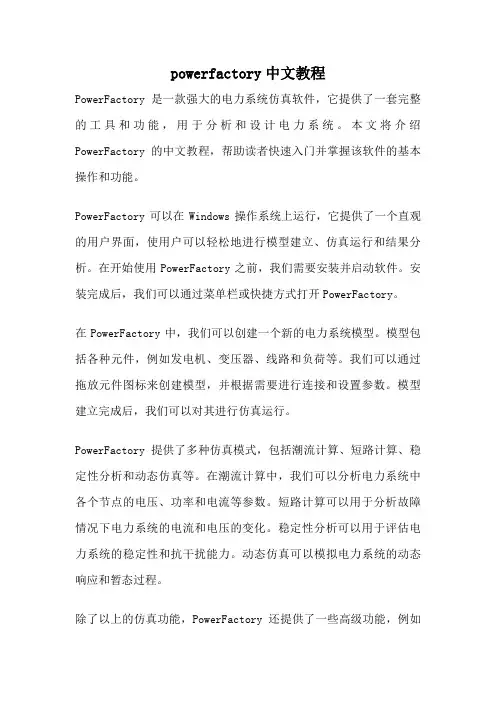
powerfactory中文教程PowerFactory是一款强大的电力系统仿真软件,它提供了一套完整的工具和功能,用于分析和设计电力系统。
本文将介绍PowerFactory的中文教程,帮助读者快速入门并掌握该软件的基本操作和功能。
PowerFactory可以在Windows操作系统上运行,它提供了一个直观的用户界面,使用户可以轻松地进行模型建立、仿真运行和结果分析。
在开始使用PowerFactory之前,我们需要安装并启动软件。
安装完成后,我们可以通过菜单栏或快捷方式打开PowerFactory。
在PowerFactory中,我们可以创建一个新的电力系统模型。
模型包括各种元件,例如发电机、变压器、线路和负荷等。
我们可以通过拖放元件图标来创建模型,并根据需要进行连接和设置参数。
模型建立完成后,我们可以对其进行仿真运行。
PowerFactory提供了多种仿真模式,包括潮流计算、短路计算、稳定性分析和动态仿真等。
在潮流计算中,我们可以分析电力系统中各个节点的电压、功率和电流等参数。
短路计算可以用于分析故障情况下电力系统的电流和电压的变化。
稳定性分析可以用于评估电力系统的稳定性和抗干扰能力。
动态仿真可以模拟电力系统的动态响应和暂态过程。
除了以上的仿真功能,PowerFactory还提供了一些高级功能,例如灵敏度分析、可靠性评估和优化设计等。
在灵敏度分析中,我们可以分析电力系统参数变化对结果的影响。
可靠性评估可以用于评估电力系统的可靠性和可用性。
优化设计可以帮助我们寻找最佳的电力系统配置和操作策略。
在PowerFactory中,我们还可以进行数据管理和结果分析。
PowerFactory支持多种数据格式,例如Excel、CSV和XML等。
我们可以导入和导出数据,进行数据处理和转换。
结果分析可以通过图表、报表和数据表格等方式展示和解释仿真结果。
PowerFactory是一款功能强大的电力系统仿真软件,它提供了丰富的工具和功能,用于分析和设计电力系统。
ultrasim的使用手册UltraSim使用手册一、简介1.1 UltraSim是什么UltraSim是一款先进的电子仿真软件,用于模拟和分析电路设计中的信号传输和电磁特性。
它是用于电子产品开发的重要工具,可以帮助工程师快速评估和改进设计,提高产品质量和性能。
1.2 UltraSim的主要特点- 强大的电路模拟能力,支持高精度的电路和信号传输仿真。
- 快速的仿真速度,能够处理大规模复杂电路设计。
- 灵活的数据分析和结果展示功能,便于用户对仿真结果进行深入分析。
二、安装和配置2.1 系统要求- 操作系统:Windows 7/8/10,Mac OS X,Linux等。
- 内存:建议至少8GB的内存空间。
- 存储空间:至少100GB的硬盘空间。
- 显卡:支持OpenGL 2:0及以上版本的显卡。
2.2 安装步骤UltraSim安装程序,并按照安装向导执行以下步骤:1:运行安装程序,选择安装路径。
2:执行必要的授权步骤,输入许可证密钥。
3:等待安装完成,启动UltraSim。
2.3 配置UltraSim在首次启动UltraSim时,您需要进行以下配置: 1:设置仿真器:选择适合您的仿真需求的仿真器。
2:设置工作目录:选择一个用于存储仿真结果和中间文件的目录。
3:配置仿真参数:设置仿真的时间范围、时钟频率等参数。
三、基本操作3.1 创建电路设计1:在UltraSim中创建新项目文件。
2:添加电路元件:包括电源、电阻、电容、电感和逻辑门等。
3:连接电路元件:使用线缆或导线连接各个元件。
3.2 设置仿真参数1:设定仿真时间范围:确定仿真所需模拟的时间范围。
2:配置时钟频率:指定时钟信号的频率。
3:设置输入信号:定义输入信号的波形和参数。
3.3 运行仿真1:运行按钮开始仿真。
2:观察仿真结果:包括电压波形、电流波形和逻辑状态等。
四、高级功能4.1 参数扫描1:设定扫描参数范围和步进值。
2:运行参数扫描仿真。
3:分析扫描结果,并相关报告。

IGBT损耗仿真软件使用说明IGBT损耗仿真软件是一种用于模拟和预测绝缘栅双极型晶体管(IGBT)损耗的软件工具。
IGBT是一种常用的功率半导体器件,广泛应用于各种交流和直流电源,电力变换以及电力电子应用中。
准确地预测和评估IGBT的损耗对设备的设计和性能至关重要。
以下是IGBT损耗仿真软件的使用说明:2.创建新项目:打开软件后,你可以选择“新建项目”创建一个新的仿真项目。
在项目名称和路径中输入所需的信息,并确保选择正确的IGBT模型和损耗模型。
4.设置仿真参数:在导入了IGBT模型后,你可以设置仿真参数,包括输入电压和电流波形、温度、开关频率等。
这些参数将影响到仿真结果的准确性和可靠性,因此需要根据实际情况进行设置。
5.运行仿真:在设置好了仿真参数后,你可以点击“运行仿真”按钮开始进行仿真。
软件将根据你所设定的参数和模型,模拟和计算出IGBT 的损耗情况。
仿真时间的长短取决于你设定的仿真时间和频率。
6.分析结果:仿真完成后,软件将生成一个仿真结果报告,其中包括IGBT的损耗值、电压和电流波形、温度分布等。
你可以通过查看报告来评估和分析IGBT的性能和损耗情况,以便进行进一步的改进和优化。
7.优化设计:根据仿真结果报告的分析,你可以确定IGBT的性能和损耗是否满足设计要求。
如果发现了性能不足或损耗过大的问题,你可以通过优化设计来改进。
这可能涉及到更换更适合的IGBT模型、调整电路设计、改变工作条件等。
8. 导出数据:除了报告之外,软件还可以导出仿真数据供进一步分析和处理。
你可以将数据导出为Excel或其他格式,以便在其他软件中进行更详细的分析。
总结:IGBT损耗仿真软件是一种强大的工具,能够帮助工程师准确地预测和评估IGBT的损耗情况。
然而,为了获得准确和可靠的仿真结果,需要正确设置仿真参数、导入合适的IGBT模型以及正确分析和优化设计。
希望以上的使用说明能够对你在使用IGBT损耗仿真软件时提供帮助。


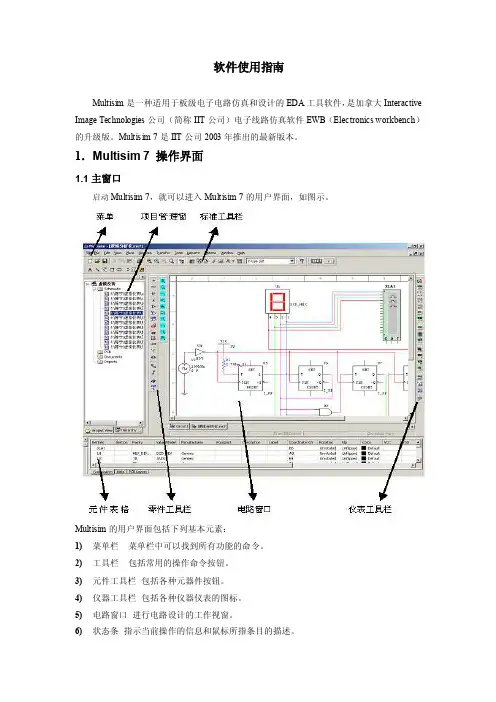
软件使用指南Multisim是一种适用于板级电子电路仿真和设计的EDA工具软件,是加拿大Interactive Image Technologies公司(简称IIT公司)电子线路仿真软件EWB(Electronics workbench)的升级版。
Multisim 7是IIT公司2003年推出的最新版本。
1.Multisim 7 操作界面1.1主窗口启动Multisim 7,就可以进入Multisim 7的用户界面,如图示。
Multisim的用户界面包括下列基本元素:1)菜单栏菜单栏中可以找到所有功能的命令。
2)工具栏包括常用的操作命令按钮。
3)元件工具栏包括各种元器件按钮。
4)仪器工具栏包括各种仪器仪表的图标。
5)电路窗口进行电路设计的工作视窗。
6)状态条指示当前操作的信息和鼠标所指条目的描述。
7)元件列表列出在电路窗口中出现的所有元件。
8)仿真开关启动、闭合电路的仿真。
2 建立电路2.1 开始建立电路文件运行Multisim,它会自动打开一个空白电路文件。
也可以单击按钮,新建一个空白电路文件。
2.2 在电路窗口中放置元件1)Multisim对元器件的管理Multisim以数据库的形式管理元器件,它提供了3种元件库:Multisim Master、User 和Corporate Library(仅在专业版提供)。
其中Multisim Master 库中存放的是系统本身提供的元器件,用户没有编辑权;User 库用于存放自己创建的元器件;Corporate Library 用于多人共同开发时存放共享的元器件。
电路中的元件可以来自其中任何库。
Multisim Master中的元件分为实际元件和虚拟元件。
实际元件的型号、参数、封装都与现实中实际的元件一致,采用实际元件可以使仿真结果与实际情况更接近。
虚拟元件不与实际元件相对应,使用时根据需要对参数值进行设置,其模型、符号等不能编辑,也没有封装形式,只用于仿真。
EWB电路仿真软件使用说明EWB电路仿真软件一、软件简介随着电子技术和计算机技术的发展,电子产品已与计算机紧密相连,电子产品的智能化日益完善,电路的集成度越来越高,而产品的更新周期却越来越短。
电子设计自动化(EDA)技术,使得电子线路的设计人员能在计算机上完成电路的功能设计、逻辑设计、性能分析、时序测试直至印刷电路板的自动设计。
EDA是在计算机辅助设计(CAD)技术的基础上发展起来的计算机设计软件系统。
与早期的CAD软件相比,EDA软件的自动化程度更高、功能更完善、运行速度更快,而且操作界面友善,有良好的数据开放性和互换性。
电子工作平台Electronics Workbench (EWB)(现称为MultiSim) 软件是加拿大Interactive Image Technologies公司于八十年代末、九十年代初推出的电子电路仿真的虚拟电子工作台软件,它具有这样一些特点:(1)采用直观的图形界面创建电路:在计算机屏幕上模仿真实实验室的工作台,绘制电路图需要的元器件、电路仿真需要的测试仪器均可直接从屏幕上选取;信号源库基本器件库二极管库模拟集成电路库指示器件库仪器库三、Electronics Workbench 基本操作方法介绍1.创建电路(1)元器件操作元件选用:打开元件库栏,移动鼠标到需要的元件图形上,按下左键,将元件符号拖拽到工作区。
元件的移动:用鼠标拖拽。
元件的旋转、反转、复制和删除:用鼠标单击元件符号选定,用相应的菜单、工具栏,或单击右键激活弹出菜单,选定需要的动作。
元器件参数设置:选定该元件,从右键弹出菜单中选Component Properties可以设定元器件的标签(Label)、编号(Reference ID)、数值(Value)和模型参数(Model)、故障(Fault)等特性。
说明:①元器件各种特性参数的设置可通过双击元器件弹出的对话框进行;②编号(Reference ID)通常由系统自动分配,必要时可以修改,但必须保证编号的唯一性;③故障(Fault)选项可供人为设置元器件的隐含故障,包括开路(Open)、短路(Short)、漏电(Leakage)、无故障(None)等设置。
cadence使用教程Cadence是一种电路设计和仿真软件,非常适合电子工程师用于电路设计和分析。
在本教程中,我们将介绍如何使用Cadence进行基本的电路设计和仿真。
首先,打开Cadence软件,并新建一个新项目。
请确保你已经安装了Cadence软件,并且拥有一个有效的许可证。
在新项目中,你需要定义电路的基本参数,如电源电压、电阻值等。
可以通过绘制原理图的方式来完成这些参数的定义。
在绘图界面中,你可以选择不同的元件,包括电源、电阻、电容、电感等。
你可以使用菜单栏中的工具来放置和连接这些元件。
一旦电路图绘制完成,你可以对电路进行仿真。
首先,需要选择合适的仿真器。
Cadence提供了多种仿真器,如Spectre和HSPICE。
选择一个适合你电路的仿真器,并设置仿真参数,如仿真时间、仿真步长等。
在仿真之前,你首先需要对电路进行布局。
布局涉及将电路中的元件放置在芯片上,并根据布线规则进行连接。
Cadence提供了强大的布局工具,可以帮助你完成这个过程。
完成布局后,你可以进行后仿真。
后仿真涉及将布局好的电路导入到仿真器中,并进行仿真分析。
你可以查看电路的性能指标,如电压、电流和功耗等。
除了基本的电路设计和仿真,Cadence还提供了其他功能,如噪声分析、温度分析和优化设计等。
你可以根据需要选择适合的功能。
总的来说,Cadence是一个功能强大的电路设计和仿真软件。
通过本教程,你可以学会如何使用Cadence进行基本的电路设计和仿真。
希望这对你的电子工程项目有所帮助。
电力系统仿真软件的使用方法电力系统是现代社会中不可或缺的基础设施,电力系统的稳定运行对于社会经济发展至关重要。
为了确保电力系统的可靠性和安全性,电力系统的仿真分析工作变得越来越重要。
而电力系统仿真软件则是进行仿真分析的重要工具之一。
本文将介绍电力系统仿真软件的使用方法,以帮助用户利用该软件进行电力系统的仿真分析。
一、安装电力系统仿真软件步骤1:从官方网站下载电力系统仿真软件的安装程序;步骤2:运行安装程序,按照提示完成软件的安装;步骤3:根据软件提供的许可证信息进行激活。
二、软件界面的主要组成部分电力系统仿真软件的界面一般包括以下主要部分:1. 菜单栏:提供各种软件功能的入口,例如文件管理、模型设置、仿真参数配置等;2. 工具栏:提供常用的功能按钮,方便用户快速执行特定操作;3. 绘图区:用于显示电力系统的拓扑结构、物理参数及仿真结果;4. 属性栏:显示当前选中元件或对象的属性信息,并提供相应的配置选项;5. 运行状态栏:显示仿真运行状态、进度等相关信息。
三、建立电力系统模型1. 导入或创建电力系统模型:可以从外部文件导入电力系统模型(如PSS/E、PSLF等格式),也可以直接在软件中创建电力系统模型;2. 定义电力系统元件:根据实际情况,选择并添加合适的电力系统元件,如变压器、发电机、传输线等;3. 连接电力系统元件:使用软件提供的连接功能,将各个电力系统元件按照其在实际电力系统中的连接关系进行连接。
四、配置仿真参数1. 选择仿真模式:根据需要选择仿真模式,如稳态仿真、暂态仿真、短路分析等;2. 设置仿真时间:根据仿真目的和要求,设定仿真的开始时间和结束时间;3. 定义负载情况:根据实际情况,设置电力系统的负载情况,如负载功率、负载模型等;4. 配置仿真计算参数:根据需要设置仿真的精度和收敛要求等。
五、运行仿真和分析仿真结果1. 运行仿真:点击软件界面上的“运行”按钮,启动仿真计算;2. 监视仿真过程:在仿真计算过程中,可以监视仿真的运行状态和进度,并根据需要进行调整;3. 分析仿真结果:仿真计算完成后,可以查看仿真结果,并进行进一步的分析。
verdi仿真入门使用技巧VerDI仿真软件是一款功能强大的电子设计自动化(EDA)工具,广泛应用于电子电路设计和验证。
本文将为您介绍Verdi仿真入门使用技巧,帮助您更快地上手这款软件,并充分发挥其在电路设计中的作用。
一、介绍Verdi仿真软件Verdi仿真软件是由德国公司Mentor Graphics开发的,适用于Windows操作系统。
它具有友好的用户界面,支持多种语言,包括中文。
Verdi的主要功能包括原理图编辑、仿真、布局和Gerber 文件生成等。
它能够帮助工程师快速地搭建电路、进行仿真验证,从而提高设计效率。
二、Verdi仿真入门基本操作1.创建项目:首先,打开Verdi软件,新建一个项目。
可以根据实际需求为项目命名,并选择项目路径。
2.添加元件:在元件库中,选择所需的元件,将其添加到项目中。
可以通过搜索框快速找到所需元件,或根据分类浏览库中的元件。
3.绘制原理图:将添加的元件放置在原理图编辑区域,用导线连接各个元件,形成完整的电路。
4.设置仿真参数:在仿真设置对话框中,选择所需的仿真算法、求解器类型等。
还可以设置仿真步长、收敛阈值等参数。
5.运行仿真:完成原理图绘制后,点击“运行”按钮,启动仿真。
Verdi会根据设定的参数进行仿真计算,并生成仿真结果。
三、Verdi仿真进阶技巧1.优化电路:在仿真结果中,可以查看电路的性能指标,如功耗、速度等。
针对不良性能,可以通过调整元件参数、重新布局等方法进行优化。
2.波形分析:仿真结果以波形图的形式展示。
可以通过放大、平移等操作分析波形,找出问题所在。
3.多种仿真类型:Verdi支持多种仿真类型,如直流仿真、交流仿真、瞬态仿真等。
根据需求选择合适的仿真类型,以满足不同场景的需求。
四、实践中的应用与建议1.在实际项目中,建议先进行简单的电路设计,逐步增加复杂度,以便更好地掌握Verdi软件。
2.多参考资料:在学习Verdi仿真时,可以参考相关书籍、教程和网络资源,提高学习效果。
IPOSIM - The Infineon Power Simulation program for loss and thermal calculation of Infineon power modules and disk devicesIPOSIM helps you to select the right Infineon bipolar modules or disk devices for your rectifier (B2, B6, M3.2 and M6) or AC switch (W1C and W3C) applications as well as suited IGBT modules for your inverter (single & three phase in 2-Level as well as 3-Level) or DC converter (buck and boost) applications.IPOSIM performs a calculation of switching and conduction losses for all components, taking into account conduction and switching losses as well as thermal ratings. Where applicable, different control algorithms can be applied.Thermal conditions can be adapted by user defined or predefined heat sinks. Beside single operation points complete load cycles may be calculated. Results will be shown in tabular and graphic representation and can be saved for later revision or printed as .pdf file1. Getting Started – Topology Selection2. Input & Output parametersIn the first step, please select yourapplication topologyNow all available parts matching your criteria are displayed.Switch to the “Recommended parts” tab to define additional environmental parameters, such ascooling method & ambient temperature.3. Device SelectionDefault settings are displayed – they can bechanged to match your requirementsNow you can define the heatsink by selecting a standard or user defined heatsink type.4.Definition of Thermal ConditionsIn the load cycle tab you can define your load profile by setting application specific time & currentsInterpolation5.Results / SummaryIn the Module Overview, the analysis shows you whether the calculated junction temperature is within range. If it is greater, the devices are marked red.6. Save your DesignSimulation Results。